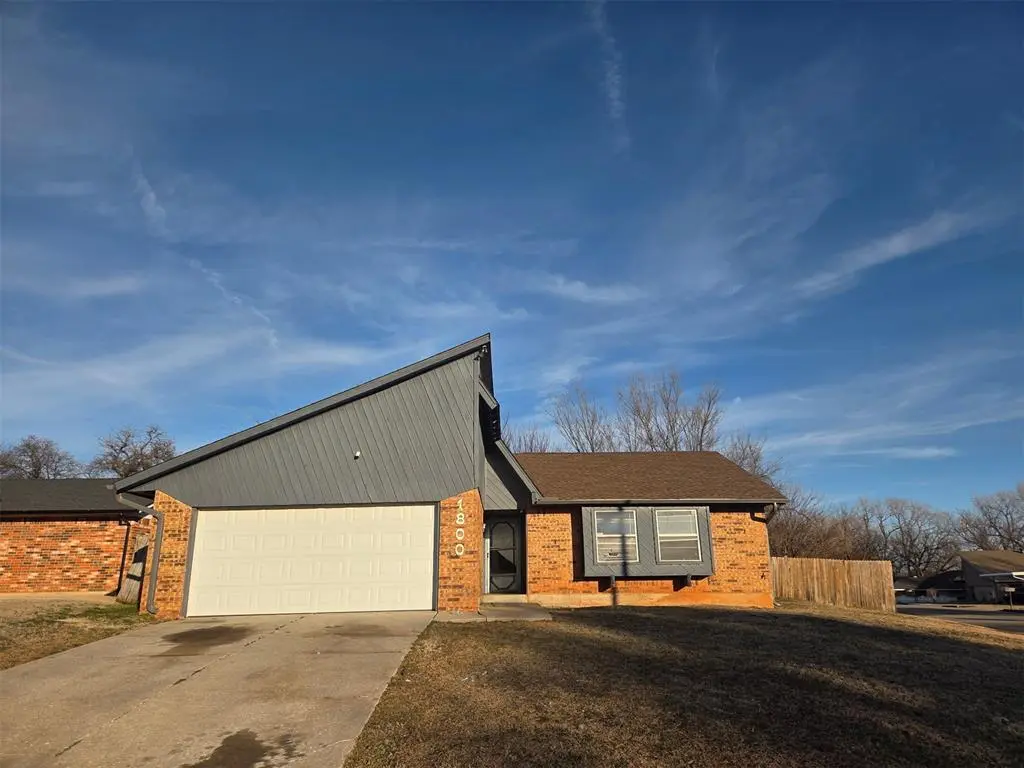
1800 David Ter · Midwest City, OK
Flood risk 1/10 · Minimal
- FEMA flood zone
- X (unshaded)
- Chance of flooding over 30 yrs
- 0.0%
- Est. flood insurance / yr
- $507 – $1,088
Fire risk 2/10 · Minimal
- Est. fire insurance / yr
- $2,463 – $4,575
Heat risk 6/10 · Moderate
- Hot days now (above 107°F)
- 7 days/yr
- Hot days in 30 yrs
- 19 days/yr
Wind risk 3/10 · Minor
- Chance of severe wind over 30 yrs
- 4.0%
Air-quality risk 2/10 · Minimal
- Unhealthy air days now
- 1 days/yr
- Unhealthy air days in 30 yrs
- 2 days/yr
Risk factors via First Street. Map © Google.
Why this score? — see what drove the B grade
The composite is a weighted blend of 9 inputs, each scored 0–100. Each bar is that input's sub-score; the figure is the points it added to the 100-point composite (weight × sub-score).
- Cash flow +25.3/30.0
- ARV discount +15.0/15.0
- DSCR +8.3/10.0
- 1% rule +6.1/10.0
- Appreciation +6.1/10.0
- Livability +3.6/5.0
- Rent growth +2.5/5.0
- Condition / age +2.5/5.0
- Schools +0.7/10.0
$119,000
🖨 Deal sheet 📄 Offer letter ✓ Due diligence
Listing remarks MLS
Under Contract - Accepting Back-Up Offers. Great investment opportunity! Nice corner lot home features 3 beds, 2 baths, & living area w/fireplace. Convenient location, quick access to all shopping and restaurants.
Key facts
- Tile in bathrooms
- Tile in kitchen
- Wood-like flooring
Tags
Property features AI
Finance
- Other: Lot size approximately 0.15 acre; Located in East Oaks addition; No storm shelter
- Financial info: Sold as-is; Not assumable
- HOA & community: No mandatory association dues
Exterior
- Parking: 2-car garage
- Home design: Single family residence; One level; Residential property
- Construction: Brick and frame construction; Composition roof; Slab foundation; Built (existing)
- Exterior features: Covered porch; Interior lot
Interior
- Bedrooms: 3 bedrooms
- Bathrooms: 2 full bathrooms
- Interior features: One living area; No fireplace
Neighborhood map
What this means for you Summary
Snapshot
- This is a 3-bed/2.0-bath single-family listed at $119k.
Deal economics
- At list price, monthly cash flow is $270 ($3k/yr) — positive.
- The deal already cash-flows at list — no discount required.
- Meets the 1% rule at list price ($1k rent vs $119k).
- Recommended offer: $115k (3.0% below list) — sets the bar for market timing.
- Cap rate 9.0% vs local median 5.6% in Midwest City — top-decile yield for the area; either an underpriced asset or a hidden risk that comps aren't pricing in. Stress-test before assuming the spread holds.
Location & tenants
- Location reads 71/100 on livability (#30 in OK) — a middle-class / working-renter tenant base. Strengths: cost of living A+, housing A+, health & safety A; Watch: crime D+, schools D, employment D.
- Oklahoma City (urban): math 7% / reading 10% proficiency, ranked #254 of 270 in OK (top 94%) — low school quality limits family demand, transient renter base, plan for 1-2y turnover; 82% free/reduced lunch — lower-income household profile, screen leases tightly.
- Market conditions: 26 active listings in the ZIP; 38 comparable units currently listed for rent nearby; rentals at typical pace (median 16d on market — plan ~3-4 weeks tenant-placement turnaround); 5,365 units permitted in Oklahoma County in 2024 (569 in 5+ unit buildings).
Forward outlook
- In year one you build about $3k of equity ($823 loan paydown + $3k appreciation (2.2% local appreciation)).
- Oklahoma County population projected at +41% by 2050 — long-run rental-demand tailwind backs the buy-and-hold thesis.
- At projected returns (2.2% appreciation + 3.0% rent growth), your $33k cash investment doubles in ~5 years — after that, you're playing with house money.
- By year 10, paydown + projected appreciation supports a ~$33k cash-out refi (75% LTV) — recoverable capital for the next deal without selling this one.
Negotiation context
- It's been on market 56 days — a 3% lower offer ($115k) is reasonable based on typical stale-listing flexibility.
- 5 sale attempts since 15y ago with the ask held roughly flat each time — persistent listings suggest the price (not the market) is what's stuck; bring a comps-based counter.
- Current owner paid $73k; list at $119k implies a 63% gain — meaningful room to come down on a strong offer.
Risks & watch-outs
- Climate carrying-cost: extreme-heat days projected 7→19/yr by 2055 (HVAC capex compounding) — expect insurance premiums to compound above CPI over the hold.
Questions for the listing agent
- It's been on market 56 days. Have you received any prior offers? Is the seller open to a 3% concession, seller financing, or rate buy-down credit?
- Is there a deadline driving the sale (1031 exchange, divorce, estate, relocation)? That informs how much negotiation room exists.
- Schools are D-rated, which usually means shorter tenancies and higher turnover. Who's the typical renter profile here, and what's been the actual vacancy rate?
- Crime grade is D in this area — have there been break-ins, vandalism, or insurance claims at this property in the last 3 years? What carrier currently insures it and at what premium?
- What's the average days-on-market for RENTAL listings here right now (not sales)? A rising rental-DOM trend means longer vacancies and softer asking-rent achievability than the comps imply.
- What's the recent tenant-quality profile in this submarket — average credit score on applications, eviction rate, late-payment / NSF rate, and stable-employment percentage? A property-management company in the area should have these aggregated.
- How much new for-sale + rental construction is in the pipeline within 1–3 miles? Heavy new supply typically softens prices + rents 12–24 months out; constrained supply supports both.
Investment metrics
- 1% rule
- 1.11% ✓
- Cap rate
- 9.01%
- Cash-on-cash
- 9.72%
- DSCR
- 1.43
- GRM
- 7.5
CMA / ARV
- ARV (on-the-fly)
- $149,225
- Comps found
- 12
Show comp detail 12 sales within ~0.75 mi
| Address | Dist | Beds/Ba | Sqft | Sold | Price | $/sf | Match |
|---|---|---|---|---|---|---|---|
| 1816 Michell Dr | 0.06mi | 3/2.0 | 1,108 (-6%) | 5mo | $130,000 | $117 | 83 |
| 9904 Mark Trl | 0.07mi | 3/2.0 | 1,105 (-6%) | 5mo | $175,000 | $158 | 83 |
| 10015 Isaac Dr | 0.36mi | 3/1.5 | 1,142 (-3%) | 1mo | $164,000 | $144 | 75 |
| 10014 Caton Pl | 0.34mi | 3/1.5 | 1,076 (-8%) | 2mo | $145,000 | $135 | 67 |
| 1625 Melinda Ln | 0.66mi | 4/1.5 (+1) | 1,162 (-1%) | 4mo | $129,999 | $112 | 57 |
| 2608 N Outpost Dr | 0.51mi | 4/2.0 (+1) | 1,100 (-6%) | 5mo | $139,900 | $127 | 56 |
| 1912 N Saint Peter Ave | 0.50mi | 2/1.0 (-1) | 1,110 (-6%) | 3mo | $132,000 | $119 | 56 |
| 1617 Mcgregor Dr | 0.33mi | 3/1.5 | 1,012 (-14%) | 5mo | $105,000 | $104 | 56 |
| 9304 NE 16th St | 0.56mi | 3/1.5 | 1,059 (-10%) | 5mo | $154,000 | $145 | 52 |
| 9720 NE 29th St | 0.74mi | 3/2.0 | 1,052 (-10%) | 2mo | $138,000 | $131 | 46 |
| 1520 Patricia Dr | 0.69mi | 3/1.0 | 1,040 (-12%) | 6mo | $120,000 | $115 | 40 |
| 9100 Jennifer Pl | 0.74mi | 4/1.0 (+1) | 1,006 (-14%) | 6mo | $99,000 | $98 | 28 |
Match score weights: distance 35% · size 25% · config 20% · recency 20%. Top-matched comps best support the ARV.
Projected returns pro-forma
2.19% appreciation · 3.0% rent growth · sell at horizon
- IRR
- 14.6%
- Equity multiple
- 1.79×
- Total profit
- $26,461
- Equity at exit
- $48,140
- IRR
- 17.0%
- Equity multiple
- 3.30×
- Total profit
- $76,619
- Equity at exit
- $70,259
Cash invested: $33,320 (down + closing). Projections, not guarantees.
Landlord ↔ Tenant lean methodology
- Overall (STATE)
- 83 Strongly Landlord-Friendly
- State Oklahoma
- 83 Strongly Landlord-Friendly · R+20
- County
- — inherits STATE
- City
- — inherits STATE
ZIP-level market 73141
- Home prices YoY
- 0.7%
- Active inventory
- 26
- Price-to-rent
- 7.5×
Monthly cashflow live
- Estimated rent
- $1,323 high interval (Pro) →
- Mortgage (P&I)
- −$624
- Tax from tax record
- −$102 /mo · $1,220/yr
- Insurance
- −$50
- HOA
- −$0
- Vacancy / Maint / Mgmt
- −$278
- Net cashflow
- $270
Break-even live
UW: 25.0% down · 7.5% · 30yr · 1.5% tax · 5.0% vac · 8.0% maint · 8.0% mgmt
Financing live
Cash to close
- Down payment
- $29,750
- Closing costs
- $3,570
- Reserves months
- —
- Total cash needed
- —
Loan-product check · same deal, 3 products live
Conventional
25% down · 7.5% · 30yr
- Down + closing
- —
- Monthly P&I
- —
- Monthly cashflow
- —
- DSCR
- —
- Eligible?
- —
Personal DTI + credit; lowest rate.
DSCR
20% down · 8.5% · 30yr
- Down + closing
- —
- Monthly P&I
- —
- Monthly cashflow
- —
- DSCR
- —
- Eligible?
- —
No personal income docs; deal must DSCR.
Hard money
10% down · 12.0% · 12mo
- Down + closing
- —
- Monthly P&I
- —
- Monthly cashflow
- —
- DSCR
- —
- Eligible?
- —
Short-term bridge; refi at stabilization.
Rent comps 38 comps
| Address | Beds | Baths | Sqft | Rent | $/sqft | DOM | Units | Dist |
|---|---|---|---|---|---|---|---|---|
| 1809 Michell Dr Oklahoma City, OK | 3.0 | 1.0 | 1125 | $1,095 | $0.97 | 2d | 1 | 0.03mi |
| 1817 Tim Dr Oklahoma City, OK | 3.0 | 2.0 | 1373 | $1,399 | $1.02 | 1d | 1 | 0.12mi |
| 1617 N Christine Dr Oklahoma City, OK | 2.0 | 2.0 | 962 | $1,050 | $1.09 | 23d | 1 | 0.29mi |
| 1525 N Christine Dr Oklahoma City, OK | 3.0 | 1.5 | 1264 | $1,035 | $0.82 | 2d | 1 | 0.32mi |
| 1525 McGregor Dr Oklahoma City, OK | 3.0 | 1.5 | 1012 | $1,275 | $1.26 | 1d | 1 | 0.36mi |
| 10220 Isaac Dr Oklahoma City, OK | 3.0 | 1.0 | 1106 | $1,250 | $1.13 | 43d | 1 | 0.52mi |
| 1400 Alan Ln Oklahoma City, OK | 3.0 | 2.0 | 1288 | $1,495 | $1.16 | 43d | 1 | 0.56mi |
| 1216 McGregor Dr Oklahoma City, OK | 4.0 | 1.5 | 1212 | $1,495 | $1.23 | 2d | 1 | 0.56mi |
| 9604 NE 11th St Oklahoma City, OK | 4.0 | 1.0 | 1280 | $1,795 | $1.40 | 1d | 1 | 0.58mi |
| 10400 Caton Pl Oklahoma City, OK | 3.0 | 2.0 | 1164 | $1,280 | $1.10 | 23d | 1 | 0.61mi |
| 9528 McIntosh Ave Oklahoma City, OK | 3.0 | 2.0 | 1164 | $1,195 | $1.03 | 43d | 1 | 0.63mi |
| 9212 Jennifer Pl Oklahoma City, OK | 3.0 | 2.0 | 960 | $1,250 | $1.30 | 43d | 1 | 0.66mi |
| 1520 Patricia Dr Oklahoma City, OK | 3.0 | 1.0 | 1040 | $1,200 | $1.15 | 43d | 1 | 0.68mi |
| 1400 Marydale Ave Oklahoma City, OK | 3.0 | 1.0 | 1082 | $1,150 | $1.06 | 15d | 1 | 0.69mi |
| 1620 Cynthia Dr Oklahoma City, OK | 4.0 | 1.0 | 1203 | $1,450 | $1.21 | 43d | 1 | 0.69mi |
| 1617 Cynthia Dr Oklahoma City, OK | 4.0 | 1.0 | 1161 | $1,450 | $1.25 | 43d | 1 | 0.72mi |
| 801 Royal Ave Oklahoma City, OK | 3.0 | 1.0 | 951 | $1,200 | $1.26 | 16d | 1 | 0.81mi |
| 10601 Tumilty Ter Oklahoma City, OK | 4.0 | 2.0 | 1377 | $1,820 | $1.32 | 23d | 1 | 0.85mi |
| 1168 N Douglas Blvd Oklahoma City, OK | 1.0–2.0 | 1.0 | 725 | $1,020 | $1.41 | 16d | 1 | 0.94mi |
| 645 Lloyd Ave Oklahoma City, OK | 4.0 | 1.5 | 1186 | $1,650 | $1.39 | 1d | 1 | 0.94mi |
| 1619 N Douglas Blvd Oklahoma City, OK | 3.0 | 2.0 | 1152 | $1,129 | $0.98 | 1d | 1 | 0.95mi |
| 633 Lotus Ave Oklahoma City, OK | 3.0 | 1.0 | 1038 | $1,300 | $1.25 | 10d | 1 | 0.96mi |
| 629 Lloyd Ave Oklahoma City, OK | 4.0 | 1.5 | 1213 | $1,095 | $0.90 | 3d | 1 | 0.99mi |
| 2008 Midridge Dr Oklahoma City, OK | 3.0 | 2.0 | 1232 | $1,325 | $1.08 | 14d | 1 | 1.00mi |
| 8741 Hillridge Dr Oklahoma City, OK | 3.0 | 2.0 | 1182 | $1,495 | $1.26 | 1d | 1 | 1.03mi |
| 8741 Hillridge Dr Oklahoma City, OK | 3.0 | 2.0 | 1182 | $1,495 | $1.26 | 43d | 1 | 1.03mi |
| 604 Moraine Ave Oklahoma City, OK | 3.0 | 1.5 | 1181 | $1,395 | $1.18 | 1d | 1 | 1.07mi |
| 405 Lotus Ave Oklahoma City, OK | 3.0 | 2.0 | 1300 | $1,611 | $1.24 | 1d | 1 | 1.23mi |
| 910 N Oakview Dr Oklahoma City, OK | 3.0 | 2.0 | 1512 | $1,239 | $0.82 | 1d | 1 | 1.26mi |
| 1632 N Spencer Rd Oklahoma City, OK | 2.0 | 1.0 | 772 | $895 | $1.16 | 14d | 1 | 1.33mi |
| 8910 Oak Valley Dr Oklahoma City, OK | 2.0 | 2.0 | 935 | $1,000 | $1.07 | 20d | 1 | 1.36mi |
| 2823 Juvene Cir Spencer, OK | 3.0 | 2.0 | 1080 | $1,800 | $1.67 | 2d | 1 | 1.36mi |
| 9705 Oak Tree Ter Oklahoma City, OK | 3.0 | 2.0 | 1100 | $1,410 | $1.28 | 10d | 1 | 1.41mi |
| 8511 Justin Pl Oklahoma City, OK | 2.0 | 1.0 | 962 | $950 | $0.99 | 14d | 1 | 1.41mi |
| 4033 S Locust Dr Oklahoma City, OK | 2.0 | 1.0 | 800 | $900 | $1.12 | 23d | 1 | 1.44mi |
| 1020 N Spencer Rd Oklahoma City, OK | 2.0 | 1.0 | 962 | $895 | $0.93 | 23d | 1 | 1.45mi |
| 1014 Spencer Rd Oklahoma City, OK | 2.0 | 2.0 | 800 | $1,000 | $1.25 | 43d | 1 | 1.45mi |
| 217 Saint Charles Way Oklahoma City, OK | 4.0 | 2.0 | 1448 | $1,525 | $1.05 | 23d | 1 | 1.47mi |
Listing history 18 events
-
2026-04-19status Pending
-
2026-04-06price $119,000
-
2026-04-06status Active
-
2026-03-30status Pending
-
2026-02-15$125,000 Active
-
2018-08-29soldstatus $73,000
-
2018-08-28soldstatus $72,715 Sold 219-char remark
Show marketing remark (219 chars)
Under Contract - Accepting Back-Up Offers. Great investment opportunity! Nice corner lot home features 3 beds, 2 baths, & living area w/fireplace. Convenient location, quick access to all shopping and restaurants.
-
2018-08-24status Pending 219-char remark
Show marketing remark (219 chars)
Under Contract - Accepting Back-Up Offers. Great investment opportunity! Nice corner lot home features 3 beds, 2 baths, & living area w/fireplace. Convenient location, quick access to all shopping and restaurants.
-
2018-03-31price $68,500 219-char remark
Show marketing remark (219 chars)
Under Contract - Accepting Back-Up Offers. Great investment opportunity! Nice corner lot home features 3 beds, 2 baths, & living area w/fireplace. Convenient location, quick access to all shopping and restaurants.
-
2018-02-10price $69,900 219-char remark
Show marketing remark (219 chars)
Under Contract - Accepting Back-Up Offers. Great investment opportunity! Nice corner lot home features 3 beds, 2 baths, & living area w/fireplace. Convenient location, quick access to all shopping and restaurants.
-
2017-09-21price $74,900 219-char remark
Show marketing remark (219 chars)
Under Contract - Accepting Back-Up Offers. Great investment opportunity! Nice corner lot home features 3 beds, 2 baths, & living area w/fireplace. Convenient location, quick access to all shopping and restaurants.
-
2017-08-29$79,900 Active 219-char remark
Show marketing remark (219 chars)
Under Contract - Accepting Back-Up Offers. Great investment opportunity! Nice corner lot home features 3 beds, 2 baths, & living area w/fireplace. Convenient location, quick access to all shopping and restaurants.
-
2013-05-22historical
-
2012-11-26$69,900
-
2011-11-01soldstatus $26,000
-
2011-08-19$27,500
-
2001-08-30soldstatus $53,000
-
1985-03-01soldstatus $57,500
ⓘ Source: listings_history table (triggers on properties + properties_extension) + one-shot
backfill from property_details.listing_events for pre-trigger history.
Tax reassessment forecast OK · Resets to sale price
- Current annual tax
- $1,220 · $102/mo
- Projected year-2 tax
- $1,220 · $102/mo
- Expected delta
- $0/yr ($0/mo · 0.0%)
ⓘ Screening estimate from a state-policy table — verify with the county assessor before closing.
Climate risk First Street
- Flood 1/10 Low FEMA zone X (unshaded) · 0% chance over 30 yrs
- Wildfire 2/10 Low
- Heat 6/10 Major 7 d/yr ≥107°F today · 19 d/yr by 30 yrs out
- Wind 3/10 Moderate 4% chance of damaging wind over 30 yrs
- Air quality 2/10 Low 1 unhealthy d/yr today · 2 by 30 yrs out
Nearby sold comps map
Loading sold comps map…
Walkable amenities ~0.75 mi
Loading nearby amenities…
Taxation est. · year 1
- Rental income
- $15,874
- − Mortgage interest
- −$6,666
- − Property taxes
- −$1,220
- − Insurance
- −$595
- − Repairs & maintenance
- −$1,270
- − Management
- −$1,270
- − Depreciation
- −$3,462
- Taxable income
- $1,392
- Est. tax owed @ 24.0%
- −$334
- After-tax cash flow
- $2,903/yr
For passive investors: Depreciation is non-cash, so a rental often shows a tax loss while cash-flowing — sheltering income. Rental losses are passive: they offset passive income freely, and up to $25,000/yr can offset ordinary (W-2) income if you actively participate and your MAGI is under $100k (phasing out to $0 by $150k); unused losses carry forward. On sale, claimed depreciation is recaptured at up to 25%, and gains may owe capital-gains tax (a 1031 exchange can defer both). Figures are a year-1 estimate at your 24.0% rate — not tax advice; consult a CPA.
Schools (NCES district)
- District
- Oklahoma City
- NCES district ID
- 4022770
- Math proficiency
- 7% ▼ -5.00%
- Reading proficiency
- 10% ▼ -6.00%
- Median HH income
- $35,606
- Composite
- 7.0/100
- National rank
- #9970
- State rank
- #254 of 270 in OK
Livability — Midwest City
- Score
- 71/100
- State rank
- #30
- US rank
- #6637
Category grades
Schools grade is shown separately in the Schools card above.
Census & demographics
- Census place
- Midwest City, OK
- County
- Oklahoma County · 771,644 people
- City population
- 57,386
- Metro
- Oklahoma City, OK
- Population (ZIP)
- 3,562
- Household income
- $58,670
- Rent vs Own
- Severe rent burden
- 54.0
Population outlook (Oklahoma County) Hauer SSP2
- Today (2025)
- 911,875 people
- By 2030
- 982,413 · +7.7%
- By 2040
- 1,130,468 · +24.0%
- By 2050
- 1,288,422 · +41.3%
- By 2075
- 1,711,482 · +87.7%
- By 2100
- 2,088,448 · +129.0%
Race, ethnicity, and origin ACS 2023
- Neighborhood character
- Diverse neighborhood (Simpson 0.67)
- Race & ethnicity
- Black 43% White 35% Hispanic / Latino 15% Two or more races 11%
- Hispanic origin (detail)
- Mexican 14%
- Common ancestry
- Iranian 2% Serbian 1%
- Foreign-born
- 4% · Canada
- Languages at home
- 91% English-only · Spanish 9%
Political lean MEDSL · Oklahoma
- 2024 margin
- Toss-up / Even · D 48.0% · R 49.7% · Other 2.3%
- 2008→2024 swing
- +15.1pp toward D · 2008: -16.8pp · 2024: -1.7pp
- All cycles
- 2024: R+1.7 2020: R+1.1 2016: R+10.5 2012: R+16.7 2008: R+16.8
Not yet ingested
- Civics
- —
Market trends
- HPI YoY
- ▲ 2.19%
- Current HPI
- 312.8025
- Rent YoY
- —
- Metro
- Oklahoma City, OK
- State GDP YoY
- ▲ 1.55%
- F500 in state
- 6
Industry mix (Fortune 500 HQ in OK)
| Industry | F500 HQs | Revenue |
|---|---|---|
| Energy | 3 | $48B |
|
||
Price history
+107.0% since first listed18 events — show timeline
- 2026-04-19 Pending — MLSOK
- 2026-04-06 Price Changed $119,000 MLSOK
- 2026-04-06 Relisted — MLSOK
- 2026-03-30 Pending — MLSOK
- 2026-02-15 Listed $125,000 MLSOK
- 2018-08-29 Sold (Public Records) $73,000 Public Records
- 2018-08-28 Sold (MLS) $72,715 MLSOK
- 2018-08-24 Pending — MLSOK
- 2018-03-31 Price Changed $68,500 MLSOK
- 2018-02-10 Price Changed $69,900 MLSOK
- 2017-09-21 Price Changed $74,900 MLSOK
- 2017-08-29 Listed $79,900 MLSOK
- 2013-05-22 Listing Removed — MLSOK
- 2012-11-26 Listed $69,900 MLSOK
- 2011-11-01 Sold (MLS) $26,000 MLSOK
- 2011-08-19 Listed $27,500 MLSOK
- 2001-08-30 Sold (Public Records) $53,000 Public Records
- 1985-03-01 Sold (Public Records) $57,500 Public Records
Property tax history
+4.6%/yrLatest (2025): $1,220 · +3.4% YoY. Source: county tax records.
Cash-flow waterfall
monthlySold comps — $/sqft
last 12 mo · ≤1 miLoading sold comps…