31 Capitol Mews · Ranson, WV
Flood risk No data
- FEMA flood zone
- —
- Chance of flooding over 30 yrs
- —
- Est. flood insurance / yr
- —
Fire risk No data
- Est. fire insurance / yr
- —
Heat risk No data
- Hot days now (above threshold)
- —
- Hot days in 30 yrs
- —
Wind risk No data
- Chance of severe wind over 30 yrs
- —
Air-quality risk No data
- Unhealthy air days now
- —
- Unhealthy air days in 30 yrs
- —
Risk factors via First Street. Map © Google.
Why this score? — see what drove the D grade
The composite is a weighted blend of 9 inputs, each scored 0–100. Each bar is that input's sub-score; the figure is the points it added to the 100-point composite (weight × sub-score).
- Appreciation +10.0/10.0
- ARV discount +7.9/15.0
- Cash flow +7.7/30.0
- Schools +3.4/10.0
- Livability +3.3/5.0
- Rent growth +2.5/5.0
- Condition / age +2.5/5.0
- 1% rule +1.8/10.0
- DSCR +1.8/10.0
$320,000
🖨 Deal sheet (PDF) 📄 Offer letter ✓ Due diligence
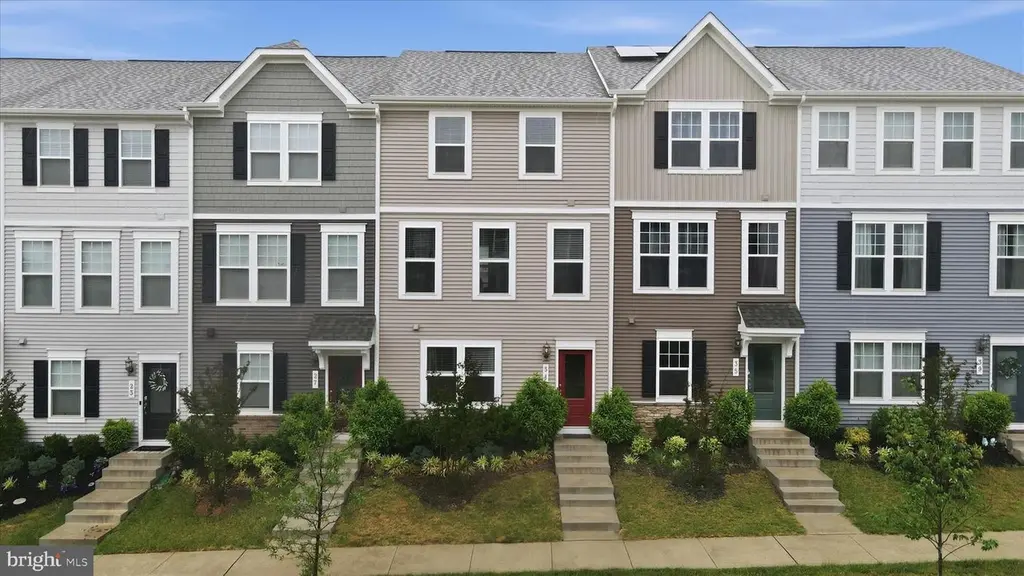
Listing remarks
Great Opportunity to own practically a brand new townhome for less money!! This townhouse is centrally located where the small court yard is, it has a large 2 car garage with the double driveway to park 4 cars. This is one of the larger townhouses in the neighbor hood (1641 sq ft) and is ready to move in! This was a second home for the sellers. This one is a must see at this price! Check out the virtual tour here too!
Key facts
- $61 HOA
- 2 garage spots
- Built 2022
Property features AI
Finance
- Other: Property is located within city limits of Ranson
- HOA & community: Homeowners association fee of $732 annually
Exterior
- Parking: Rear-entry attached garage with additional storage (2 garage spaces); Driveway parking for approximately 4 vehicles; Total of about 6 garage and parking spaces
- Utilities: Public water; Public sewer; Electric cooling fuel; Electric heating fuel; Electric power for hot water
- Home design: Interior townhouse/rowhouse; Fee simple ownership
- Construction: Aluminum siding; Permanent foundation; Built with above-grade finished area and finished below-grade area
- Exterior features: Not in a federal flood zone; Above-grade and below-grade structures noted
Interior
- Kitchen: Built-in microwave; Stainless steel appliances; Stove; Refrigerator; Dishwasher
- Bedrooms: Three bedrooms on the upper level
- Bathrooms: Two full bathrooms (upper level); One half bathroom on the main level
- Heating & cooling: Heat pump heating (electric); Central air conditioning; Ceiling fans
- Interior features: Full basement; Assessor-provided living area and finished/unfinished area information
- Laundry & utility: Washer; Dryer; Electric hot water
Neighborhood map
What this means for you Summary
Snapshot
- This is a 3-bed/2.5-bath townhouse listed at $320k.
Deal economics
- At list price, monthly cash flow is $-371 ($-4k/yr) — negative.
- To cash-flow at today's rent, offer at most $255k (20.5% below list).
- To meet the 1% rule (rent ≥ 1% of price), the offer needs to be $216k (32.5% below list).
- Recommended offer: $216k (32.5% below list) — sets the bar for 1% rule.
- Cap rate 4.9% vs local median 3.8% in Ranson — meaningfully above typical; check what's discounted (condition, days-on-market, listing class) to confirm the premium yield is real.
Location & tenants
- Location reads 66/100 on livability (#100 in WV) — a middle-class / working-renter tenant base. Strengths: crime A+, housing A+, cost of living A-; Watch: amenities F, commute F, health & safety F.
- Jefferson County Schools (rural): math 29% / reading 46% proficiency, ranked #6 of 55 in WV (top 11%) — families likely to look elsewhere, expect single-tenant / working-renter base with shorter leases.
- Zoned schools: T A Lowery Elementary School (math 27% / reading 37%, grade F, #191 of 377 statewide, top 56%, 522 students, 0% FRL); Wildwood Middle School (math 15% / reading 40%, grade F, #70 of 109 statewide, top 65%, 425 students, 0% FRL); Jefferson High School (math 30% / reading 62%, grade D-, #9 of 110 statewide, top 7%, 1,444 students, 0% FRL) — zoned schools average 0% FRL vs 33% district-wide (33 pts lower); this property's tenant base skews higher-income than the district average.
- Market conditions: 323 active listings in the ZIP; 19 comparable units currently listed for rent nearby; rentals at typical pace (median 15d on market — plan ~3-4 weeks tenant-placement turnaround); solid renter incomes; 1,162 units permitted in Jefferson County in 2024 (360 in 5+ unit buildings).
- This rent runs 32% of the median local income ($82k/yr) — at the standard rent-burdened threshold; future hikes will face affordability resistance.
Forward outlook
- In year one you build about $34k of equity ($2k loan paydown + $32k appreciation (10.0% local appreciation)).
- Jefferson County population projected at +13% by 2050 — modest demand growth; plan on rents tracking national, not racing it.
- By year 2, paydown + projected appreciation supports a ~$55k cash-out refi (75% LTV) — recoverable capital for the next deal without selling this one.
Negotiation context
- It's been on market 30 days — a 2% lower offer ($315k) is reasonable based on typical stale-listing flexibility.
- 2 sale attempts with the ask held roughly flat each time — persistent listings suggest the price (not the market) is what's stuck; bring a comps-based counter.
Questions for the listing agent
- What do current leases actually rent for vs. the listed asking? Can we see a recent rent roll and the last 12 months of T-12 income?
- What does the HOA fee cover, when was the last increase, and are there any pending special assessments or reserve-fund shortfalls?
- Is there a deadline driving the sale (1031 exchange, divorce, estate, relocation)? That informs how much negotiation room exists.
- Schools are F-rated, which usually means shorter tenancies and higher turnover. Who's the typical renter profile here, and what's been the actual vacancy rate?
- The area grade is low — what's the realistic commute time and amenity access for the typical tenant pool here? Any planned neighborhood developments (good or bad) we should know about?
- What's the average days-on-market for RENTAL listings here right now (not sales)? A rising rental-DOM trend means longer vacancies and softer asking-rent achievability than the comps imply.
- What's the recent tenant-quality profile in this submarket — average credit score on applications, eviction rate, late-payment / NSF rate, and stable-employment percentage? A property-management company in the area should have these aggregated.
- How much new for-sale + rental construction is in the pipeline within 1–3 miles? Heavy new supply typically softens prices + rents 12–24 months out; constrained supply supports both.
Investment metrics
- 1% rule
- 0.68% ✗
- Cap rate
- 4.90%
- Cash-on-cash
- -4.96%
- DSCR
- 0.78
- GRM
- 12.3
CMA / ARV
- ARV (on-the-fly)
- $322,825
- Comps found
- 12
Show comp detail 12 sales within ~0.75 mi
| Address | Dist | Beds/Ba | Sqft | Sold | Price | $/sf | Match |
|---|---|---|---|---|---|---|---|
| 308 Presidents Pointe Ave #611 | 0.02mi | 3/2.5 | 1,731 (-1%) | 1mo | $319,990 | $185 | 97 |
| 316 Presidents Pointe Ave #613 | 0.02mi | 3/2.5 | 1,731 (-1%) | 1mo | $344,990 | $199 | 97 |
| 300 Presidents Pointe Ave #609 | 0.02mi | 3/2.5 | 1,731 (-1%) | 1mo | $340,000 | $196 | 97 |
| 431 Presidents Pointe Ave #450 | 0.16mi | 3/2.5 | 1,731 (-1%) | 1mo | $349,990 | $202 | 90 |
| 22 United Mews #536 | 0.23mi | 3/2.5 | 1,731 (-1%) | 1mo | $349,990 | $202 | 87 |
| 14 United Mews #534 | 0.24mi | 3/2.5 | 1,731 (-1%) | 1mo | $312,490 | $181 | 87 |
| 18 United Mews #535 | 0.25mi | 3/2.5 | 1,731 (-1%) | 1mo | $319,990 | $185 | 86 |
| 348 Anthem St #442 | 0.20mi | 3/2.5 | 1,891 (+8%) | 1mo | $344,990 | $182 | 76 |
| 368 Anthem St #447 | 0.22mi | 2/2.5 (-1) | 1,656 (-5%) | 1mo | $299,990 | $181 | 76 |
| 376 Anthem St #449 | 0.22mi | 3/2.5 | 1,891 (+8%) | 1mo | $344,990 | $182 | 75 |
| 658 Thumper Dr | 0.52mi | 3/2.5 | 1,504 (-14%) | 0mo | $295,000 | $196 | 53 |
| 1729 Destrier St | 0.59mi | 3/3.0 | 1,951 (+12%) | 1mo | $329,990 | $169 | 50 |
Match score weights: distance 35% · size 25% · config 20% · recency 20%. Top-matched comps best support the ARV.
Projected returns pro-forma
10.0% appreciation · 3.0% rent growth · sell at horizon
- IRR
- 20.8%
- Equity multiple
- 2.68×
- Total profit
- $150,626
- Equity at exit
- $288,281
- IRR
- 18.8%
- Equity multiple
- 6.16×
- Total profit
- $462,033
- Equity at exit
- $621,690
Cash invested: $89,600 (down + closing). Projections, not guarantees.
Landlord ↔ Tenant lean methodology
- Overall (STATE)
- 83 Strongly Landlord-Friendly
- State West Virginia
- 83 Strongly Landlord-Friendly · R+22
- County
- — inherits STATE
- City
- — inherits STATE
ZIP-level market 25438
- Home prices YoY
- 10.3%
- Active inventory
- 323
- Price-to-rent
- 12.3×
Monthly cashflow live
- Estimated rent
- $2,162 high interval (Pro) →
- Mortgage (P&I)
- −$1,678
- Tax from tax record
- −$206 /mo · $2,469/yr
- Insurance
- −$133
- HOA
- −$61
- Vacancy / Maint / Mgmt
- −$454
- Net cashflow
- $-371
Break-even live
Sensitivity live
| Price | -10% $-189 | -5% $-280 | +0% $-371 | +5% $-461 | +10% $-552 |
|---|---|---|---|---|---|
| Rent | -10% $-541 | -5% $-456 | +0% $-371 | +5% $-285 | +10% $-200 |
| Rate | -1.0pp $-209 | -0.5pp $-289 | base $-371 | +0.5pp $-454 | +1.0pp $-538 |
UW: 25.0% down · 7.5% · 30yr · 1.5% tax · 5.0% vac · 8.0% maint · 8.0% mgmt
Financing live
Cash to close
- Down payment
- $80,000
- Closing costs
- $9,600
- Reserves months
- —
- Total cash needed
- —
Loan-product check · same deal, 3 products live
Conventional
25% down · 7.5% · 30yr
- Down + closing
- —
- Monthly P&I
- —
- Monthly cashflow
- —
- DSCR
- —
- Eligible?
- —
Personal DTI + credit; lowest rate.
DSCR
20% down · 8.5% · 30yr
- Down + closing
- —
- Monthly P&I
- —
- Monthly cashflow
- —
- DSCR
- —
- Eligible?
- —
No personal income docs; deal must DSCR.
Hard money
10% down · 12.0% · 12mo
- Down + closing
- —
- Monthly P&I
- —
- Monthly cashflow
- —
- DSCR
- —
- Eligible?
- —
Short-term bridge; refi at stabilization.
Rent comps 19 comps
| Address | Beds | Baths | Sqft | Rent | $/sqft | DOM | Units | Dist |
|---|---|---|---|---|---|---|---|---|
| 163 Anthem St Ranson, WV | 2.0 | 2.5 | 1386 | $2,500 | $1.80 | 6d | 1 | 0.04mi |
| 99 Anthem St Ranson, WV | 2.0 | 2.5 | 1387 | $2,000 | $1.44 | 26d | 1 | 0.04mi |
| 300 Presidents Pointe Ave Ranson, WV | 3.0 | 2.5 | 1731 | $2,200 | $1.27 | 20d | 1 | 0.05mi |
| 34 Coolidge Ave Ranson, WV | 2.0 | 2.5 | 1397 | $1,850 | $1.32 | 3d | 1 | 0.07mi |
| 36 Anthem St Ranson, WV | 2.0 | 2.5 | 1397 | $1,800 | $1.29 | 26d | 1 | 0.10mi |
| 214 Coolidge Ave Ranson, WV | 2.0 | 2.5 | 1387 | $1,925 | $1.39 | 20d | 1 | 0.15mi |
| 495 National St Ranson, WV | 2.0 | 2.5 | 1330 | $1,850 | $1.39 | 26d | 1 | 0.16mi |
| 112 Cecily Way Unit 112 Ranson, WV | 3.0 | 4.0 | 1905 | $2,100 | $1.10 | 7d | 1 | 0.35mi |
| 51 Cecily Way Ranson, WV | 3.0 | 2.5 | 1998 | $2,000 | $1.00 | 14d | 1 | 0.37mi |
| 1247 Mare St Ranson, WV | 3.0 | 2.5 | 1985 | $2,080 | $1.05 | 26d | 1 | 0.61mi |
| 452 18th Ave Ranson, WV | 3.0 | 2.5 | 1726 | $1,895 | $1.10 | 0d | 1 | 0.76mi |
| 1344 Red Clover Ln Ranson, WV | 3.0 | 2.5 | 1723 | $2,099 | $1.22 | 14d | 1 | 0.77mi |
| 1130 Stallion St Ranson, WV | 3.0 | 2.5 | 1648 | $1,900 | $1.15 | 7d | 1 | 0.79mi |
| 1308 Cedar Valley Rd Unit 1308 Ranson, WV | 2.0 | 4.0 | 1333 | $1,899 | $1.42 | 26d | 1 | 0.80mi |
| 35 Short Branch Dr Ranson, WV | 3.0 | 2.5 | 1940 | $2,200 | $1.13 | 5d | 1 | 0.81mi |
| 405 17th Ave Ranson, WV | 3.0 | 2.5 | 1725 | $2,150 | $1.25 | 7d | 1 | 0.84mi |
| 415 17th Ave Ranson, WV | 3.0 | 2.5 | 1521 | $1,990 | $1.31 | 26d | 1 | 0.84mi |
| 271 Swan Field Ave Charles Town, WV | 3.0 | 2.5 | 1786 | $2,100 | $1.18 | 5d | 1 | 1.00mi |
| 406 Freeman St Ranson, WV | 3.0 | 2.5 | 1906 | $2,600 | $1.36 | 4d | 1 | 1.45mi |
HOA detail
- Monthly dues
- $61 · $732/yr
Listing history 20 events
-
2026-06-21days on market $320,000 Active 30 DOM
-
2026-06-18days on market $320,000 Active 27 DOM
-
2026-06-17days on market $320,000 Active 26 DOM
-
2026-06-16days on market $320,000 Active 25 DOM
-
2026-06-15days on market $320,000 Active 24 DOM
-
2026-06-13days on market $320,000 Active 22 DOM
-
2026-06-13days on market $320,000 Active 21 DOM
-
2026-06-09days on market $320,000 Active 18 DOM
-
2026-06-08days on market $320,000 Active 17 DOM
-
2026-06-07days on market $320,000 Active 16 DOM
-
2026-06-04days on market $320,000 Active 13 DOM
-
2026-06-03days on market $320,000 Active 12 DOM
-
2026-06-02days on market $320,000 Active 11 DOM
-
2026-06-01days on market $320,000 Active 10 DOM
-
2026-05-31days on market $320,000 Active 9 DOM
-
2026-05-22$320,000 Active
-
2026-05-12historical
-
2025-08-04price $325,000
-
2025-06-27price $320,000
-
2025-05-23$339,900 Active
ⓘ Source: listings_history table (triggers on properties + properties_extension) + one-shot
backfill from property_details.listing_events for pre-trigger history.
Tax reassessment forecast WV · Resets to sale price
- Current annual tax
- $2,469 · $206/mo
- Projected year-2 tax
- $2,469 · $206/mo
- Expected delta
- $0/yr ($0/mo · 0.0%)
ⓘ Screening estimate from a state-policy table — verify with the county assessor before closing.
Nearby sold comps map
Loading sold comps map…
Walkable amenities ~0.75 mi
Loading nearby amenities…
Taxation est. · year 1
- Rental income
- $25,938
- − Mortgage interest
- −$17,925
- − Property taxes
- −$2,469
- − Insurance
- −$1,600
- − Repairs & maintenance
- −$2,075
- − Management
- −$2,075
- − HOA
- −$732
- − Depreciation
- −$9,309
- Taxable loss
- −$10,247
- Est. tax savings @ 24.0%
- +$2,459
- After-tax cash flow
- $-1,988/yr
For passive investors: Depreciation is non-cash, so a rental often shows a tax loss while cash-flowing — sheltering income. Rental losses are passive: they offset passive income freely, and up to $25,000/yr can offset ordinary (W-2) income if you actively participate and your MAGI is under $100k (phasing out to $0 by $150k); unused losses carry forward. On sale, claimed depreciation is recaptured at up to 25%, and gains may owe capital-gains tax (a 1031 exchange can defer both). Figures are a year-1 estimate at your 24.0% rate — not tax advice; consult a CPA.
Schools (NCES district)
- District
- Jefferson County Schools
- NCES district ID
- 5400570
- Math proficiency
- 29% ▼ -13.00%
- Reading proficiency
- 46% ▼ -7.00%
- Median HH income
- $67,038
- Composite
- 33.98/100
- National rank
- #5322
- State rank
- #6 of 55 in WV
Livability — Ranson
- Score
- 66/100
- State rank
- #100
- US rank
- #11255
Category grades
Schools grade is shown separately in the Schools card above.
Census & demographics
- Census place
- Ranson, WV
- County
- Jefferson County · 28,403 people
- City population
- 7,330
- Metro
- Washington-Arlington-Alexandria, DC-VA-MD-WV
- Population (ZIP)
- 7,330
- Household income
- $81,875
- Rent vs Own
- Severe rent burden
- 90.0
Population outlook (Jefferson County) Hauer SSP2
- Today (2025)
- 61,715 people
- By 2030
- 64,052 · +3.8%
- By 2040
- 67,713 · +9.7%
- By 2050
- 69,843 · +13.2%
- By 2075
- 72,679 · +17.8%
- By 2100
- 71,872 · +16.5%
Race, ethnicity, and origin ACS 2023
- Neighborhood character
- Predominantly White (72%)
- Race & ethnicity
- White 72% Hispanic / Latino 14% Two or more races 7% Black 7% Asian 3%
- Hispanic origin (detail)
- Mexican 3% Puerto Rican 4%
- Common ancestry
- Serbian 4% Italian 2% Romanian 2%
- Foreign-born
- 7% · Canada, Philippines
- Languages at home
- 87% English-only · Spanish 9% Other Asian/Pacific 3%
Political lean MEDSL · Jefferson
- 2024 margin
- R (+15.8) · D 41.0% · R 56.8% · Other 2.1%
- 2008→2024 swing
- -20.6pp toward R · 2008: 4.8pp · 2024: -15.8pp
- All cycles
- 2024: R+15.8 2020: R+10.5 2016: R+15.3 2012: R+4.0 2008: D+4.8
Not yet ingested
- Civics
- —
Market trends
- HPI YoY
- ▲ 32.87%
- Current HPI
- 352.707
- Rent YoY
- —
- Metro
- Washington-Arlington-Alexandria, DC-VA-MD-WV
- State GDP YoY
- —
- F500 in state
- 0
Price history
-5.9% since first listed5 events — show timeline
- 2026-05-22 Listed $320,000 BRIGHT MLS
- 2026-05-12 Listing Removed — BRIGHT MLS
- 2025-08-04 Price Changed $325,000 BRIGHT MLS
- 2025-06-27 Price Changed $320,000 BRIGHT MLS
- 2025-05-23 Listed $339,900 BRIGHT MLS
Property tax history
+6.2%/yrLatest (2025): $2,469 · +6.2% YoY. Source: county tax records.
Cash-flow waterfall
monthlySold comps — $/sqft
last 12 mo · ≤1 miLoading sold comps…