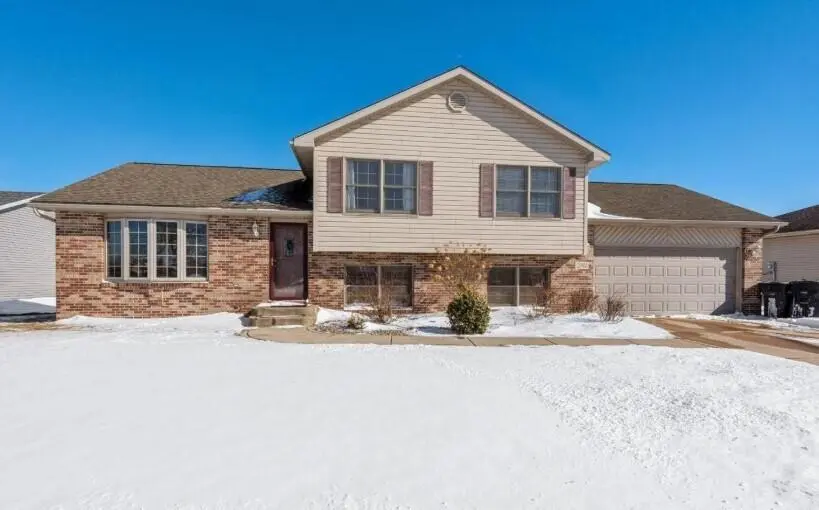
2911 Airport Rd · Portage, IN
Flood risk 1/10 · Minimal
- FEMA flood zone
- X (unshaded)
- Chance of flooding over 30 yrs
- 0.0%
- Est. flood insurance / yr
- $507 – $1,088
Fire risk 2/10 · Minimal
- Est. fire insurance / yr
- $717 – $1,331
Heat risk 3/10 · Minor
- Hot days now (above 101°F)
- 7 days/yr
- Hot days in 30 yrs
- 15 days/yr
Wind risk 2/10 · Minimal
- Chance of severe wind over 30 yrs
- —
Air-quality risk 4/10 · Minor
- Unhealthy air days now
- 5 days/yr
- Unhealthy air days in 30 yrs
- 6 days/yr
Risk factors via First Street. Map © Google.
Why this score? — see what drove the C- grade
The composite is a weighted blend of 9 inputs, each scored 0–100. Each bar is that input's sub-score; the figure is the points it added to the 100-point composite (weight × sub-score).
- Cash flow +17.3/30.0
- ARV discount +15.0/15.0
- DSCR +5.4/10.0
- 1% rule +4.2/10.0
- Rent growth +3.6/5.0
- Livability +3.6/5.0
- Schools +2.7/10.0
- Condition / age +2.5/5.0
- Appreciation +0.0/10.0
$239,410
🖨 Deal sheet 📄 Offer letter ✓ Due diligence
Listing remarks MLS
Tri-Level home with 3 bedrooms 1 baths with 2 car garage.
Key facts
- 0.27 acre lot
- 2 garage spots
- Built 2006
Neighborhood map
What this means for you Summary
Snapshot
- This is a 3-bed/2.5-bath single-family listed at $239k.
Deal economics
- At list price, monthly cash flow is $175 ($2k/yr) — positive.
- The deal already cash-flows at list — no discount required.
- To meet the 1% rule (rent ≥ 1% of price), the offer needs to be $220k (8.1% below list).
- Recommended offer: $218k (9.0% below list) — sets the bar for market timing.
- Cap rate 7.2% vs local median 4.0% in Portage — top-decile yield for the area; either an underpriced asset or a hidden risk that comps aren't pricing in. Stress-test before assuming the spread holds.
Location & tenants
- Location reads 72/100 on livability (#111 in IN) — a middle-class / working-renter tenant base. Strengths: cost of living A+, housing A+, health & safety A; Watch: schools D, amenities F, commute F.
- Portage Township Schools (suburban): math 26% / reading 36% proficiency, ranked #221 of 301 in IN (top 73%) — families likely to look elsewhere, expect single-tenant / working-renter base with shorter leases.
- Market conditions: Rents rising fast (+4.3%/yr); 311 active listings in the ZIP; 5 comparable units currently listed for rent nearby; rentals leasing fast (median 4d on market — plan ~1-2 weeks tenant-placement turnaround); 40% of comp listings sitting > 30 days — soft ceiling on asking rent; solid renter incomes; 542 units permitted in Porter County in 2024 (0 in 5+ unit buildings).
- This rent runs 35% of the median local income ($76k/yr) — at the standard rent-burdened threshold; future hikes will face affordability resistance.
Forward outlook
- Local home prices are declining (-3.0%/yr); year-one equity from $2k of loan paydown is wiped out by about $7k of value loss. Plan a longer hold.
- Porter County population projected at +6% by 2050 — modest demand growth; plan on rents tracking national, not racing it.
Negotiation context
- It's been on market 119 days — a 9% lower offer ($218k) is reasonable based on typical stale-listing flexibility.
- 6 sale attempts since 17y ago with the ask held roughly flat each time — persistent listings suggest the price (not the market) is what's stuck; bring a comps-based counter.
Questions for the listing agent
- It's been on market 119 days. Have you received any prior offers? Is the seller open to a 9% concession, seller financing, or rate buy-down credit?
- Why hasn't it sold? Are there any deal-killer items the seller is aware of (foundation, flood, title, zoning, code violations)?
- Is there a deadline driving the sale (1031 exchange, divorce, estate, relocation)? That informs how much negotiation room exists.
- Schools are D-rated, which usually means shorter tenancies and higher turnover. Who's the typical renter profile here, and what's been the actual vacancy rate?
- What's the average days-on-market for RENTAL listings here right now (not sales)? A rising rental-DOM trend means longer vacancies and softer asking-rent achievability than the comps imply.
- What's the recent tenant-quality profile in this submarket — average credit score on applications, eviction rate, late-payment / NSF rate, and stable-employment percentage? A property-management company in the area should have these aggregated.
- How much new for-sale + rental construction is in the pipeline within 1–3 miles? Heavy new supply typically softens prices + rents 12–24 months out; constrained supply supports both.
Investment metrics
- 1% rule
- 0.92% ✗
- Cap rate
- 7.17%
- Cash-on-cash
- 3.13%
- DSCR
- 1.14
- GRM
- 9.1
CMA / ARV
- ARV (median comp)
- $325,044
- List price
- $239,410
- Delta
- -26.35%
- Verdict
- UNDERPRICED
- Comps
- 20 within 1.0 mi
Show comp detail 12 sales within ~0.75 mi
| Address | Dist | Beds/Ba | Sqft | Sold | Price | $/sf | Match |
|---|---|---|---|---|---|---|---|
| 2962 Edith St | 0.24mi | 3/2.0 | 1,608 (+3%) | 9mo | $310,000 | $193 | 74 |
| 6428 Amanda Dr | 0.21mi | 3/2.5 | 1,700 (+9%) | 2mo | $369,000 | $217 | 73 |
| 6458 Kristina Ave | 0.44mi | 3/2.0 | 1,582 (+1%) | 7mo | $284,999 | $180 | 69 |
| 6593 Timberwood Ave | 0.36mi | 3/2.0 | 1,680 (+8%) | 1mo | $340,000 | $202 | 67 |
| 6438 Satin Ave | 0.62mi | 3/2.0 | 1,464 (-6%) | 1mo | $297,000 | $203 | 58 |
| 2719 Charlotte St | 0.68mi | 3/1.5 | 1,578 (+1%) | 6mo | $277,500 | $176 | 58 |
| 3055 Ramblewood St | 0.34mi | 3/2.0 | 1,760 (+13%) | 8mo | $290,000 | $165 | 54 |
| 2819 Hamstrom Rd | 0.34mi | 3/2.0 | 1,362 (-13%) | 9mo | $245,000 | $180 | 53 |
| 6679 Joseph Ave | 0.74mi | 3/2.0 | 1,597 (+2%) | 9mo | $280,000 | $175 | 52 |
| 2708 Airport Rd | 0.42mi | 3/2.0 | 1,351 (-13%) | 6mo | $239,000 | $177 | 51 |
| 2738 Tecumseh St | 0.63mi | 4/1.5 (+1) | 1,456 (-7%) | 4mo | $230,000 | $158 | 48 |
| 6198 Robbins Rd | 0.67mi | 3/2.0 | 1,416 (-9%) | 9mo | $295,900 | $209 | 44 |
Match score weights: distance 35% · size 25% · config 20% · recency 20%. Top-matched comps best support the ARV.
Projected returns pro-forma
-3.0% appreciation · 4.29% rent growth · sell at horizon
- IRR
- -10.0%
- Equity multiple
- 0.63×
- Total profit
- $-24,793
- Equity at exit
- $35,697
- IRR
- 1.0%
- Equity multiple
- 1.07×
- Total profit
- $4,839
- Equity at exit
- $20,700
Cash invested: $67,035 (down + closing). Projections, not guarantees.
Landlord ↔ Tenant lean methodology
- Overall (STATE)
- 90 Strongly Landlord-Friendly
- State Indiana
- 90 Strongly Landlord-Friendly · R+11
- County
- — inherits STATE
- City
- — inherits STATE
ZIP-level market 46368
- Rents YoY
- 4.3%
- Active inventory
- 311
- Price-to-rent
- 9.1×
Monthly cashflow live
- Estimated rent
- $2,201 high interval (Pro) →
- Mortgage (P&I)
- −$1,255
- Tax from tax record
- −$208 /mo · $2,501/yr
- Insurance
- −$100
- HOA
- −$0
- Vacancy / Maint / Mgmt
- −$462
- Net cashflow
- $175
Break-even live
UW: 25.0% down · 7.5% · 30yr · 1.5% tax · 5.0% vac · 8.0% maint · 8.0% mgmt
Financing live
Cash to close
- Down payment
- $59,852
- Closing costs
- $7,182
- Reserves months
- —
- Total cash needed
- —
Loan-product check · same deal, 3 products live
Conventional
25% down · 7.5% · 30yr
- Down + closing
- —
- Monthly P&I
- —
- Monthly cashflow
- —
- DSCR
- —
- Eligible?
- —
Personal DTI + credit; lowest rate.
DSCR
20% down · 8.5% · 30yr
- Down + closing
- —
- Monthly P&I
- —
- Monthly cashflow
- —
- DSCR
- —
- Eligible?
- —
No personal income docs; deal must DSCR.
Hard money
10% down · 12.0% · 12mo
- Down + closing
- —
- Monthly P&I
- —
- Monthly cashflow
- —
- DSCR
- —
- Eligible?
- —
Short-term bridge; refi at stabilization.
Rent comps 5 comps
| Address | Beds | Baths | Sqft | Rent | $/sqft | DOM | Units | Dist |
|---|---|---|---|---|---|---|---|---|
| 6387 Amanda Dr Portage, IN | 4.0 | 3.0 | 2108 | $2,600 | $1.23 | 44d | 1 | 0.33mi |
| 2540 Promenade Way Portage, IN | 3.0 | 2.0 | 1558 | $2,488 | $1.60 | 4d | 1 | 0.81mi |
| 2540 Promenade Way Portage, IN | 2.0 | 2.0 | 1329 | $2,299 | $1.73 | 44d | 1 | 0.81mi |
| 3300 Portside Ct Portage, IN | 1.0–3.0 | 1.0–2.0 | 839 | $1,439 | $1.72 | 1d | 6 | 0.93mi |
| 3471 Sunnyside Dr Portage, IN | 1.0–2.0 | 1.0–2.0 | 1083 | $1,940 | $1.79 | 1d | 11 | 1.11mi |
Listing history 29 events
-
2026-06-18days on market $239,410 Active 119 DOM
-
2026-06-17days on market $239,410 Active 118 DOM
-
2026-06-16days on market $239,410 Active 117 DOM
-
2026-06-15days on market $239,410 Active 116 DOM
-
2026-06-13days on market $239,410 Active 114 DOM
-
2026-06-13days on market $239,410 Active 113 DOM
-
2026-06-09days on market $239,410 Active 110 DOM
-
2026-06-08days on market $239,410 Active 109 DOM
-
2026-06-07days on market $239,410 Active 108 DOM
-
2026-06-04days on market $239,410 Active 105 DOM
-
2026-06-03days on market $239,410 Active 104 DOM
-
2026-06-02days on market $239,410 Active 103 DOM
-
2026-06-01days on market $239,410 Active 102 DOM
-
2026-05-31days on market $239,410 Active 101 DOM
-
2026-04-11price $239,410 57-char remark
Show marketing remark (57 chars)
Tri-Level home with 3 bedrooms 1 baths with 2 car garage.
-
2026-04-09price $218,680 57-char remark
Show marketing remark (57 chars)
Tri-Level home with 3 bedrooms 1 baths with 2 car garage.
-
2026-02-19$235,720 Active 57-char remark
Show marketing remark (57 chars)
Tri-Level home with 3 bedrooms 1 baths with 2 car garage.
-
2025-08-29historical
-
2025-07-07historical
-
2025-07-07$274,900 Active
-
2025-03-27historical Active Under Contract
-
2025-01-28$279,000 Active
-
2025-01-26historical
-
2024-10-23price $279,000
-
2024-09-25$289,000 Active
-
2022-03-31soldstatus $250,000 Closed
-
2022-03-01status Pending
-
2022-02-25$220,000 Active
-
2009-02-02$164,900
ⓘ Source: listings_history table (triggers on properties + properties_extension) + one-shot
backfill from property_details.listing_events for pre-trigger history.
Tax reassessment forecast IN · Partial reset (capped growth)
- Current annual tax
- $2,501 · $208/mo
- Projected year-2 tax
- $2,501 · $208/mo
- Expected delta
- $0/yr ($0/mo · 0.0%)
ⓘ Screening estimate from a state-policy table — verify with the county assessor before closing.
Climate risk First Street
- Flood 1/10 Low FEMA zone X (unshaded) · 0% chance over 30 yrs
- Wildfire 2/10 Low
- Heat 3/10 Moderate 7 d/yr ≥101°F today · 15 d/yr by 30 yrs out
- Wind 2/10 Low
- Air quality 4/10 Moderate 5 unhealthy d/yr today · 6 by 30 yrs out
Nearby sold comps map
Loading sold comps map…
Walkable amenities ~0.75 mi
Loading nearby amenities…
Taxation est. · year 1
- Rental income
- $26,407
- − Mortgage interest
- −$13,411
- − Property taxes
- −$2,501
- − Insurance
- −$1,197
- − Repairs & maintenance
- −$2,113
- − Management
- −$2,113
- − Depreciation
- −$6,965
- Taxable loss
- −$1,892
- Est. tax savings @ 24.0%
- +$454
- After-tax cash flow
- $2,551/yr
For passive investors: Depreciation is non-cash, so a rental often shows a tax loss while cash-flowing — sheltering income. Rental losses are passive: they offset passive income freely, and up to $25,000/yr can offset ordinary (W-2) income if you actively participate and your MAGI is under $100k (phasing out to $0 by $150k); unused losses carry forward. On sale, claimed depreciation is recaptured at up to 25%, and gains may owe capital-gains tax (a 1031 exchange can defer both). Figures are a year-1 estimate at your 24.0% rate — not tax advice; consult a CPA.
Schools (NCES district)
- District
- Portage Township Schools
- NCES district ID
- 1809150
- Math proficiency
- 26% ▼ -15.00%
- Reading proficiency
- 36% ▼ -10.00%
- Median HH income
- $53,880
- Composite
- 27.37/100
- National rank
- #6978
- State rank
- #221 of 301 in IN
Livability — Portage
- Score
- 72/100
- State rank
- #111
- US rank
- #5725
Category grades
Schools grade is shown separately in the Schools card above.
Census & demographics
- Census place
- Portage, IN
- County
- Porter County · 151,647 people
- City population
- 40,301
- Metro
- Chicago-Naperville-Elgin, IL-IN-WI
- Population (ZIP)
- 40,301
- Household income
- $76,368
- Rent vs Own
- Severe rent burden
- 856.0
Population outlook (Porter County) Hauer SSP2
- Today (2025)
- 177,804 people
- By 2030
- 181,552 · +2.1%
- By 2040
- 185,830 · +4.5%
- By 2050
- 187,498 · +5.5%
- By 2075
- 189,585 · +6.6%
- By 2100
- 183,722 · +3.3%
Race, ethnicity, and origin ACS 2023
- Neighborhood character
- Predominantly White (67%)
- Race & ethnicity
- White 67% Hispanic / Latino 18% Two or more races 10% Black 10% Asian 1%
- Hispanic origin (detail)
- Mexican 13% Puerto Rican 4%
- Common ancestry
- Romanian 6% Slovak 2% Iranian 1%
- Foreign-born
- 3% · Canada
- Languages at home
- 92% English-only · Spanish 6%
Political lean MEDSL · Porter
- 2024 margin
- R (+10.5) · D 43.8% · R 54.3% · Other 1.8%
- 2008→2024 swing
- -17.7pp toward R · 2008: 7.2pp · 2024: -10.5pp
- All cycles
- 2024: R+10.5 2020: R+6.1 2016: R+6.8 2012: D+3.8 2008: D+7.2
Not yet ingested
- Civics
- —
Market trends
- HPI YoY
- ▼ -195.94%
- Current HPI
- 181.3254
- Rent YoY
- ▲ 4.29%
- Metro
- Chicago-Naperville-Elgin, IL-IN-WI
- State GDP YoY
- ▲ 2.90%
- F500 in state
- 18
Industry mix (Fortune 500 HQ in IN)
| Industry | F500 HQs | Revenue |
|---|---|---|
| Industrial Machinery | 2 | $37B |
|
||
| Healthcare | 1 | $177B |
|
||
| Pharmaceuticals | 1 | $45B |
|
||
| Metals / Steel | 1 | $18B |
|
||
| Agriculture | 1 | $17B |
|
||
| Packaging | 1 | $12B |
|
||
Price history
+45.2% since first listed15 events — show timeline
- 2026-04-11 Price Changed $239,410 NIRA MLS as Distributed by MLS Grid
- 2026-04-09 Price Changed $218,680 NIRA MLS as Distributed by MLS Grid
- 2026-02-19 Listed $235,720 NIRA MLS as Distributed by MLS Grid
- 2025-08-29 Listing Removed — NIRA MLS as Distributed by MLS Grid
- 2025-07-07 Listing Removed — NIRA MLS as Distributed by MLS Grid
- 2025-07-07 Listed $274,900 NIRA MLS as Distributed by MLS Grid
- 2025-03-27 Contingent — NIRA MLS as Distributed by MLS Grid
- 2025-01-28 Listed $279,000 NIRA MLS as Distributed by MLS Grid
- 2025-01-26 Listing Removed — NIRA MLS as Distributed by MLS Grid
- 2024-10-23 Price Changed $279,000 NIRA MLS as Distributed by MLS Grid
- 2024-09-25 Listed $289,000 NIRA MLS as Distributed by MLS Grid
- 2022-03-31 Sold (MLS) $250,000 NIRA MLS as Distributed by MLS Grid
- 2022-03-01 Pending — NIRA MLS as Distributed by MLS Grid
- 2022-02-25 Listed $220,000 NIRA MLS as Distributed by MLS Grid
- 2009-02-02 Listed $164,900 NIRA MLS as Distributed by MLS Grid
Property tax history
+1.5%/yrLatest (2024): $2,501 · -0.1% YoY. Source: county tax records.
Cash-flow waterfall
monthlySold comps — $/sqft
last 12 mo · ≤1 miLoading sold comps…