136 Scenic Hill Rd · Mayflower, AR
Flood risk 1/10 · Minimal
- FEMA flood zone
- X (unshaded)
- Chance of flooding over 30 yrs
- 0.0%
- Est. flood insurance / yr
- $507 – $1,088
Fire risk 5/10 · Moderate
- Est. fire insurance / yr
- $1,499 – $2,785
Heat risk 6/10 · Moderate
- Hot days now (above 111°F)
- 6 days/yr
- Hot days in 30 yrs
- 16 days/yr
Wind risk 3/10 · Minor
- Chance of severe wind over 30 yrs
- 7.0%
Air-quality risk 2/10 · Minimal
- Unhealthy air days now
- 0 days/yr
- Unhealthy air days in 30 yrs
- 1 days/yr
Risk factors via First Street. Map © Google.
Why this score? — see what drove the C grade
The composite is a weighted blend of 9 inputs, each scored 0–100. Each bar is that input's sub-score; the figure is the points it added to the 100-point composite (weight × sub-score).
- Cash flow +26.6/30.0
- DSCR +9.1/10.0
- ARV discount +7.5/15.0
- 1% rule +5.8/10.0
- Schools +2.8/10.0
- Livability +2.8/5.0
- Condition / age +2.5/5.0
- Rent growth +2.4/5.0
- Appreciation +0.0/10.0
$135,000
🖨 Deal sheet 📄 Offer letter ✓ Due diligence
Listing remarks
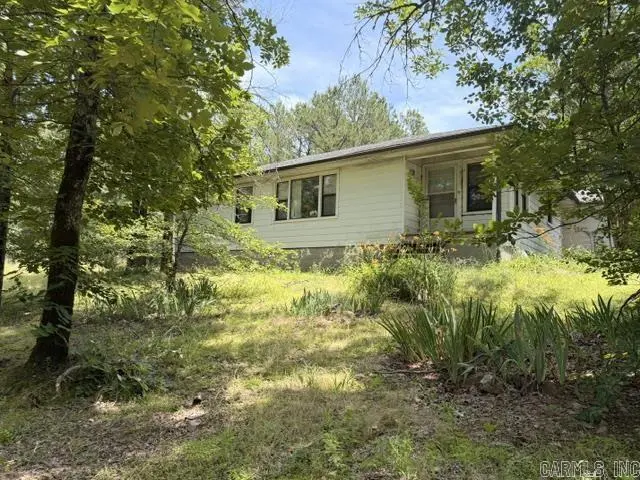
Completely Private, private drive that is gated, and secluded for country living close to the city on approx. 4.97 acres in Conway just needs a little TLC, Home is being sold "as is". Agents see agent remarks. Water is Mayflower, Natural gas pipes near & out by the water meter but house has no natural gas. square footage is approx. feel free to measure
Key facts
- 4.97 acre lot
- Listed 4 days
Property features AI
Finance
- Other: Approximately 4.97 acres
Exterior
- Utilities: Public water
- Home design: Exterior described as other (see remarks)
- Construction: Crawl space foundation; Composition roof
- Exterior features: Rural property setting; Sloped and level areas; Wooded and cleared portions; Not in a subdivision; Area amenities: None
Interior
- Kitchen: Electric range
- Flooring: Laminate
- Bathrooms: 2 full bathrooms
- Heating & cooling: Window units
- Interior features: Laminate flooring; Game room
Neighborhood map
What this means for you Summary
Snapshot
- This is a 3-bed/1.0-bath single-family listed at $135k.
Deal economics
- At list price, monthly cash flow is $360 ($4k/yr) — positive.
- The deal already cash-flows at list — no discount required.
- Meets the 1% rule at list price ($1k rent vs $135k).
- Cap rate 9.5% vs local median 4.8% in Mayflower — top-decile yield for the area; either an underpriced asset or a hidden risk that comps aren't pricing in. Stress-test before assuming the spread holds.
Location & tenants
- Location reads 56/100 on livability (#390 in AR) — a working-class tenant base; expect higher turnover. Strengths: cost of living A+, housing B+; Watch: schools F, crime F, amenities F.
- Mayflower School District (rural): math 32% / reading 34% proficiency, ranked #127 of 238 in AR (top 53%) — families likely to look elsewhere, expect single-tenant / working-renter base with shorter leases.
- Market conditions: Rents soft (-0.3%/yr); 262 active listings in the ZIP; 865 units permitted in Faulkner County in 2024 (451 in 5+ unit buildings).
Forward outlook
- Local home prices are declining (-3.0%/yr); year-one equity from $933 of loan paydown is wiped out by about $4k of value loss. Plan a longer hold.
- Faulkner County population projected at +32% by 2050 — long-run rental-demand tailwind backs the buy-and-hold thesis.
Negotiation context
- Only 4 days on market — expect competitive offers; lowballing is unlikely to land.
- Current owner paid $69k; list at $135k implies a 96% gain — meaningful room to come down on a strong offer.
Risks & watch-outs
- Climate carrying-cost: moderate wildfire risk; extreme-heat days projected 6→16/yr by 2055 (HVAC capex compounding) — expect insurance premiums to compound above CPI over the hold.
Questions for the listing agent
- Is there a deadline driving the sale (1031 exchange, divorce, estate, relocation)? That informs how much negotiation room exists.
- Schools are F-rated, which usually means shorter tenancies and higher turnover. Who's the typical renter profile here, and what's been the actual vacancy rate?
- Crime grade is F in this area — have there been break-ins, vandalism, or insurance claims at this property in the last 3 years? What carrier currently insures it and at what premium?
- What's the average days-on-market for RENTAL listings here right now (not sales)? A rising rental-DOM trend means longer vacancies and softer asking-rent achievability than the comps imply.
- What's the recent tenant-quality profile in this submarket — average credit score on applications, eviction rate, late-payment / NSF rate, and stable-employment percentage? A property-management company in the area should have these aggregated.
- How much new for-sale + rental construction is in the pipeline within 1–3 miles? Heavy new supply typically softens prices + rents 12–24 months out; constrained supply supports both.
Investment metrics
- 1% rule
- 1.08% ✓
- Cap rate
- 9.50%
- Cash-on-cash
- 11.44%
- DSCR
- 1.51
- GRM
- 7.7
CMA / ARV
No comps found within radius.
Projected returns pro-forma
-3.0% appreciation · 0.0% rent growth · sell at horizon
- IRR
- -2.4%
- Equity multiple
- 0.91×
- Total profit
- $-3,278
- Equity at exit
- $20,129
- IRR
- 4.1%
- Equity multiple
- 1.26×
- Total profit
- $9,878
- Equity at exit
- $11,672
Cash invested: $37,800 (down + closing). Projections, not guarantees.
Landlord ↔ Tenant lean methodology
- Overall (STATE)
- 92 Strongly Landlord-Friendly
- State Arkansas
- 92 Strongly Landlord-Friendly · R+14
- County
- — inherits STATE
- City
- — inherits STATE
ZIP-level market 72034
- Rents YoY
- -0.3%
- Active inventory
- 262
- Price-to-rent
- 7.7×
Monthly cashflow live
- Estimated rent
- $1,462 medium interval (Pro) →
- Mortgage (P&I)
- −$708
- Tax from tax record
- −$31 /mo · $366/yr
- Insurance
- −$56
- HOA
- −$0
- Vacancy / Maint / Mgmt
- −$307
- Net cashflow
- $360
Break-even live
UW: 25.0% down · 7.5% · 30yr · 1.5% tax · 5.0% vac · 8.0% maint · 8.0% mgmt
Financing live
Cash to close
- Down payment
- $33,750
- Closing costs
- $4,050
- Reserves months
- —
- Total cash needed
- —
Loan-product check · same deal, 3 products live
Conventional
25% down · 7.5% · 30yr
- Down + closing
- —
- Monthly P&I
- —
- Monthly cashflow
- —
- DSCR
- —
- Eligible?
- —
Personal DTI + credit; lowest rate.
DSCR
20% down · 8.5% · 30yr
- Down + closing
- —
- Monthly P&I
- —
- Monthly cashflow
- —
- DSCR
- —
- Eligible?
- —
No personal income docs; deal must DSCR.
Hard money
10% down · 12.0% · 12mo
- Down + closing
- —
- Monthly P&I
- —
- Monthly cashflow
- —
- DSCR
- —
- Eligible?
- —
Short-term bridge; refi at stabilization.
Listing history 5 events
-
2026-06-09status $135,000 Under Contract 4 DOM
-
2026-06-08days on market $135,000 New Listing 4 DOM
-
2026-06-07days on market $135,000 New Listing 3 DOM
-
2026-06-05remarks 356-char remark
-
2026-06-05$135,000 New Listing 1 DOM
ⓘ Source: listings_history table (triggers on properties + properties_extension) + one-shot
backfill from property_details.listing_events for pre-trigger history.
Tax reassessment forecast AR · Resets to sale price
- Current annual tax
- $366 · $31/mo
- Projected year-2 tax
- $864 · $72/mo
- Expected delta
- +$498/yr (+$41/mo · 136.0%)
ⓘ Screening estimate from a state-policy table — verify with the county assessor before closing.
Climate risk First Street
- Flood 1/10 Low FEMA zone X (unshaded) · 0% chance over 30 yrs
- Wildfire 5/10 Major
- Heat 6/10 Major 6 d/yr ≥111°F today · 16 d/yr by 30 yrs out
- Wind 3/10 Moderate 7% chance of damaging wind over 30 yrs
- Air quality 2/10 Low 0 unhealthy d/yr today · 1 by 30 yrs out
Nearby sold comps map
Loading sold comps map…
Walkable amenities ~0.75 mi
Loading nearby amenities…
Taxation est. · year 1
- Rental income
- $17,544
- − Mortgage interest
- −$7,562
- − Property taxes
- −$366
- − Insurance
- −$675
- − Repairs & maintenance
- −$1,404
- − Management
- −$1,404
- − Depreciation
- −$3,927
- Taxable income
- $2,206
- Est. tax owed @ 24.0%
- −$530
- After-tax cash flow
- $3,794/yr
For passive investors: Depreciation is non-cash, so a rental often shows a tax loss while cash-flowing — sheltering income. Rental losses are passive: they offset passive income freely, and up to $25,000/yr can offset ordinary (W-2) income if you actively participate and your MAGI is under $100k (phasing out to $0 by $150k); unused losses carry forward. On sale, claimed depreciation is recaptured at up to 25%, and gains may owe capital-gains tax (a 1031 exchange can defer both). Figures are a year-1 estimate at your 24.0% rate — not tax advice; consult a CPA.
Schools (NCES district)
- District
- Mayflower School District
- NCES district ID
- 0509540
- Math proficiency
- 32% ▼ -9.00%
- Reading proficiency
- 34% ▼ -6.00%
- Median HH income
- $47,119
- Composite
- 28.41/100
- National rank
- #6760
- State rank
- #127 of 238 in AR
Livability — Mayflower
- Score
- 56/100
- State rank
- #390
- US rank
- #22893
Category grades
Schools grade is shown separately in the Schools card above.
Census & demographics
- County
- Faulkner County · 103,634 people
- Metro
- Little Rock-North Little Rock-Conway, AR
- Population (ZIP)
- 50,285
- Household income
- $65,635
- Rent vs Own
- Severe rent burden
- 2282.0
Population outlook (Faulkner County) Hauer SSP2
- Today (2025)
- 138,985 people
- By 2030
- 148,264 · +6.7%
- By 2040
- 166,010 · +19.4%
- By 2050
- 183,362 · +31.9%
- By 2075
- 224,593 · +61.6%
- By 2100
- 250,603 · +80.3%
Race, ethnicity, and origin ACS 2023
- Neighborhood character
- Predominantly White (71%)
- Race & ethnicity
- White 71% Black 17% Hispanic / Latino 5% Two or more races 5% Asian 2%
- Hispanic origin (detail)
- Mexican 3%
- Common ancestry
- Slovak 2% Lithuanian 2% Italian 1%
- Foreign-born
- 4% · Canada, South Korea
- Languages at home
- 94% English-only · Spanish 3% Korean 1%
Political lean MEDSL · Faulkner
- 2024 margin
- Solid R (+32.3) · D 32.6% · R 64.9% · Other 2.5%
- 2008→2024 swing
- -7.1pp toward R · 2008: -25.3pp · 2024: -32.3pp
- All cycles
- 2024: R+32.3 2020: R+29.5 2016: R+31.6 2012: R+31.7 2008: R+25.3
Not yet ingested
- Civics
- —
Market trends
- HPI YoY
- ▼ -122.99%
- Current HPI
- 225.7805
- Rent YoY
- ▼ -0.28%
- Metro
- Little Rock-North Little Rock-Conway, AR
- State GDP YoY
- ▲ 3.80%
- F500 in state
- 10
Industry mix (Fortune 500 HQ in AR)
| Industry | F500 HQs | Revenue |
|---|---|---|
| Retail | 1 | $681B |
|
||
| Food / Agriculture | 1 | $53B |
|
||
| Retail / Energy | 1 | $22B |
|
||
| Transportation / Logistics | 1 | $12B |
|
||
| Energy | 1 | $4B |
|
||
Price history
+95.7% since first listed2 events — show timeline
- 2026-06-04 Listed $135,000 CARMLS
- 2001-05-15 Sold (Public Records) $69,000 Public Records
Property tax history
-0.8%/yrLatest (2025): $366 · -13.9% YoY. Source: county tax records.
Cash-flow waterfall
monthlySold comps — $/sqft
last 12 mo · ≤1 miLoading sold comps…