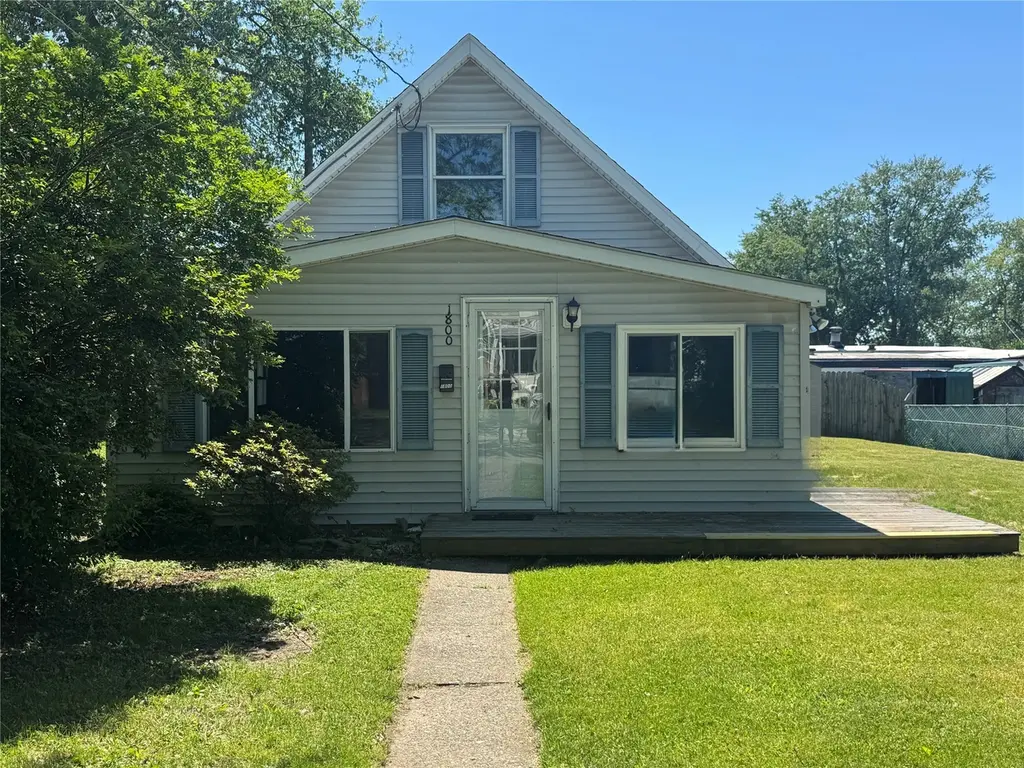
1800 Center St · Wesleyville, PA
Flood risk 1/10 · Minimal
- FEMA flood zone
- X (unshaded)
- Chance of flooding over 30 yrs
- 0.0%
- Est. flood insurance / yr
- $507 – $1,088
Fire risk 1/10 · Minimal
- Est. fire insurance / yr
- $511 – $949
Heat risk 3/10 · Minor
- Hot days now (above 89°F)
- 7 days/yr
- Hot days in 30 yrs
- 17 days/yr
Wind risk 1/10 · Minimal
- Chance of severe wind over 30 yrs
- —
Air-quality risk 4/10 · Minor
- Unhealthy air days now
- 3 days/yr
- Unhealthy air days in 30 yrs
- 7 days/yr
Risk factors via First Street. Map © Google.
Why this score? — see what drove the C+ grade
The composite is a weighted blend of 9 inputs, each scored 0–100. Each bar is that input's sub-score; the figure is the points it added to the 100-point composite (weight × sub-score).
- Cash flow +22.0/30.0
- ARV discount +15.0/15.0
- DSCR +7.0/10.0
- 1% rule +6.2/10.0
- Schools +4.0/10.0
- Livability +4.0/5.0
- Rent growth +2.5/5.0
- Condition / age +2.5/5.0
- Appreciation +0.0/10.0
$97,500
🖨 Deal sheet 📄 Offer letter ✓ Due diligence
Listing remarks
Perfect home for a first time homebuyer or small family. Previously used as a successful rental for many years. New carpet throughout. Within close proximity to schools, shopping and bayfront connector.
Key facts
- 5,998 sq ft lot
- Built 1936
- Listed 3 days
Tags
Property features AI
Exterior
- Utilities: Public water; Public sewer
- Home design: Single-family residence; One and one-half stories; Frame construction
- Construction: Built with frame construction; Composition roof
- Exterior features: Patio; Storage shed(s); Level lot
Interior
- Kitchen: Gas oven; Gas range; Refrigerator
- Flooring: Carpet; Laminate
- Bathrooms: One full bathroom
- Heating & cooling: Forced air heating
- Interior features: Gas oven, gas range, and refrigerator; Washer and dryer included; Eight total rooms; No basement
- Laundry & utility: Washer; Dryer
Neighborhood map
What this means for you Summary
Snapshot
- This is a 3-bed/1.0-bath single-family listed at $98k.
Deal economics
- At list price, monthly cash flow is $155 ($2k/yr) — positive.
- The deal already cash-flows at list — no discount required.
- Meets the 1% rule at list price ($1k rent vs $98k).
Location & tenants
- Location reads 80/100 on livability (#195 in PA, #1,671 nationally) — a professional / high-income tenant draw. Strengths: commute A+, cost of living A+, health & safety A+; Watch: schools D+, crime D+, employment D.
- Iroquois SD (suburban): math 39% / reading 55% proficiency, ranked #236 of 539 in PA (top 44%) — families likely to look elsewhere, expect single-tenant / working-renter base with shorter leases.
- Market conditions: 76 active listings in the ZIP; 3 comparable units currently listed for rent nearby; rentals lingering (median 44d on market — plan ~5-8 weeks vacancy on turnover, expect pricing pressure); 100% of comp listings sitting > 30 days — soft ceiling on asking rent; 364 units permitted in Erie County in 2024 (188 in 5+ unit buildings).
Forward outlook
- Local home prices are declining (-3.0%/yr); year-one equity from $674 of loan paydown is wiped out by about $3k of value loss. Plan a longer hold.
- Erie County population projected at -14% by 2050 — secular population decline; favor cash flow + early exit over multi-decade hold.
Negotiation context
- Only 3 days on market — expect competitive offers; lowballing is unlikely to land.
- Current owner paid $54k; list at $98k implies a 79% gain — meaningful room to come down on a strong offer.
Risks & watch-outs
- Watch-outs: built in 1936 — expect roof / HVAC / electrical / plumbing capex.
Questions for the listing agent
- Built in 1936 — when were the roof, HVAC, electrical panel, plumbing, and water heater last replaced?
- Is there a deadline driving the sale (1031 exchange, divorce, estate, relocation)? That informs how much negotiation room exists.
- Schools are D-rated, which usually means shorter tenancies and higher turnover. Who's the typical renter profile here, and what's been the actual vacancy rate?
- Crime grade is D in this area — have there been break-ins, vandalism, or insurance claims at this property in the last 3 years? What carrier currently insures it and at what premium?
- What's the average days-on-market for RENTAL listings here right now (not sales)? A rising rental-DOM trend means longer vacancies and softer asking-rent achievability than the comps imply.
- What's the recent tenant-quality profile in this submarket — average credit score on applications, eviction rate, late-payment / NSF rate, and stable-employment percentage? A property-management company in the area should have these aggregated.
- How much new for-sale + rental construction is in the pipeline within 1–3 miles? Heavy new supply typically softens prices + rents 12–24 months out; constrained supply supports both.
Investment metrics
- 1% rule
- 1.12% ✓
- Cap rate
- 8.20%
- Cash-on-cash
- 6.81%
- DSCR
- 1.30
- GRM
- 7.5
CMA / ARV
- ARV (on-the-fly)
- $122,484
- Comps found
- 12
Show comp detail 12 sales within ~0.75 mi
| Address | Dist | Beds/Ba | Sqft | Sold | Price | $/sf | Match |
|---|---|---|---|---|---|---|---|
| 3622 Main St | 0.54mi | 3/1.0 | 1,030 (-1%) | 6mo | $131,000 | $127 | 69 |
| 1909 Market St | 0.10mi | 3/1.5 | 1,160 (+12%) | 6mo | $123,000 | $106 | 69 |
| 1837 Kay Gie Way | 0.29mi | 3/1.0 | 924 (-11%) | 5mo | $10,200 | $11 | 64 |
| 1203 Priestley Ave | 0.39mi | 3/1.0 | 1,142 (+10%) | 4mo | $92,000 | $81 | 62 |
| 2635 Linwood Ave | 0.53mi | 3/1.0 | 967 (-7%) | 8mo | $150,000 | $155 | 57 |
| 2614 Fairmount Pkwy | 0.50mi | 4/1.0 (+1) | 1,125 (+8%) | 3mo | $110,000 | $98 | 56 |
| 4139 Bell St | 0.44mi | 3/1.0 | 1,152 (+11%) | 6mo | $96,000 | $83 | 56 |
| 2770 E 28th St | 0.70mi | 3/1.0 | 960 (-8%) | 5mo | $159,900 | $167 | 50 |
| 1063 Priestley Ave | 0.44mi | 3/1.0 | 1,186 (+14%) | 7mo | $140,000 | $118 | 50 |
| 2518 E 26th St | 0.71mi | 3/1.0 | 936 (-10%) | 2mo | $114,500 | $122 | 49 |
| 3705 Main St | 0.52mi | 3/1.0 | 1,186 (+14%) | 8mo | $114,000 | $96 | 46 |
| 2421 Wagner Ave | 0.68mi | 3/1.5 | 1,186 (+14%) | 4mo | $174,900 | $147 | 38 |
Match score weights: distance 35% · size 25% · config 20% · recency 20%. Top-matched comps best support the ARV.
Projected returns pro-forma
-3.0% appreciation · 3.0% rent growth · sell at horizon
- IRR
- -5.8%
- Equity multiple
- 0.78×
- Total profit
- $-5,899
- Equity at exit
- $14,538
- IRR
- 3.9%
- Equity multiple
- 1.28×
- Total profit
- $7,709
- Equity at exit
- $8,430
Cash invested: $27,300 (down + closing). Projections, not guarantees.
Landlord ↔ Tenant lean methodology
- Overall (STATE)
- 62 Landlord-Friendly
- State Pennsylvania
- 62 Landlord-Friendly · EVEN
- County
- — inherits STATE
- City
- — inherits STATE
ZIP-level market 16510
- Home prices YoY
- -33.7%
- Active inventory
- 76
- Price-to-rent
- 7.5×
Monthly cashflow live
- Estimated rent
- $1,088 medium interval (Pro) →
- Mortgage (P&I)
- −$511
- Tax from tax record
- −$153 /mo · $1,834/yr
- Insurance
- −$41
- HOA
- −$0
- Vacancy / Maint / Mgmt
- −$229
- Net cashflow
- $155
Break-even live
UW: 25.0% down · 7.5% · 30yr · 1.5% tax · 5.0% vac · 8.0% maint · 8.0% mgmt
Financing live
Cash to close
- Down payment
- $24,375
- Closing costs
- $2,925
- Reserves months
- —
- Total cash needed
- —
Loan-product check · same deal, 3 products live
Conventional
25% down · 7.5% · 30yr
- Down + closing
- —
- Monthly P&I
- —
- Monthly cashflow
- —
- DSCR
- —
- Eligible?
- —
Personal DTI + credit; lowest rate.
DSCR
20% down · 8.5% · 30yr
- Down + closing
- —
- Monthly P&I
- —
- Monthly cashflow
- —
- DSCR
- —
- Eligible?
- —
No personal income docs; deal must DSCR.
Hard money
10% down · 12.0% · 12mo
- Down + closing
- —
- Monthly P&I
- —
- Monthly cashflow
- —
- DSCR
- —
- Eligible?
- —
Short-term bridge; refi at stabilization.
Rent comps 3 comps
| Address | Beds | Baths | Sqft | Rent | $/sqft | DOM | Units | Dist |
|---|---|---|---|---|---|---|---|---|
| 1205 Priestley Ave Erie, PA | 3.0 | 1.0 | 1000 | $950 | $0.95 | 43d | 1 | 0.40mi |
| 4400 E Lake Rd Erie, PA | 2.0 | 1.0 | 825 | $1,702 | $2.06 | 43d | 9 | 1.38mi |
| 2526 E 39th St Erie, PA | 3.0 | 1.0 | 1120 | $1,050 | $0.94 | 43d | 1 | 1.47mi |
Listing history 3 events
-
2026-06-07statusdays on market $97,500 Pending 3 DOM
-
2026-06-03remarks 202-char remark
-
2026-06-03$97,500 Active 1 DOM
ⓘ Source: listings_history table (triggers on properties + properties_extension) + one-shot
backfill from property_details.listing_events for pre-trigger history.
Tax reassessment forecast PA · Partial reset (capped growth)
- Current annual tax
- $1,834 · $153/mo
- Projected year-2 tax
- $1,834 · $153/mo
- Expected delta
- $0/yr ($0/mo · 0.0%)
ⓘ Screening estimate from a state-policy table — verify with the county assessor before closing.
Climate risk First Street
- Flood 1/10 Low FEMA zone X (unshaded) · 0% chance over 30 yrs
- Wildfire 1/10 Low
- Heat 3/10 Moderate 7 d/yr ≥89°F today · 17 d/yr by 30 yrs out
- Wind 1/10 Low
- Air quality 4/10 Moderate 3 unhealthy d/yr today · 7 by 30 yrs out
Nearby sold comps map
Loading sold comps map…
Walkable amenities ~0.75 mi
Loading nearby amenities…
Taxation est. · year 1
- Rental income
- $13,057
- − Mortgage interest
- −$5,462
- − Property taxes
- −$1,834
- − Insurance
- −$488
- − Repairs & maintenance
- −$1,045
- − Management
- −$1,045
- − Depreciation
- −$2,836
- Taxable income
- $349
- Est. tax owed @ 24.0%
- −$84
- After-tax cash flow
- $1,775/yr
For passive investors: Depreciation is non-cash, so a rental often shows a tax loss while cash-flowing — sheltering income. Rental losses are passive: they offset passive income freely, and up to $25,000/yr can offset ordinary (W-2) income if you actively participate and your MAGI is under $100k (phasing out to $0 by $150k); unused losses carry forward. On sale, claimed depreciation is recaptured at up to 25%, and gains may owe capital-gains tax (a 1031 exchange can defer both). Figures are a year-1 estimate at your 24.0% rate — not tax advice; consult a CPA.
Schools (NCES district)
- District
- Iroquois SD
- NCES district ID
- 4212210
- Math proficiency
- 39% ▼ -13.00%
- Reading proficiency
- 55% ▼ -12.00%
- Median HH income
- $50,338
- Composite
- 40.27/100
- National rank
- #3766
- State rank
- #236 of 539 in PA
Livability — Wesleyville
- Score
- 80/100
- State rank
- #195
- US rank
- #1671
Category grades
Schools grade is shown separately in the Schools card above.
Census & demographics
- Census place
- Wesleyville, PA
- Population (ZIP)
- 25,152
Population outlook (Erie County) Hauer SSP2
- Today (2025)
- 272,159 people
- By 2030
- 266,299 · -2.2%
- By 2040
- 250,987 · -7.8%
- By 2050
- 234,925 · -13.7%
- By 2075
- 199,164 · -26.8%
- By 2100
- 162,985 · -40.1%
Race, ethnicity, and origin ACS 2023
- Neighborhood character
- Predominantly White (80%)
- Race & ethnicity
- White 80% Hispanic / Latino 6% Black 6% Asian 4% Two or more races 4%
- Hispanic origin (detail)
- Mexican 1% Puerto Rican 4%
- Common ancestry
- Romanian 12% Subsaharan African 2% Lithuanian 2%
- Foreign-born
- 8% · Vietnam, India, Canada
- Languages at home
- 88% English-only · Arabic 3% Spanish 3% Other Indo-European 2%
Political lean MEDSL · Erie
- 2024 margin
- Toss-up / Even · D 49.0% · R 50.0%
- 2008→2024 swing
- -20.9pp toward R · 2008: 19.9pp · 2024: -1.0pp
- All cycles
- 2024: R+1.0 2020: D+1.0 2016: R+2.0 2012: D+16.9 2008: D+19.9
Not yet ingested
- Civics
- —
Market trends
- HPI YoY
- ▼ -122.36%
- Current HPI
- 240.7222
- Rent YoY
- —
- Metro
- —
- State GDP YoY
- ▲ 1.68%
- F500 in state
- 34
Industry mix (Fortune 500 HQ in PA)
| Industry | F500 HQs | Revenue |
|---|---|---|
| Healthcare | 2 | $309B |
|
||
| Insurance | 2 | $27B |
|
||
| Telecommunications / Media | 1 | $124B |
|
||
| Industrial Distribution | 1 | $22B |
|
||
| Financial Services | 1 | $20B |
|
||
| Chemicals / Materials | 1 | $18B |
|
||
Price history
+545.7% since first listed3 events — show timeline
- 2026-06-02 Listed $97,500 GEBOR
- 2003-09-02 Sold (Public Records) $54,500 Public Records
- 1990-04-24 Sold (Public Records) $15,100 Public Records
Property tax history
+1.0%/yrLatest (2026): $1,834 · -21.6% YoY. Source: county tax records.
Cash-flow waterfall
monthlySold comps — $/sqft
last 12 mo · ≤1 miLoading sold comps…