2610 Pinoak St · Oak Trail Shores, TX
Flood risk 1/10 · Minimal
- FEMA flood zone
- X (unshaded)
- Chance of flooding over 30 yrs
- 0.0%
- Est. flood insurance / yr
- $507 – $1,088
Fire risk 5/10 · Moderate
- Est. fire insurance / yr
- $1,222 – $2,270
Heat risk 7/10 · Major
- Hot days now (above 108°F)
- 6 days/yr
- Hot days in 30 yrs
- 19 days/yr
Wind risk 4/10 · Minor
- Chance of severe wind over 30 yrs
- 24.0%
Air-quality risk 2/10 · Minimal
- Unhealthy air days now
- 1 days/yr
- Unhealthy air days in 30 yrs
- 2 days/yr
Risk factors via First Street. Map © Google.
Why this score? — see what drove the B+ grade
The composite is a weighted blend of 9 inputs, each scored 0–100. Each bar is that input's sub-score; the figure is the points it added to the 100-point composite (weight × sub-score).
- Cash flow +30.0/30.0
- ARV discount +15.0/15.0
- DSCR +10.0/10.0
- 1% rule +8.3/10.0
- Schools +4.0/10.0
- Livability +2.9/5.0
- Rent growth +2.8/5.0
- Condition / age +2.5/5.0
- Appreciation +0.0/10.0
$144,900
🖨 Deal sheet 📄 Offer letter ✓ Due diligence
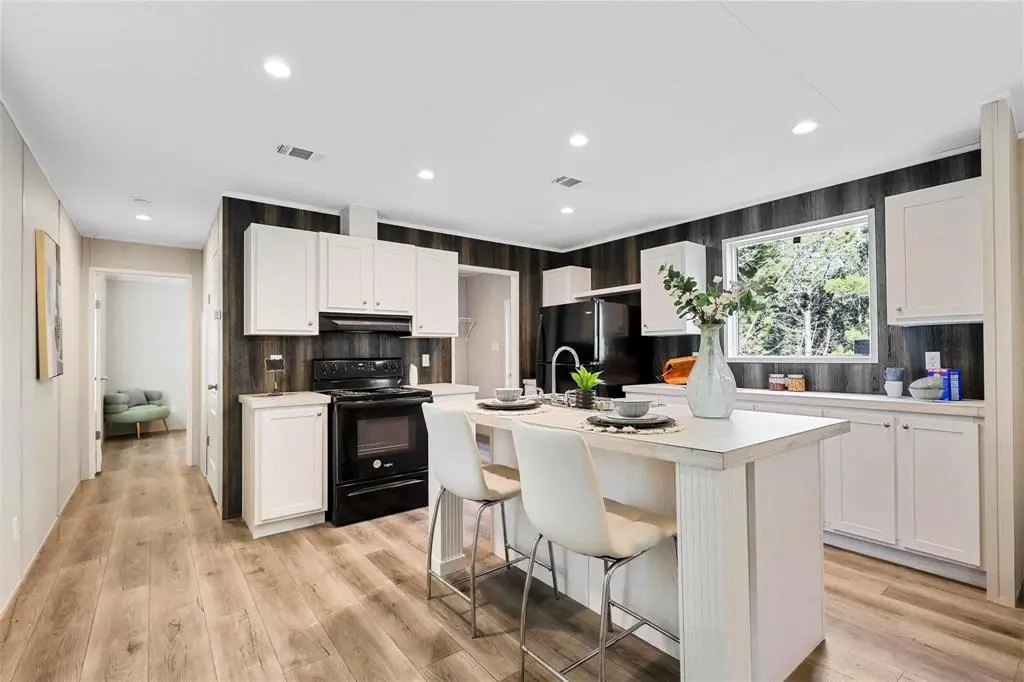
Listing remarks MLS
Enjoy Granbury lake life in this new home, located less than a mile from the community boat ramp. The home features a spacious, open floor plan, double vanities in the primary bath, tub-shower combos in both bathrooms, and generously sized closets. Property improvements include a brand-new septic system, new skirting, new kitchen appliances, new flooring, new HVAC, new roof, and brand-new cedar shutters. All major components have been recently installed for worry-free living. This home qualifies for all loan types.
Key facts
- Community boat ramp
- Double vanities
- Tub-shower combos
Tags
Neighborhood map
What this means for you Summary
Snapshot
- This is a 3-bed/2.0-bath manufactured listed at $145k.
Deal economics
- At list price, monthly cash flow is $558 ($7k/yr) — positive.
- The deal already cash-flows at list — no discount required.
- Meets the 1% rule at list price ($2k rent vs $145k).
- Recommended offer: $128k (12.0% below list) — sets the bar for market timing.
- Cap rate 10.9% vs local median 5.9% in Oak Trail Shores — top-decile yield for the area; either an underpriced asset or a hidden risk that comps aren't pricing in. Stress-test before assuming the spread holds.
Location & tenants
- Location reads 58/100 on livability (#1,187 in TX) — a working-class tenant base; expect higher turnover. Strengths: cost of living A+, housing A+, crime B+; Watch: health & safety D+, schools F, amenities F.
- Granbury ISD (town): math 46% / reading 46% proficiency, ranked #237 of 826 in TX (top 29%) — families likely to look elsewhere, expect single-tenant / working-renter base with shorter leases.
- Market conditions: Rents rising (+1.1%/yr); 929 active listings in the ZIP; 2 comparable units currently listed for rent nearby; 125 units permitted in Hood County in 2024 (0 in 5+ unit buildings).
- This rent runs 33% of the median local income ($70k/yr) — at the standard rent-burdened threshold; future hikes will face affordability resistance.
Forward outlook
- Local home prices are declining (-3.0%/yr); year-one equity from $1k of loan paydown is wiped out by about $4k of value loss. Plan a longer hold.
- Hood County population projected at +29% by 2050 — long-run rental-demand tailwind backs the buy-and-hold thesis.
- At projected returns (-3.0% appreciation + 1.1% rent growth), your $41k cash investment doubles in ~9 years — after that, you're playing with house money.
Negotiation context
- It's been on market 162 days — a 12% lower offer ($128k) is reasonable based on typical stale-listing flexibility.
- 4 sale attempts since 2y ago; this cycle's ask has dropped $15k (9%) from the opening price — seller is motivated, your offer sets the floor, not the list.
Risks & watch-outs
- Climate carrying-cost: moderate wildfire risk; extreme-heat days projected 6→19/yr by 2055 (HVAC capex compounding) — expect insurance premiums to compound above CPI over the hold.
Questions for the listing agent
- It's been on market 162 days. Have you received any prior offers? Is the seller open to a 12% concession, seller financing, or rate buy-down credit?
- What does the HOA fee cover, when was the last increase, and are there any pending special assessments or reserve-fund shortfalls?
- Why hasn't it sold? Are there any deal-killer items the seller is aware of (foundation, flood, title, zoning, code violations)?
- Is there a deadline driving the sale (1031 exchange, divorce, estate, relocation)? That informs how much negotiation room exists.
- Schools are F-rated, which usually means shorter tenancies and higher turnover. Who's the typical renter profile here, and what's been the actual vacancy rate?
- What's the average days-on-market for RENTAL listings here right now (not sales)? A rising rental-DOM trend means longer vacancies and softer asking-rent achievability than the comps imply.
- What's the recent tenant-quality profile in this submarket — average credit score on applications, eviction rate, late-payment / NSF rate, and stable-employment percentage? A property-management company in the area should have these aggregated.
- How much new for-sale + rental construction is in the pipeline within 1–3 miles? Heavy new supply typically softens prices + rents 12–24 months out; constrained supply supports both.
Investment metrics
- 1% rule
- 1.33% ✓
- Cap rate
- 10.92%
- Cash-on-cash
- 16.52%
- DSCR
- 1.73
- GRM
- 6.3
CMA / ARV
- ARV (median comp)
- $179,722
- List price
- $144,900
- Delta
- -19.38%
- Verdict
- UNDERPRICED
- Comps
- 20 within 1.0 mi
Show comp detail 9 sales within ~0.75 mi
| Address | Dist | Beds/Ba | Sqft | Sold | Price | $/sf | Match |
|---|---|---|---|---|---|---|---|
| 2723 Cypress St | 0.20mi | 3/2.0 | 1,216 (0%) | 2mo | $147,500 | $121 | 89 |
| 3806 Oak Meadow St | 0.14mi | 3/2.0 | 1,264 (+4%) | 11mo | $150,000 | $119 | 78 |
| 3622 Brook Valley St | 0.21mi | 3/2.0 | 1,140 (-6%) | 6mo | $137,500 | $121 | 75 |
| 2614 Sycamore Ct | 0.14mi | 3/2.0 | 1,344 (+10%) | 4mo | $175,000 | $130 | 73 |
| 2548 Rockcliff Ct | 0.49mi | 3/2.0 | 1,120 (-8%) | 13mo | $130,000 | $116 | 53 |
| 2703 Rockcliff Ct | 0.50mi | 3/2.0 | 1,368 (+12%) | 14mo | $120,000 | $88 | 44 |
| 3609 Greenbrook St | 0.33mi | 2/1.0 (-1) | 1,036 (-15%) | 9mo | $75,000 | $72 | 43 |
| 2654 Edgecliff Ct | 0.63mi | 3/2.0 | 1,344 (+10%) | 12mo | $150,000 | $112 | 43 |
| 2657 Edgecliff Ct | 0.60mi | 2/2.0 (-1) | 1,064 (-12%) | 8mo | $120,000 | $113 | 40 |
Match score weights: distance 35% · size 25% · config 20% · recency 20%. Top-matched comps best support the ARV.
Projected returns pro-forma
-3.0% appreciation · 1.1% rent growth · sell at horizon
- IRR
- 5.5%
- Equity multiple
- 1.21×
- Total profit
- $8,483
- Equity at exit
- $21,605
- IRR
- 13.2%
- Equity multiple
- 1.96×
- Total profit
- $38,941
- Equity at exit
- $12,528
Cash invested: $40,572 (down + closing). Projections, not guarantees.
Landlord ↔ Tenant lean methodology
- Overall (STATE)
- 87 Strongly Landlord-Friendly
- State Texas
- 87 Strongly Landlord-Friendly · R+5
- County
- — inherits STATE
- City
- — inherits STATE
ZIP-level market 76048
- Home prices YoY
- -23.4%
- Rents YoY
- 1.1%
- Active inventory
- 929
- Price-to-rent
- 6.3×
Monthly cashflow live
- Estimated rent
- $1,926 medium interval (Pro) →
- Mortgage (P&I)
- −$760
- Tax from tax record
- −$136 /mo · $1,627/yr
- Insurance
- −$60
- HOA
- −$7
- Vacancy / Maint / Mgmt
- −$404
- Net cashflow
- $558
Break-even live
UW: 25.0% down · 7.5% · 30yr · 1.5% tax · 5.0% vac · 8.0% maint · 8.0% mgmt
Financing live
Cash to close
- Down payment
- $36,225
- Closing costs
- $4,347
- Reserves months
- —
- Total cash needed
- —
Loan-product check · same deal, 3 products live
Conventional
25% down · 7.5% · 30yr
- Down + closing
- —
- Monthly P&I
- —
- Monthly cashflow
- —
- DSCR
- —
- Eligible?
- —
Personal DTI + credit; lowest rate.
DSCR
20% down · 8.5% · 30yr
- Down + closing
- —
- Monthly P&I
- —
- Monthly cashflow
- —
- DSCR
- —
- Eligible?
- —
No personal income docs; deal must DSCR.
Hard money
10% down · 12.0% · 12mo
- Down + closing
- —
- Monthly P&I
- —
- Monthly cashflow
- —
- DSCR
- —
- Eligible?
- —
Short-term bridge; refi at stabilization.
Rent comps 2 comps
| Address | Beds | Baths | Sqft | Rent | $/sqft | DOM | Units | Dist |
|---|---|---|---|---|---|---|---|---|
| 4321 Terri Lee Ln Granbury, TX | 4.0 | 2.0 | 1387 | $2,075 | $1.50 | 1d | 1 | 1.03mi |
| 3225 Evergreen Dr Granbury, TX | 3.0 | 1.0 | 916 | $1,425 | $1.56 | 1d | 1 | 1.29mi |
HOA detail
- Monthly dues
- $7 · $84/yr
Listing history 41 events
-
2026-06-18days on market $144,900 Active 162 DOM
-
2026-06-17days on market $144,900 Active 161 DOM
-
2026-06-16days on market $144,900 Active 160 DOM
-
2026-06-15days on market $144,900 Active 159 DOM
-
2026-06-13days on market $144,900 Active 157 DOM
-
2026-06-09days on market $144,900 Active 153 DOM
-
2026-06-08days on market $144,900 Active 152 DOM
-
2026-06-07days on market $144,900 Active 151 DOM
-
2026-06-04days on market $144,900 Active 148 DOM
-
2026-06-03days on market $144,900 Active 147 DOM
-
2026-06-02days on market $144,900 Active 146 DOM
-
2026-06-02days on market $144,900 Active 145 DOM
-
2026-05-31days on market $144,900 Active 144 DOM
-
2026-05-05price $144,900 520-char remark
Show marketing remark (520 chars)
Enjoy Granbury lake life in this new home, located less than a mile from the community boat ramp. The home features a spacious, open floor plan, double vanities in the primary bath, tub-shower combos in both bathrooms, and generously sized closets. Property improvements include a brand-new septic system, new skirting, new kitchen appliances, new flooring, new HVAC, new roof, and brand-new cedar shutters. All major components have been recently installed for worry-free living. This home qualifies for all loan types.
-
2026-02-20price $149,900 520-char remark
Show marketing remark (520 chars)
Enjoy Granbury lake life in this new home, located less than a mile from the community boat ramp. The home features a spacious, open floor plan, double vanities in the primary bath, tub-shower combos in both bathrooms, and generously sized closets. Property improvements include a brand-new septic system, new skirting, new kitchen appliances, new flooring, new HVAC, new roof, and brand-new cedar shutters. All major components have been recently installed for worry-free living. This home qualifies for all loan types.
-
2025-12-31$159,900 Active 520-char remark
Show marketing remark (520 chars)
Enjoy Granbury lake life in this new home, located less than a mile from the community boat ramp. The home features a spacious, open floor plan, double vanities in the primary bath, tub-shower combos in both bathrooms, and generously sized closets. Property improvements include a brand-new septic system, new skirting, new kitchen appliances, new flooring, new HVAC, new roof, and brand-new cedar shutters. All major components have been recently installed for worry-free living. This home qualifies for all loan types.
-
2025-10-16historical
-
2025-06-02price $159,900
-
2025-04-16$164,900 Active
-
2025-04-11historical
-
2025-02-10price $168,600
-
2025-02-04price $168,700
-
2025-01-30price $168,800
-
2025-01-28price $168,900
-
2025-01-22price $169,000
-
2025-01-20price $169,100
-
2025-01-10price $169,200
-
2025-01-06price $169,300
-
2025-01-02price $169,400
-
2024-12-31price $169,500
-
2024-12-20price $169,600
-
2024-12-16price $169,700
-
2024-12-13price $169,800
-
2024-12-11price $169,900
-
2024-11-06$174,900 Active
-
2024-10-30historical
-
2024-08-29$169,000 Active
-
2023-12-21soldstatus
-
2010-05-05soldstatus
-
2010-03-10soldstatus
-
1974-03-11soldstatus
ⓘ Source: listings_history table (triggers on properties + properties_extension) + one-shot
backfill from property_details.listing_events for pre-trigger history.
Tax reassessment forecast TX · Resets to sale price
- Current annual tax
- $1,627 · $136/mo
- Projected year-2 tax
- $2,652 · $221/mo
- Expected delta
- +$1,025/yr (+$85/mo · 63.0%)
ⓘ Screening estimate from a state-policy table — verify with the county assessor before closing.
Climate risk First Street
- Flood 1/10 Low FEMA zone X (unshaded) · 0% chance over 30 yrs
- Wildfire 5/10 Major
- Heat 7/10 Severe 6 d/yr ≥108°F today · 19 d/yr by 30 yrs out
- Wind 4/10 Moderate 24% chance of damaging wind over 30 yrs
- Air quality 2/10 Low 1 unhealthy d/yr today · 2 by 30 yrs out
Nearby sold comps map
Loading sold comps map…
Walkable amenities ~0.75 mi
Loading nearby amenities…
Taxation est. · year 1
- Rental income
- $23,109
- − Mortgage interest
- −$8,117
- − Property taxes
- −$1,627
- − Insurance
- −$724
- − Repairs & maintenance
- −$1,849
- − Management
- −$1,849
- − HOA
- −$84
- − Depreciation
- −$4,215
- Taxable income
- $4,644
- Est. tax owed @ 24.0%
- −$1,115
- After-tax cash flow
- $5,587/yr
For passive investors: Depreciation is non-cash, so a rental often shows a tax loss while cash-flowing — sheltering income. Rental losses are passive: they offset passive income freely, and up to $25,000/yr can offset ordinary (W-2) income if you actively participate and your MAGI is under $100k (phasing out to $0 by $150k); unused losses carry forward. On sale, claimed depreciation is recaptured at up to 25%, and gains may owe capital-gains tax (a 1031 exchange can defer both). Figures are a year-1 estimate at your 24.0% rate — not tax advice; consult a CPA.
Schools (NCES district)
- District
- Granbury ISD
- NCES district ID
- 4821390
- Math proficiency
- 46% ▬ 0.00%
- Reading proficiency
- 46% ▲ 4.00%
- Median HH income
- $55,856
- Composite
- 40.04/100
- National rank
- #3820
- State rank
- #237 of 826 in TX
Livability — Oak Trail Shores
- Score
- 58/100
- State rank
- #1187
- US rank
- #20758
Category grades
Schools grade is shown separately in the Schools card above.
Census & demographics
- Census place
- Oak Trail Shores, TX
- County
- Hood County · 58,506 people
- Metro
- Granbury, TX
- Population (ZIP)
- 27,000
- Household income
- $70,346
- Rent vs Own
- Severe rent burden
- 612.0
Population outlook (Hood County) Hauer SSP2
- Today (2025)
- 63,502 people
- By 2030
- 67,459 · +6.2%
- By 2040
- 74,958 · +18.0%
- By 2050
- 81,922 · +29.0%
- By 2075
- 98,872 · +55.7%
- By 2100
- 107,796 · +69.8%
Race, ethnicity, and origin ACS 2023
- Neighborhood character
- Predominantly White (80%)
- Race & ethnicity
- White 80% Hispanic / Latino 14% Two or more races 11% Black 1%
- Hispanic origin (detail)
- Mexican 13%
- Common ancestry
- Italian 2% Slovak 2% Portuguese 1%
- Foreign-born
- 4% · Canada
- Languages at home
- 89% English-only · Spanish 10%
Political lean MEDSL · Hood
- 2024 margin
- Solid R (+66.0) · D 16.6% · R 82.6%
- 2008→2024 swing
- -11.9pp toward R · 2008: -54.0pp · 2024: -66.0pp
- All cycles
- 2024: R+66.0 2020: R+64.1 2016: R+66.5 2012: R+64.7 2008: R+54.0
Not yet ingested
- Civics
- —
Market trends
- HPI YoY
- ▼ -83.25%
- Current HPI
- 272.2126
- Rent YoY
- ▲ 1.10%
- Metro
- Granbury, TX
- State GDP YoY
- ▲ 3.95%
- F500 in state
- 110
Industry mix (Fortune 500 HQ in TX)
| Industry | F500 HQs | Revenue |
|---|---|---|
| Energy | 16 | $1,198B |
|
||
| Technology | 5 | $198B |
|
||
| Engineering / Construction | 4 | $72B |
|
||
| Energy Services | 3 | $60B |
|
||
| Utilities | 3 | $41B |
|
||
| Healthcare | 2 | $330B |
|
||
Price history
-14.3% since first listed28 events — show timeline
- 2026-05-05 Price Changed $144,900 NTREIS
- 2026-02-20 Price Changed $149,900 NTREIS
- 2025-12-31 Listed $159,900 NTREIS
- 2025-10-16 Listing Removed — NTREIS
- 2025-06-02 Price Changed $159,900 NTREIS
- 2025-04-16 Listed $164,900 NTREIS
- 2025-04-11 Listing Removed — NTREIS
- 2025-02-10 Price Changed $168,600 NTREIS
- 2025-02-04 Price Changed $168,700 NTREIS
- 2025-01-30 Price Changed $168,800 NTREIS
- 2025-01-28 Price Changed $168,900 NTREIS
- 2025-01-22 Price Changed $169,000 NTREIS
- 2025-01-20 Price Changed $169,100 NTREIS
- 2025-01-10 Price Changed $169,200 NTREIS
- 2025-01-06 Price Changed $169,300 NTREIS
- 2025-01-02 Price Changed $169,400 NTREIS
- 2024-12-31 Price Changed $169,500 NTREIS
- 2024-12-20 Price Changed $169,600 NTREIS
- 2024-12-16 Price Changed $169,700 NTREIS
- 2024-12-13 Price Changed $169,800 NTREIS
- 2024-12-11 Price Changed $169,900 NTREIS
- 2024-11-06 Listed $174,900 NTREIS
- 2024-10-30 Listing Removed — NTREIS
- 2024-08-29 Listed $169,000 NTREIS
- 2023-12-21 Sold (Public Records) — Public Records
- 2010-05-05 Sold (Public Records) — Public Records
- 2010-03-10 Sold (Public Records) — Public Records
- 1974-03-11 Sold (Public Records) — Public Records
Property tax history
+36.0%/yrLatest (2025): $1,627 · +1256.9% YoY. Source: county tax records.
Cash-flow waterfall
monthlySold comps — $/sqft
last 12 mo · ≤1 miLoading sold comps…