780 W 1125 N #65 · Cedar City, UT
Flood risk 6/10 · Moderate
- FEMA flood zone
- —
- Chance of flooding over 30 yrs
- 0.73%
- Est. flood insurance / yr
- —
Fire risk 5/10 · Moderate
- Est. fire insurance / yr
- $453 – $841
Heat risk 3/10 · Minor
- Hot days now (above 91°F)
- 7 days/yr
- Hot days in 30 yrs
- 22 days/yr
Wind risk 1/10 · Minimal
- Chance of severe wind over 30 yrs
- —
Air-quality risk 3/10 · Minor
- Unhealthy air days now
- 2 days/yr
- Unhealthy air days in 30 yrs
- 2 days/yr
Risk factors via First Street. Map © Google.
Why this score? — see what drove the C grade
The composite is a weighted blend of 9 inputs, each scored 0–100. Each bar is that input's sub-score; the figure is the points it added to the 100-point composite (weight × sub-score).
- Cash flow +23.5/30.0
- DSCR +7.6/10.0
- ARV discount +7.5/15.0
- 1% rule +6.1/10.0
- Rent growth +3.8/5.0
- Schools +3.5/10.0
- Livability +3.2/5.0
- Condition / age +2.5/5.0
- Appreciation +0.0/10.0
$154,000
🖨 Deal sheet 📄 Offer letter ✓ Due diligence
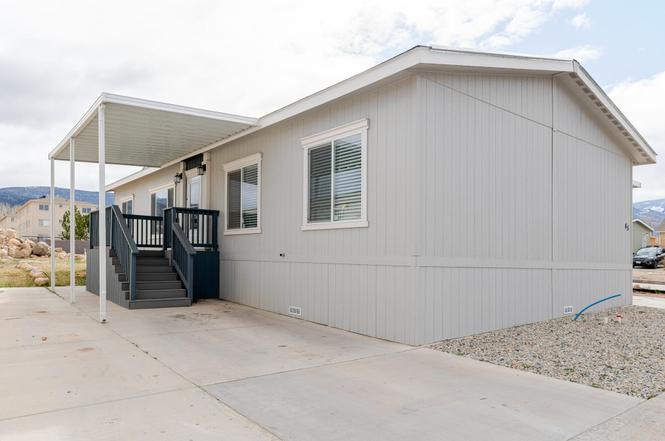
Listing remarks
This is a must see large 1479 sqft. 3-bedroom, 2-bath manufactured home. Home Features LED flat lights, all bedrooms are fan ready, forced air heating and cooling, walking closets and large master bedroom and bath. It's only 9 minutes to SUU and 7 minutes to downtown. Park rent is $545/month + $95/month for water, sewer, and trash. Simple, well-kept, and in a great spot--come take a look!
Key facts
- Fan ready
- Walking closets
- Forced air heating
Tags
Neighborhood map
What this means for you Summary
Snapshot
- This is a 3-bed/2.0-bath single-family listed at $154k.
Deal economics
- At list price, monthly cash flow is $288 ($3k/yr) — positive.
- The deal already cash-flows at list — no discount required.
- Meets the 1% rule at list price ($2k rent vs $154k).
- Recommended offer: $149k (3.0% below list) — sets the bar for market timing.
Location & tenants
- Location reads 64/100 on livability (#170 in UT) — a middle-class / working-renter tenant base. Strengths: cost of living A+, housing A+, crime A; Watch: employment D, amenities F, commute F.
- Iron District (town): math 40% / reading 44% proficiency, ranked #42 of 80 in UT (top 52%) — families likely to look elsewhere, expect single-tenant / working-renter base with shorter leases.
- Zoned schools: Cedar North School (math 46% / reading 41%, grade F, #260 of 585 statewide, top 46%, 636 students, 48% FRL); Canyon View Middle (math 32% / reading 46%, grade F, #79 of 138 statewide, top 58%, 989 students, 43% FRL); Canyon View High (math 27% / reading 42%, grade F, #95 of 171 statewide, top 61%, 1,123 students, 34% FRL) — zoned schools at 42% FRL track the district average.
- Market conditions: Rents rising fast (+5.0%/yr); 819 active listings in the ZIP; 655 units permitted in Iron County in 2024 (0 in 5+ unit buildings).
- This rent runs 31% of the median local income ($67k/yr) — at the standard rent-burdened threshold; future hikes will face affordability resistance.
Forward outlook
- Local home prices are declining (-3.0%/yr); year-one equity from $1k of loan paydown is wiped out by about $5k of value loss. Plan a longer hold.
- Iron County population projected at +14% by 2050 — modest demand growth; plan on rents tracking national, not racing it.
- At projected returns (-3.0% appreciation + 5.0% rent growth), your $43k cash investment doubles in ~10 years — after that, you're playing with house money.
Negotiation context
- It's been on market 48 days — a 3% lower offer ($149k) is reasonable based on typical stale-listing flexibility.
Risks & watch-outs
- Climate carrying-cost: major flood risk; moderate wildfire risk — expect insurance premiums to compound above CPI over the hold.
Questions for the listing agent
- It's been on market 48 days. Have you received any prior offers? Is the seller open to a 3% concession, seller financing, or rate buy-down credit?
- Is there a deadline driving the sale (1031 exchange, divorce, estate, relocation)? That informs how much negotiation room exists.
- What's the average days-on-market for RENTAL listings here right now (not sales)? A rising rental-DOM trend means longer vacancies and softer asking-rent achievability than the comps imply.
- What's the recent tenant-quality profile in this submarket — average credit score on applications, eviction rate, late-payment / NSF rate, and stable-employment percentage? A property-management company in the area should have these aggregated.
- How much new for-sale + rental construction is in the pipeline within 1–3 miles? Heavy new supply typically softens prices + rents 12–24 months out; constrained supply supports both.
Investment metrics
- 1% rule
- 1.11% ✓
- Cap rate
- 8.54%
- Cash-on-cash
- 8.02%
- DSCR
- 1.36
- GRM
- 7.5
CMA / ARV
No comps found within radius.
Projected returns pro-forma
-3.0% appreciation · 5.02% rent growth · sell at horizon
- IRR
- -1.8%
- Equity multiple
- 0.93×
- Total profit
- $-3,013
- Equity at exit
- $22,962
- IRR
- 10.0%
- Equity multiple
- 1.84×
- Total profit
- $36,312
- Equity at exit
- $13,315
Cash invested: $43,120 (down + closing). Projections, not guarantees.
Landlord ↔ Tenant lean methodology
- Overall (STATE)
- 86 Strongly Landlord-Friendly
- State Utah
- 86 Strongly Landlord-Friendly · R+15
- County
- — inherits STATE
- City
- — inherits STATE
ZIP-level market 84721
- Rents YoY
- 5.0%
- Active inventory
- 819
- Price-to-rent
- 7.5×
Monthly cashflow live
- Estimated rent
- $1,712 medium interval (Pro) →
- Mortgage (P&I)
- −$808
- Tax est. 1.5%
- −$192 /mo · $2,310/yr
- Insurance
- −$64
- HOA
- −$0
- Vacancy / Maint / Mgmt
- −$360
- Net cashflow
- $288
Break-even live
UW: 25.0% down · 7.5% · 30yr · 1.5% tax · 5.0% vac · 8.0% maint · 8.0% mgmt
Financing live
Cash to close
- Down payment
- $38,500
- Closing costs
- $4,620
- Reserves months
- —
- Total cash needed
- —
Loan-product check · same deal, 3 products live
Conventional
25% down · 7.5% · 30yr
- Down + closing
- —
- Monthly P&I
- —
- Monthly cashflow
- —
- DSCR
- —
- Eligible?
- —
Personal DTI + credit; lowest rate.
DSCR
20% down · 8.5% · 30yr
- Down + closing
- —
- Monthly P&I
- —
- Monthly cashflow
- —
- DSCR
- —
- Eligible?
- —
No personal income docs; deal must DSCR.
Hard money
10% down · 12.0% · 12mo
- Down + closing
- —
- Monthly P&I
- —
- Monthly cashflow
- —
- DSCR
- —
- Eligible?
- —
Short-term bridge; refi at stabilization.
Listing history 4 events
-
2026-04-23status Pending
-
2026-04-02price $154,000
-
2026-03-25price $159,000
-
2026-03-06$165,000 Active
ⓘ Source: listings_history table (triggers on properties + properties_extension) + one-shot
backfill from property_details.listing_events for pre-trigger history.
Climate risk First Street
- Flood 6/10 Major 73% chance over 30 yrs
- Wildfire 5/10 Major
- Heat 3/10 Moderate 7 d/yr ≥91°F today · 22 d/yr by 30 yrs out
- Wind 1/10 Low
- Air quality 3/10 Moderate 2 unhealthy d/yr today · 2 by 30 yrs out
Nearby sold comps map
Loading sold comps map…
Walkable amenities ~0.75 mi
Loading nearby amenities…
Taxation est. · year 1
- Rental income
- $20,546
- − Mortgage interest
- −$8,626
- − Property taxes
- −$2,310
- − Insurance
- −$770
- − Repairs & maintenance
- −$1,644
- − Management
- −$1,644
- − Depreciation
- −$4,480
- Taxable income
- $1,072
- Est. tax owed @ 24.0%
- −$257
- After-tax cash flow
- $3,203/yr
For passive investors: Depreciation is non-cash, so a rental often shows a tax loss while cash-flowing — sheltering income. Rental losses are passive: they offset passive income freely, and up to $25,000/yr can offset ordinary (W-2) income if you actively participate and your MAGI is under $100k (phasing out to $0 by $150k); unused losses carry forward. On sale, claimed depreciation is recaptured at up to 25%, and gains may owe capital-gains tax (a 1031 exchange can defer both). Figures are a year-1 estimate at your 24.0% rate — not tax advice; consult a CPA.
Schools (NCES district)
- District
- Iron District
- NCES district ID
- 4900390
- Math proficiency
- 40% ▼ -9.00%
- Reading proficiency
- 44% ▼ -6.00%
- Median HH income
- $43,150
- Composite
- 35.49/100
- National rank
- #4922
- State rank
- #42 of 80 in UT
Livability — Cedar City
- Score
- 64/100
- State rank
- #170
- US rank
- #13398
Category grades
Schools grade is shown separately in the Schools card above.
Census & demographics
- Census place
- Cedar City, UT
- County
- Iron County · 56,349 people
- City population
- 56,349
- Metro
- Cedar City, UT
- Population (ZIP)
- 30,641
- Household income
- $67,299
- Rent vs Own
- Severe rent burden
- 736.0
Population outlook (Iron County) Hauer SSP2
- Today (2025)
- 53,029 people
- By 2030
- 55,084 · +3.9%
- By 2040
- 58,269 · +9.9%
- By 2050
- 60,462 · +14.0%
- By 2075
- 61,312 · +15.6%
- By 2100
- 57,973 · +9.3%
Race, ethnicity, and origin ACS 2023
- Neighborhood character
- Predominantly White (84%)
- Race & ethnicity
- White 84% Hispanic / Latino 12% Two or more races 6% Native American 1%
- Hispanic origin (detail)
- Mexican 10%
- Common ancestry
- Italian 6% Slovak 5% Portuguese 2%
- Foreign-born
- 3% · Canada, Jamaica
- Languages at home
- 92% English-only · Spanish 6%
Political lean MEDSL · Iron
- 2024 margin
- Solid R (+57.0) · D 20.4% · R 77.4% · Other 2.2%
- 2008→2024 swing
- -0.7pp no change · 2008: -56.3pp · 2024: -57.0pp
- All cycles
- 2024: R+57.0 2020: R+56.6 2016: R+51.6 2012: R+71.8 2008: R+56.3
Not yet ingested
- Civics
- —
Market trends
- HPI YoY
- ▼ -144.58%
- Current HPI
- 239.3105
- Rent YoY
- ▲ 5.02%
- Metro
- Cedar City, UT
- State GDP YoY
- ▲ 3.54%
- F500 in state
- 2
Industry mix (Fortune 500 HQ in UT)
| Industry | F500 HQs | Revenue |
|---|---|---|
| Financial Services | 1 | $3B |
|
||
Price history
-6.7% since first listed4 events — show timeline
- 2026-04-23 Pending — ICBORMLS
- 2026-04-02 Price Changed $154,000 ICBORMLS
- 2026-03-25 Price Changed $159,000 ICBORMLS
- 2026-03-06 Listed $165,000 ICBORMLS
Cash-flow waterfall
monthlySold comps — $/sqft
last 12 mo · ≤1 miLoading sold comps…