 🏗️ New Construction
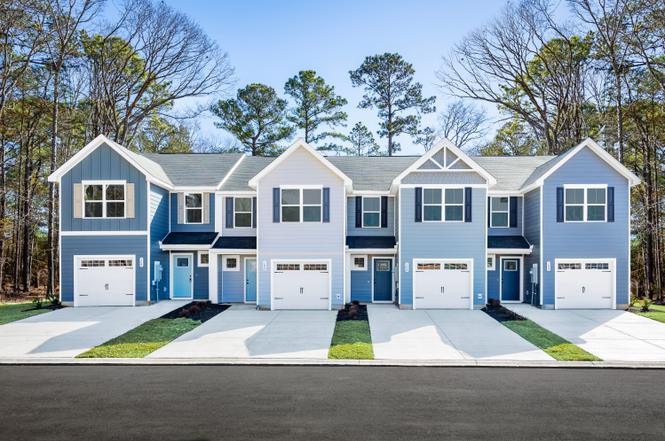
Poplar Plan · Santee, SC
Flood risk No data
- FEMA flood zone
- —
- Chance of flooding over 30 yrs
- —
- Est. flood insurance / yr
- —
Fire risk No data
- Est. fire insurance / yr
- —
Heat risk No data
- Hot days now (above threshold)
- —
- Hot days in 30 yrs
- —
Wind risk No data
- Chance of severe wind over 30 yrs
- —
Air-quality risk No data
- Unhealthy air days now
- —
- Unhealthy air days in 30 yrs
- —
Risk factors via First Street. Map © Google.
Why this score? — see what drove the C grade
The composite is a weighted blend of 9 inputs, each scored 0–100. Each bar is that input's sub-score; the figure is the points it added to the 100-point composite (weight × sub-score).
- Cash flow +18.0/30.0
- ARV discount +7.5/15.0
- Appreciation +6.7/10.0
- DSCR +5.7/10.0
- Schools +5.0/10.0
- 1% rule +4.8/10.0
- Livability +3.1/5.0
- Rent growth +2.5/5.0
- Condition / age +2.5/5.0
$176,990
🖨 Deal sheet (PDF) 📄 Offer letter ✓ Due diligence
Listing remarks
Welcome to Chapel Branch by Ryan Homes, an easy first step to homeownership with modern homes and peace of mind built in. From the upper $100s. The Poplar townhome blends sensibility and style. Enter the welcoming foyer from the covered porch or through the garage. It's the perfect location for a family zone. The wide-open great room flows seamlessly into the gourmet kitchen and light-filled dining area, with an optional island providing extra storage and counter space. Upstairs, find two generous secondary bedrooms and a full bath; continue past the second-floor laundry toward the luxurious master suite. This private retreat includes a dual vanity bath and enormous walk-in closet.
Key facts
- Covered porch
- Extra storage
- Gourmet kitchen
Tags
Property features AI
Finance
- Financial info: List price $174,990
Exterior
- Utilities: Central air conditioning
- Home design: Poplar floor plan; Plan inventory type
Interior
- Bedrooms: 3 bedrooms
- Bathrooms: 2 full bathrooms and 1 half bathroom (2.5 total)
- Heating & cooling: Central air conditioning
- Interior features: Central air conditioning
Neighborhood map
What this means for you Summary
Snapshot
- This is a 3-bed/2.5-bath townhouse listed at $177k.
Deal economics
- At list price, monthly cash flow is $195 ($2k/yr) — positive.
- The deal already cash-flows at list — no discount required.
- Meets the 1% rule at list price ($2k rent vs $177k).
- Recommended offer: $156k (12.0% below list) — sets the bar for market timing.
- Cap rate 7.3% vs local median 5.4% in Santee — top-decile yield for the area; either an underpriced asset or a hidden risk that comps aren't pricing in. Stress-test before assuming the spread holds.
Location & tenants
- Location reads 61/100 on livability (#202 in SC) — a middle-class / working-renter tenant base. Strengths: cost of living A+, health & safety A+; Watch: schools D+, crime F, amenities F.
- Market conditions: 154 active listings in the ZIP; 3 comparable units currently listed for rent nearby; rentals at typical pace (median 24d on market — plan ~3-4 weeks tenant-placement turnaround); 87 units permitted in Orangeburg County in 2024 (0 in 5+ unit buildings).
Forward outlook
- In year one you build about $9k of equity ($2k loan paydown + $8k appreciation (3.5% local appreciation)).
- Orangeburg County population projected at -27% by 2050 — secular population decline; favor cash flow + early exit over multi-decade hold.
- At projected returns (3.5% appreciation + 3.0% rent growth), your $63k cash investment doubles in ~5 years — after that, you're playing with house money.
- By year 4, paydown + projected appreciation supports a ~$32k cash-out refi (75% LTV) — recoverable capital for the next deal without selling this one.
Negotiation context
- It's been on market 315 days — a 12% lower offer ($156k) is reasonable based on typical stale-listing flexibility.
Questions for the listing agent
- It's been on market 315 days. Have you received any prior offers? Is the seller open to a 12% concession, seller financing, or rate buy-down credit?
- Why hasn't it sold? Are there any deal-killer items the seller is aware of (foundation, flood, title, zoning, code violations)?
- Is there a deadline driving the sale (1031 exchange, divorce, estate, relocation)? That informs how much negotiation room exists.
- Schools are D-rated, which usually means shorter tenancies and higher turnover. Who's the typical renter profile here, and what's been the actual vacancy rate?
- Crime grade is F in this area — have there been break-ins, vandalism, or insurance claims at this property in the last 3 years? What carrier currently insures it and at what premium?
- What's the average days-on-market for RENTAL listings here right now (not sales)? A rising rental-DOM trend means longer vacancies and softer asking-rent achievability than the comps imply.
- What's the recent tenant-quality profile in this submarket — average credit score on applications, eviction rate, late-payment / NSF rate, and stable-employment percentage? A property-management company in the area should have these aggregated.
- How much new for-sale + rental construction is in the pipeline within 1–3 miles? Heavy new supply typically softens prices + rents 12–24 months out; constrained supply supports both.
Investment metrics
- 1% rule
- 0.98% ✗
- Cap rate
- 7.33%
- Cash-on-cash
- 3.72%
- DSCR
- 1.17
- GRM
- 8.5
CMA / ARV
- ARV (on-the-fly)
- $224,952
- Comps found
- 12
Show comp detail 12 sales within ~0.75 mi
| Address | Dist | Beds/Ba | Sqft | Sold | Price | $/sf | Match |
|---|---|---|---|---|---|---|---|
| 113 Picard Loop | 0.01mi | 3/2.5 | 1,442 (0%) | 9mo | $229,990 | $159 | 92 |
| 111 Picard Loop | 0.01mi | 3/2.5 | 1,442 (0%) | 11mo | $229,990 | $159 | 90 |
| 102 Tancaw Pl | 0.10mi | 3/2.5 | 1,442 (0%) | 7mo | $219,990 | $153 | 89 |
| 109 Picard Loop | 0.02mi | 3/2.5 | 1,442 (0%) | 14mo | $227,990 | $158 | 88 |
| 108 Tancaw Pl | 0.12mi | 3/2.5 | 1,442 (0%) | 12mo | $230,990 | $160 | 85 |
| 338 Picard Loop | 0.06mi | 3/2.5 | 1,634 (+13%) | 4mo | $246,000 | $151 | 72 |
| 294 Picard Loop | 0.10mi | 3/2.5 | 1,634 (+13%) | 17mo | $247,990 | $152 | 59 |
| 300 Picard Loop | 0.12mi | 3/2.5 | 1,634 (+13%) | 17mo | $247,990 | $152 | 58 |
| 290 Picard Loop | 0.11mi | 3/2.5 | 1,634 (+13%) | 18mo | $247,990 | $152 | 58 |
| 340 Picard Loop | 0.07mi | 3/2.5 | 1,634 (+13%) | 22mo | $249,990 | $153 | 56 |
| 306 Picard Loop | 0.11mi | 3/2.5 | 1,634 (+13%) | 21mo | $264,990 | $162 | 55 |
| 304 Picard Loop | 0.11mi | 3/2.5 | 1,634 (+13%) | 22mo | $254,990 | $156 | 55 |
Match score weights: distance 35% · size 25% · config 20% · recency 20%. Top-matched comps best support the ARV.
Projected returns pro-forma
3.47% appreciation · 3.0% rent growth · sell at horizon
- IRR
- 12.2%
- Equity multiple
- 1.72×
- Total profit
- $45,246
- Equity at exit
- $107,199
- IRR
- 14.0%
- Equity multiple
- 3.17×
- Total profit
- $136,830
- Equity at exit
- $170,073
Cash invested: $62,987 (down + closing). Projections, not guarantees.
Landlord ↔ Tenant lean methodology
- Overall (STATE)
- 90 Strongly Landlord-Friendly
- State South Carolina
- 90 Strongly Landlord-Friendly · R+6
- County
- — inherits STATE
- City
- — inherits STATE
ZIP-level market 29142
- Home prices YoY
- 1.8%
- Active inventory
- 154
- Price-to-rent
- 6.7×
Monthly cashflow live
- Estimated rent
- $2,215 medium interval (Pro) →
- Mortgage (P&I)
- −$1,180
- Tax est. 1.5%
- −$281 /mo · $3,374/yr
- Insurance
- −$94
- HOA
- −$0
- Vacancy / Maint / Mgmt
- −$465
- Net cashflow
- $195
Break-even live
Sensitivity live
| Price | -10% $351 | -5% $273 | +0% $195 | +5% $117 | +10% $40 |
|---|---|---|---|---|---|
| Rent | -10% $20 | -5% $108 | +0% $195 | +5% $283 | +10% $370 |
| Rate | -1.0pp $308 | -0.5pp $252 | base $195 | +0.5pp $137 | +1.0pp $78 |
UW: 25.0% down · 7.5% · 30yr · 1.5% tax · 5.0% vac · 8.0% maint · 8.0% mgmt
Financing live
Cash to close
- Down payment
- $56,238
- Closing costs
- $6,749
- Reserves months
- —
- Total cash needed
- —
Loan-product check · same deal, 3 products live
Conventional
25% down · 7.5% · 30yr
- Down + closing
- —
- Monthly P&I
- —
- Monthly cashflow
- —
- DSCR
- —
- Eligible?
- —
Personal DTI + credit; lowest rate.
DSCR
20% down · 8.5% · 30yr
- Down + closing
- —
- Monthly P&I
- —
- Monthly cashflow
- —
- DSCR
- —
- Eligible?
- —
No personal income docs; deal must DSCR.
Hard money
10% down · 12.0% · 12mo
- Down + closing
- —
- Monthly P&I
- —
- Monthly cashflow
- —
- DSCR
- —
- Eligible?
- —
Short-term bridge; refi at stabilization.
Rent comps 3 comps
| Address | Beds | Baths | Sqft | Rent | $/sqft | DOM | Units | Dist |
|---|---|---|---|---|---|---|---|---|
| 764 Striped Bass Ct Santee, SC | 3.0 | 2.0 | 1183 | $2,000 | $1.69 | 24d | 1 | 0.31mi |
| 208 Trillium Ct Santee, SC | 3.0 | 3.0 | 1500 | $2,100 | $1.40 | 24d | 1 | 0.90mi |
| 127 Ballard Ln Santee, SC | 2.0 | 2.0 | 1300 | $2,999 | $2.31 | 24d | 1 | 1.02mi |
Listing history 16 events
-
2026-06-19days on market $176,990 Active 315 DOM
-
2026-06-18days on market $176,990 Active 314 DOM
-
2026-06-17days on market $176,990 Active 313 DOM
-
2026-06-16days on market $176,990 Active 312 DOM
-
2026-06-15days on market $176,990 Active 311 DOM
-
2026-06-14days on market $176,990 Active 309 DOM
-
2026-06-12days on market $176,990 Active 308 DOM
-
2026-06-09days on market $176,990 Active 305 DOM
-
2026-06-08days on market $176,990 Active 304 DOM
-
2026-06-07days on market $176,990 Active 303 DOM
-
2026-06-07days on market $176,990 Active 302 DOM
-
2026-06-04days on market $176,990 Active 299 DOM
-
2026-06-02pricedays on market $176,990 Active 298 DOM
-
2026-06-01days on market $174,990 Active 297 DOM
-
2026-05-31days on market $174,990 Active 296 DOM
-
2026-05-31days on market $174,990 Active 295 DOM
ⓘ Source: listings_history table (triggers on properties + properties_extension) + one-shot
backfill from property_details.listing_events for pre-trigger history.
Nearby sold comps map
Loading sold comps map…
Walkable amenities ~0.75 mi
Loading nearby amenities…
Taxation est. · year 1
- Rental income
- $26,578
- − Mortgage interest
- −$12,601
- − Property taxes
- −$3,374
- − Insurance
- −$1,125
- − Repairs & maintenance
- −$2,126
- − Management
- −$2,126
- − Depreciation
- −$6,544
- Taxable loss
- −$1,319
- Est. tax savings @ 24.0%
- +$316
- After-tax cash flow
- $2,658/yr
For passive investors: Depreciation is non-cash, so a rental often shows a tax loss while cash-flowing — sheltering income. Rental losses are passive: they offset passive income freely, and up to $25,000/yr can offset ordinary (W-2) income if you actively participate and your MAGI is under $100k (phasing out to $0 by $150k); unused losses carry forward. On sale, claimed depreciation is recaptured at up to 25%, and gains may owe capital-gains tax (a 1031 exchange can defer both). Figures are a year-1 estimate at your 24.0% rate — not tax advice; consult a CPA.
Schools (NCES district)
No district data.
Livability — Santee
- Score
- 61/100
- State rank
- #202
- US rank
- #17354
Category grades
Schools grade is shown separately in the Schools card above.
Census & demographics
- Census place
- Santee, SC
- Population (ZIP)
- 4,658
Population outlook (Orangeburg County) Hauer SSP2
- Today (2025)
- 82,698 people
- By 2030
- 78,615 · -4.9%
- By 2040
- 69,308 · -16.2%
- By 2050
- 60,629 · -26.7%
- By 2075
- 42,678 · -48.4%
- By 2100
- 28,136 · -66.0%
Race, ethnicity, and origin ACS 2023
- Neighborhood character
- Majority Black (64%)
- Race & ethnicity
- Black 64% White 31% Asian 3% Hispanic / Latino 2%
- Common ancestry
- Lithuanian 2% Romanian 2%
- Foreign-born
- 1%
- Languages at home
- 96% English-only · Other Indo-European 2% Spanish 1%
Political lean MEDSL · Orangeburg
- 2024 margin
- Strong D (+24.6) · D 61.8% · R 37.2% · Other 1.1%
- 2008→2024 swing
- -13.5pp toward R · 2008: 38.1pp · 2024: 24.6pp
- All cycles
- 2024: D+24.6 2020: D+33.2 2016: D+37.0 2012: D+43.5 2008: D+38.1
Not yet ingested
- Civics
- —
Market trends
- HPI YoY
- ▲ 3.47%
- Current HPI
- 193.5623
- Rent YoY
- —
- Metro
- —
- State GDP YoY
- ▲ 4.51%
- F500 in state
- 2
Industry mix (Fortune 500 HQ in SC)
| Industry | F500 HQs | Revenue |
|---|---|---|
| Packaging | 1 | $7B |
|
||
Cash-flow waterfall
monthlySold comps — $/sqft
last 12 mo · ≤1 miLoading sold comps…