 Duplex
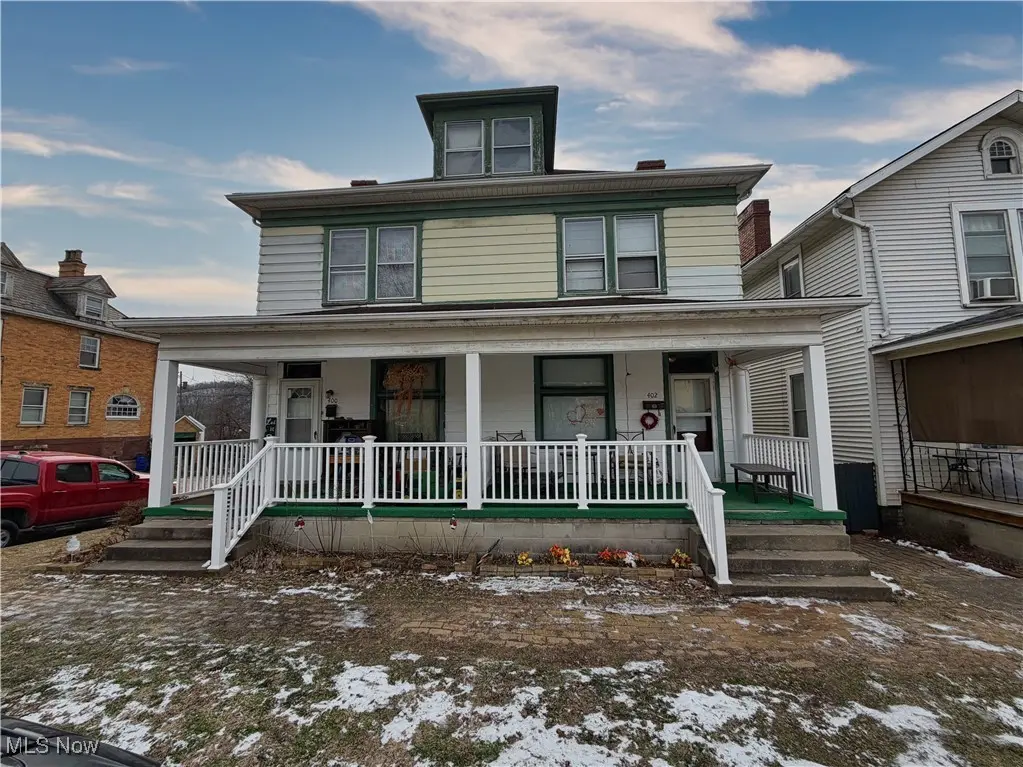
400 & 402 W 4th St · East Liverpool, OH
Flood risk 1/10 · Minimal
- FEMA flood zone
- X (unshaded)
- Chance of flooding over 30 yrs
- 0.0%
- Est. flood insurance / yr
- $473 – $860
Fire risk 1/10 · Minimal
- Est. fire insurance / yr
- $713 – $1,323
Heat risk 4/10 · Minor
- Hot days now (above 97°F)
- 8 days/yr
- Hot days in 30 yrs
- 19 days/yr
Wind risk 1/10 · Minimal
- Chance of severe wind over 30 yrs
- —
Air-quality risk 2/10 · Minimal
- Unhealthy air days now
- 1 days/yr
- Unhealthy air days in 30 yrs
- 2 days/yr
Risk factors via First Street. Map © Google.
Why this score? — see what drove the C grade
The composite is a weighted blend of 9 inputs, each scored 0–100. Each bar is that input's sub-score; the figure is the points it added to the 100-point composite (weight × sub-score).
- Cash flow +30.0/30.0
- DSCR +10.0/10.0
- 1% rule +8.2/10.0
- Livability +3.4/5.0
- Schools +2.7/10.0
- Rent growth +2.5/5.0
- Condition / age +2.5/5.0
- ARV discount +0.0/15.0
- Appreciation +0.0/10.0
$108,000
🖨 Deal sheet 📄 Offer letter ✓ Due diligence
Multi-family units
County records classify this as Multi-Family (2-4 Unit). Listing-text estimate: 2 units. confirmed
Listing remarks MLS
Excellent investment opportunity or live-in scenario!. Located next to East LiverPool City Hospital and the Newell Bridge. This well-maintained duplex offers strong rental potential or the perfect owner-occupant setup—live in one side and let the other side pay your mortgage. Unit 1 features 3 bedrooms, 1 full bathroom, living room, dining room, kitchen, and convenient basement laundry. Unit 2 offers 3 bedrooms, 1.5 bathrooms, living room, dining room, kitchen, basement laundry, and a one car garage. Both units have been updated with gas furnaces, updated electrical breaker boxes, and updated hot water tanks, providing peace of mind and reduced maintenance costs for years to come.
Key facts
- Owner-occupant setup
- Updated gas furnaces
- 2,273 sq ft lot
Tags
Neighborhood map
What this means for you Summary
Snapshot
- This is a 2 × 3.0-bed/1.5-bath units multifamily listed at $108k.
Deal economics
- At list price, monthly cash flow is $419 ($5k/yr) — positive. Per door: $209/mo.
- The deal already cash-flows at list — no discount required.
- Meets the 1% rule at list price ($1k rent vs $108k).
- Recommended offer: $95k (12.0% below list) — sets the bar for market timing.
Location & tenants
- Location reads 67/100 on livability (#613 in OH) — a middle-class / working-renter tenant base. Strengths: cost of living A+, housing A+, health & safety A+; Watch: amenities F, commute F, employment F.
- East Liverpool City (town): math 28% / reading 37% proficiency, ranked #571 of 656 in OH (top 87%) — families likely to look elsewhere, expect single-tenant / working-renter base with shorter leases; 78% free/reduced lunch — lower-income household profile, screen leases tightly.
- Market conditions: 114 active listings in the ZIP; 49 units permitted in Columbiana County in 2024 (0 in 5+ unit buildings).
- This rent runs 34% of the median local income ($51k/yr) — at the standard rent-burdened threshold; future hikes will face affordability resistance.
Forward outlook
- Local home prices are declining (-3.0%/yr); year-one equity from $747 of loan paydown is wiped out by about $3k of value loss. Plan a longer hold.
- Columbiana County population projected at -23% by 2050 — secular population decline; favor cash flow + early exit over multi-decade hold.
- At projected returns (-3.0% appreciation + 3.0% rent growth), your $30k cash investment doubles in ~8 years — after that, you're playing with house money.
Negotiation context
- It's been on market 137 days — a 12% lower offer ($95k) is reasonable based on typical stale-listing flexibility.
- Current owner paid $25k; list at $108k implies a 332% gain — meaningful room to come down on a strong offer.
Risks & watch-outs
- Watch-outs: built in 1930 — expect roof / HVAC / electrical / plumbing capex.
Questions for the listing agent
- It's been on market 137 days. Have you received any prior offers? Is the seller open to a 12% concession, seller financing, or rate buy-down credit?
- Can we see the unit-by-unit rent roll, current vacancy, and any below-market leases? What's the average tenancy length?
- What capital expenditures (roof, boiler, parking lot, exteriors) have been made in the last 5 years, and what's planned in the next 2?
- Built in 1930 — when were the roof, HVAC, electrical panel, plumbing, and water heater last replaced?
- Why hasn't it sold? Are there any deal-killer items the seller is aware of (foundation, flood, title, zoning, code violations)?
- Is there a deadline driving the sale (1031 exchange, divorce, estate, relocation)? That informs how much negotiation room exists.
- What's the average days-on-market for RENTAL listings here right now (not sales)? A rising rental-DOM trend means longer vacancies and softer asking-rent achievability than the comps imply.
- What's the recent tenant-quality profile in this submarket — average credit score on applications, eviction rate, late-payment / NSF rate, and stable-employment percentage? A property-management company in the area should have these aggregated.
- How much new apartment / multifamily construction is in the pipeline within 1–3 miles? Heavy new supply (>2% of stock underway) typically softens rents 12–24 months out; light construction supports rent growth.
Investment metrics
- 1% rule
- 1.32% ✓
- Cap rate
- 10.94%
- Cash-on-cash
- 16.61%
- DSCR
- 1.74
- GRM
- 6.3
CMA / ARV
- ARV (median comp)
- $91,940
- List price
- $108,000
- Delta
- 17.47%
- Verdict
- OVERPRICED
- Comps
- 5 within 1.0 mi
Projected returns pro-forma
-3.0% appreciation · 3.0% rent growth · sell at horizon
- IRR
- 7.7%
- Equity multiple
- 1.30×
- Total profit
- $9,160
- Equity at exit
- $16,103
- IRR
- 17.0%
- Equity multiple
- 2.40×
- Total profit
- $42,299
- Equity at exit
- $9,338
Cash invested: $30,240 (down + closing). Projections, not guarantees.
Landlord ↔ Tenant lean methodology
- Overall (STATE)
- 73 Landlord-Friendly
- State Ohio
- 73 Landlord-Friendly · R+6
- County
- — inherits STATE
- City
- — inherits STATE
ZIP-level market 43920
- Home prices YoY
- -29.3%
- Active inventory
- 114
- Price-to-rent
- 12.6×
Monthly cashflow live
- Estimated rent
- $1,425 medium interval (Pro) →
- Mortgage (P&I)
- −$566
- Tax from tax record
- −$96 /mo · $1,149/yr
- Insurance
- −$45
- HOA
- −$0
- Vacancy / Maint / Mgmt
- −$299
- Net cashflow
- $419
Break-even live
2-unit breakdown (identical units grouped — click to expand)
| Units | Beds | Baths | Est. rent |
|---|---|---|---|
| 2× units | 3.0 | 1.5 | $1,424 |
| #1 | 3.0 | 1.5 | $712 |
| #2 | 3.0 | 1.5 | $712 |
| Total (2 units) | $1,425 | ||
UW: 25.0% down · 7.5% · 30yr · 1.5% tax · 5.0% vac · 8.0% maint · 8.0% mgmt
Financing live
Cash to close
- Down payment
- $27,000
- Closing costs
- $3,240
- Reserves months
- —
- Total cash needed
- —
Loan-product check · same deal, 3 products live
Conventional
25% down · 7.5% · 30yr
- Down + closing
- —
- Monthly P&I
- —
- Monthly cashflow
- —
- DSCR
- —
- Eligible?
- —
Personal DTI + credit; lowest rate.
DSCR
20% down · 8.5% · 30yr
- Down + closing
- —
- Monthly P&I
- —
- Monthly cashflow
- —
- DSCR
- —
- Eligible?
- —
No personal income docs; deal must DSCR.
Hard money
10% down · 12.0% · 12mo
- Down + closing
- —
- Monthly P&I
- —
- Monthly cashflow
- —
- DSCR
- —
- Eligible?
- —
Short-term bridge; refi at stabilization.
Listing history 15 events
-
2026-06-18days on market $108,000 Active 137 DOM
-
2026-06-17days on market $108,000 Active 136 DOM
-
2026-06-16days on market $108,000 Active 135 DOM
-
2026-06-15days on market $108,000 Active 134 DOM
-
2026-06-13pricedays on market $108,000 Active 132 DOM
-
2026-06-09days on market $120,000 Active 128 DOM
-
2026-06-08days on market $120,000 Active 127 DOM
-
2026-06-07days on market $120,000 Active 126 DOM
-
2026-06-03days on market $120,000 Active 122 DOM
-
2026-06-02days on market $120,000 Active 121 DOM
-
2026-06-01days on market $120,000 Active 120 DOM
-
2026-05-31days on market $120,000 Active 119 DOM
-
2026-01-29$120,000 Active 695-char remark
Show marketing remark (695 chars)
Excellent investment opportunity or live-in scenario!. Located next to East LiverPool City Hospital and the Newell Bridge. This well-maintained duplex offers strong rental potential or the perfect owner-occupant setup—live in one side and let the other side pay your mortgage. Unit 1 features 3 bedrooms, 1 full bathroom, living room, dining room, kitchen, and convenient basement laundry. Unit 2 offers 3 bedrooms, 1.5 bathrooms, living room, dining room, kitchen, basement laundry, and a one car garage. Both units have been updated with gas furnaces, updated electrical breaker boxes, and updated hot water tanks, providing peace of mind and reduced maintenance costs for years to come.
-
2010-01-25soldstatus $25,000
-
2005-04-11soldstatus $50,000
ⓘ Source: listings_history table (triggers on properties + properties_extension) + one-shot
backfill from property_details.listing_events for pre-trigger history.
Tax reassessment forecast OH · Partial reset (capped growth)
- Current annual tax
- $1,149 · $96/mo
- Projected year-2 tax
- $1,417 · $118/mo
- Expected delta
- +$268/yr (+$22/mo · 23.3%)
ⓘ Screening estimate from a state-policy table — verify with the county assessor before closing.
Climate risk First Street
- Flood 1/10 Low FEMA zone X (unshaded) · 0% chance over 30 yrs
- Wildfire 1/10 Low
- Heat 4/10 Moderate 8 d/yr ≥97°F today · 19 d/yr by 30 yrs out
- Wind 1/10 Low
- Air quality 2/10 Low 1 unhealthy d/yr today · 2 by 30 yrs out
Nearby sold comps map
Loading sold comps map…
Walkable amenities ~0.75 mi
Loading nearby amenities…
Taxation est. · year 1
- Rental income
- $17,100
- − Mortgage interest
- −$6,050
- − Property taxes
- −$1,149
- − Insurance
- −$540
- − Repairs & maintenance
- −$1,368
- − Management
- −$1,368
- − Depreciation
- −$3,142
- Taxable income
- $3,484
- Est. tax owed @ 24.0%
- −$836
- After-tax cash flow
- $4,188/yr
For passive investors: Depreciation is non-cash, so a rental often shows a tax loss while cash-flowing — sheltering income. Rental losses are passive: they offset passive income freely, and up to $25,000/yr can offset ordinary (W-2) income if you actively participate and your MAGI is under $100k (phasing out to $0 by $150k); unused losses carry forward. On sale, claimed depreciation is recaptured at up to 25%, and gains may owe capital-gains tax (a 1031 exchange can defer both). Figures are a year-1 estimate at your 24.0% rate — not tax advice; consult a CPA.
Schools (NCES district)
- District
- East Liverpool City
- NCES district ID
- 3904391
- Math proficiency
- 28% ▼ -16.00%
- Reading proficiency
- 37% ▼ -10.00%
- Median HH income
- $34,021
- Composite
- 26.72/100
- National rank
- #7148
- State rank
- #571 of 656 in OH
Livability — East Liverpool
- Score
- 67/100
- State rank
- #613
- US rank
- #10580
Category grades
Schools grade is shown separately in the Schools card above.
Census & demographics
- Census place
- East Liverpool, OH
- County
- Columbiana · 99,532 people
- Population (ZIP)
- 21,124
- Household income
- $50,820
- Rent vs Own
- Severe rent burden
- 12.6
Population outlook (Columbiana County) Hauer SSP2
- Today (2025)
- 98,353 people
- By 2030
- 94,225 · -4.2%
- By 2040
- 85,169 · -13.4%
- By 2050
- 76,157 · -22.6%
- By 2075
- 58,451 · -40.6%
- By 2100
- 42,805 · -56.5%
Race, ethnicity, and origin ACS 2023
- Neighborhood character
- Predominantly White (90%)
- Race & ethnicity
- White 90% Two or more races 6% Black 3% Hispanic / Latino 1%
- Common ancestry
- Romanian 2% Slovak 2% Serbian 2%
- Foreign-born
- 0%
Political lean MEDSL · Columbiana
- 2024 margin
- Solid R (+49.0) · D 25.1% · R 74.1%
- 2008→2024 swing
- -41.4pp toward R · 2008: -7.6pp · 2024: -49.0pp
- All cycles
- 2024: R+49.0 2020: R+44.9 2016: R+41.6 2012: R+12.0 2008: R+7.6
Not yet ingested
- Civics
- —
Market trends
- HPI YoY
- ▼ -81.53%
- Current HPI
- 196.3908
- Rent YoY
- —
- Metro
- —
- State GDP YoY
- ▲ 1.98%
- F500 in state
- 48
Industry mix (Fortune 500 HQ in OH)
| Industry | F500 HQs | Revenue |
|---|---|---|
| Insurance | 3 | $145B |
|
||
| Industrial Machinery | 3 | $49B |
|
||
| Financial Services | 3 | $24B |
|
||
| Consumer Goods | 2 | $93B |
|
||
| Aerospace / Defense | 2 | $47B |
|
||
| Utilities | 2 | $33B |
|
||
Price history
+140.0% since first listed3 events — show timeline
- 2026-01-29 Listed $120,000 MLSNOW
- 2010-01-25 Sold (Public Records) $25,000 Public Records
- 2005-04-11 Sold (Public Records) $50,000 Public Records
Property tax history
+2.5%/yrLatest (2025): $1,149 · +8.7% YoY. Source: county tax records.
Cash-flow waterfall
monthlySold comps — $/sqft
last 12 mo · ≤1 miLoading sold comps…