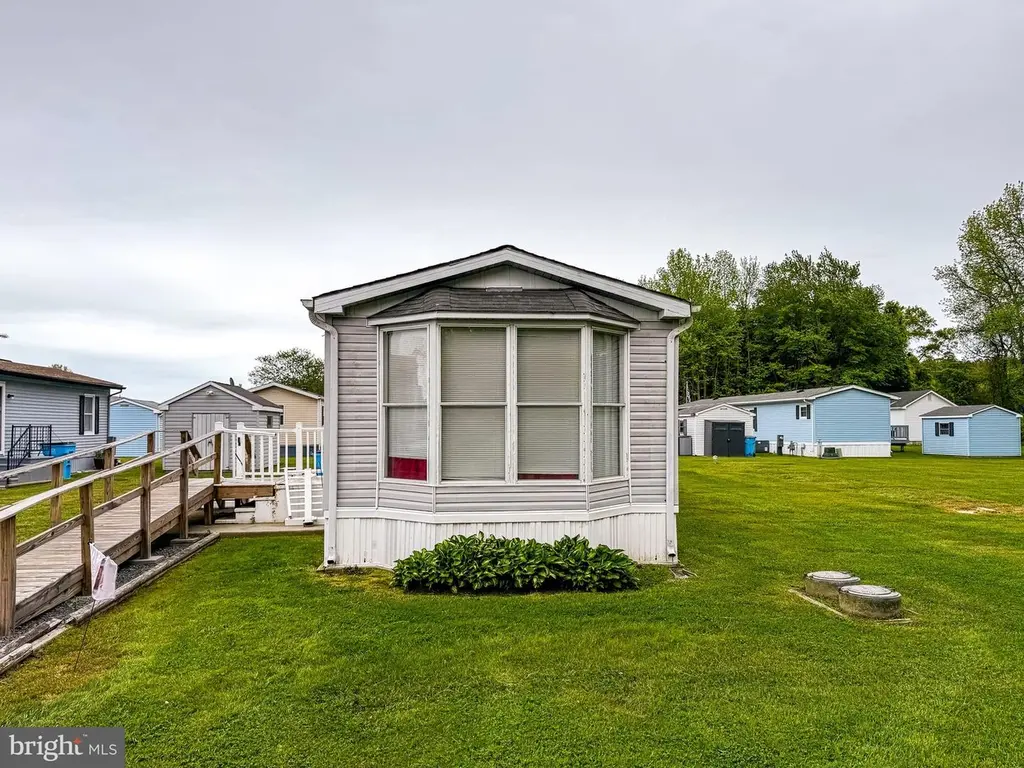
12346 Old Bridge Rd #218 · West Ocean City, MD
Flood risk No data
- FEMA flood zone
- —
- Chance of flooding over 30 yrs
- —
- Est. flood insurance / yr
- —
Fire risk No data
- Est. fire insurance / yr
- —
Heat risk No data
- Hot days now (above threshold)
- —
- Hot days in 30 yrs
- —
Wind risk No data
- Chance of severe wind over 30 yrs
- —
Air-quality risk No data
- Unhealthy air days now
- —
- Unhealthy air days in 30 yrs
- —
Risk factors via First Street. Map © Google.
Why this score? — see what drove the B+ grade
The composite is a weighted blend of 9 inputs, each scored 0–100. Each bar is that input's sub-score; the figure is the points it added to the 100-point composite (weight × sub-score).
- Cash flow +30.0/30.0
- ARV discount +15.0/15.0
- DSCR +10.0/10.0
- 1% rule +9.4/10.0
- Livability +3.9/5.0
- Schools +3.3/10.0
- Rent growth +2.5/5.0
- Condition / age +2.2/5.0
- Appreciation +0.0/10.0
$129,000
🖨 Deal sheet (PDF) 📄 Offer letter ✓ Due diligence
Listing remarks
What has 2BR and 1BA, is near the beach, located in a premier community, and is priced at $135,000? No, it’s not the first line of a great joke. Although most people would think so, given how many people want this type of scenario. .and how rarely it exists. Lucky for you, it does exist. It’s Lot #218 in the Salt Life Community in West Ocean City, MD. And no, it’s not trying to compete with the polished, fully renovated homes you’ve been scrolling past. Because what it offers is something different… a real entry point into the beach market. An entry point nobody else can compete with. This is a 2-bedroom, 1-bath single-wide home in a senior-living community
Key facts
- 4,356 sq ft lot
- 2 parking spots
- Community pool
Property features AI
Finance
- HOA & community: Monthly land lease of $740; Land lease has approximately 1 year remaining
Exterior
- Parking: Gravel driveway; Driveway parking; Two driveway spaces; Two total garage/parking spaces
- Utilities: Public water; Public sewer
- Home design: Manufactured home; Modular/Manufactured construction; Single-level unit (one floor); Land lease community (monthly land lease); Senior community with 50+ age requirement; Estimated year built
- Construction: Architectural shingle roof; Above-grade other structures
- Exterior features: Community in-ground pool; Not in a federal flood zone; Outside city limits
Interior
- Bedrooms: Two bedrooms on the main level
- Bathrooms: One full bathroom on the main level; One full bathroom total
- Heating & cooling: Heat pump heating; Central air conditioning; Electric heating and cooling; Electric hot water
- Interior features: Furnished; No basement; Estimated living area
Neighborhood map
What this means for you Summary
Snapshot
- This is a 2-bed/1.0-bath single-family listed at $129k. Condition is rated fair.
Deal economics
- At list price, monthly cash flow is $578 ($7k/yr) — positive.
- The deal already cash-flows at list — no discount required.
- Meets the 1% rule at list price ($2k rent vs $129k).
- Recommended offer: $125k (3.0% below list) — sets the bar for market timing.
- Cap rate 11.7% vs local median 2.6% in West Ocean City — top-decile yield for the area; either an underpriced asset or a hidden risk that comps aren't pricing in. Stress-test before assuming the spread holds.
Location & tenants
- Location reads 78/100 on livability (#69 in MD, #2,499 nationally) — a middle-class / working-renter tenant base. Strengths: employment A+, housing A+, health & safety A+; Watch: amenities C-, commute F, cost of living D-.
- Worcester County Public Schools (town): math 30% / reading 44% proficiency, ranked #6 of 24 in MD (top 25%) — families likely to look elsewhere, expect single-tenant / working-renter base with shorter leases.
- Market conditions: 673 active listings in the ZIP; solid renter incomes; 354 units permitted in Worcester County in 2024 (6 in 5+ unit buildings).
Forward outlook
- Local home prices are declining (-3.0%/yr); year-one equity from $892 of loan paydown is wiped out by about $4k of value loss. Plan a longer hold.
- Worcester County population projected to shrink 4% by 2050 — rents likely to lag national; underwrite the cash flow, not the appreciation.
- At projected returns (-3.0% appreciation + 3.0% rent growth), your $36k cash investment doubles in ~7 years — after that, you're playing with house money.
Negotiation context
- It's been on market 51 days — a 3% lower offer ($125k) is reasonable based on typical stale-listing flexibility.
Questions for the listing agent
- It's been on market 51 days. Have you received any prior offers? Is the seller open to a 3% concession, seller financing, or rate buy-down credit?
- Have any recent inspections been done? Can we get a copy of the seller's disclosures and any deferred-maintenance estimates?
- Is there a deadline driving the sale (1031 exchange, divorce, estate, relocation)? That informs how much negotiation room exists.
- What's the average days-on-market for RENTAL listings here right now (not sales)? A rising rental-DOM trend means longer vacancies and softer asking-rent achievability than the comps imply.
- What's the recent tenant-quality profile in this submarket — average credit score on applications, eviction rate, late-payment / NSF rate, and stable-employment percentage? A property-management company in the area should have these aggregated.
- How much new for-sale + rental construction is in the pipeline within 1–3 miles? Heavy new supply typically softens prices + rents 12–24 months out; constrained supply supports both.
Investment metrics
- 1% rule
- 1.44% ✓
- Cap rate
- 11.67%
- Cash-on-cash
- 19.19%
- DSCR
- 1.85
- GRM
- 5.8
CMA / ARV
- ARV (median comp)
- $250,000
- List price
- $129,000
- Delta
- -48.40%
- Verdict
- UNDERPRICED
- Comps
- 9 within 1.0 mi
Projected returns pro-forma
-3.0% appreciation · 3.0% rent growth · sell at horizon
- IRR
- 11.1%
- Equity multiple
- 1.44×
- Total profit
- $15,908
- Equity at exit
- $19,234
- IRR
- 20.2%
- Equity multiple
- 2.70×
- Total profit
- $61,330
- Equity at exit
- $11,154
Cash invested: $36,120 (down + closing). Projections, not guarantees.
Landlord ↔ Tenant lean methodology
- Overall (STATE)
- 27 Tenant-Leaning
- State Maryland
- 27 Tenant-Leaning · D+14
- County
- — inherits STATE
- City
- — inherits STATE
ZIP-level market 21842
- Home prices YoY
- -5.0%
- Active inventory
- 673
- Price-to-rent
- 5.8×
Monthly cashflow live
- Estimated rent
- $1,860 medium interval (Pro) →
- Mortgage (P&I)
- −$676
- Tax est. 1.5%
- −$161 /mo · $1,935/yr
- Insurance
- −$54
- HOA
- −$0
- Vacancy / Maint / Mgmt
- −$390
- Net cashflow
- $578
Break-even live
Sensitivity live
| Price | -10% $667 | -5% $622 | +0% $578 | +5% $533 | +10% $488 |
|---|---|---|---|---|---|
| Rent | -10% $431 | -5% $504 | +0% $578 | +5% $651 | +10% $724 |
| Rate | -1.0pp $642 | -0.5pp $610 | base $578 | +0.5pp $544 | +1.0pp $510 |
UW: 25.0% down · 7.5% · 30yr · 1.5% tax · 5.0% vac · 8.0% maint · 8.0% mgmt
Financing live
Cash to close
- Down payment
- $32,250
- Closing costs
- $3,870
- Reserves months
- —
- Total cash needed
- —
Loan-product check · same deal, 3 products live
Conventional
25% down · 7.5% · 30yr
- Down + closing
- —
- Monthly P&I
- —
- Monthly cashflow
- —
- DSCR
- —
- Eligible?
- —
Personal DTI + credit; lowest rate.
DSCR
20% down · 8.5% · 30yr
- Down + closing
- —
- Monthly P&I
- —
- Monthly cashflow
- —
- DSCR
- —
- Eligible?
- —
No personal income docs; deal must DSCR.
Hard money
10% down · 12.0% · 12mo
- Down + closing
- —
- Monthly P&I
- —
- Monthly cashflow
- —
- DSCR
- —
- Eligible?
- —
Short-term bridge; refi at stabilization.
Listing history 16 events
-
2026-06-18days on market $129,000 Active 51 DOM
-
2026-06-17days on market $129,000 Active 50 DOM
-
2026-06-16days on market $129,000 Active 49 DOM
-
2026-06-15days on market $129,000 Active 48 DOM
-
2026-06-14days on market $129,000 Active 46 DOM
-
2026-06-13days on market $129,000 Active 45 DOM
-
2026-06-10days on market $129,000 Active 43 DOM
-
2026-06-09days on market $129,000 Active 42 DOM
-
2026-06-08days on market $129,000 Active 41 DOM
-
2026-06-07days on market $129,000 Active 40 DOM
-
2026-06-02days on market $129,000 Active 35 DOM
-
2026-06-01days on market $129,000 Active 34 DOM
-
2026-05-31days on market $129,000 Active 33 DOM
-
2026-05-30days on market $129,000 Active 32 DOM
-
2026-04-29$135,000 Active 2624-char remark
-
2026-04-26historical $135,000 2624-char remark
ⓘ Source: listings_history table (triggers on properties + properties_extension) + one-shot
backfill from property_details.listing_events for pre-trigger history.
Nearby sold comps map
Loading sold comps map…
Walkable amenities ~0.75 mi
Loading nearby amenities…
Taxation est. · year 1
- Rental income
- $22,314
- − Mortgage interest
- −$7,226
- − Property taxes
- −$1,935
- − Insurance
- −$645
- − Repairs & maintenance
- −$1,785
- − Management
- −$1,785
- − Depreciation
- −$3,753
- Taxable income
- $5,185
- Est. tax owed @ 24.0%
- −$1,244
- After-tax cash flow
- $5,686/yr
For passive investors: Depreciation is non-cash, so a rental often shows a tax loss while cash-flowing — sheltering income. Rental losses are passive: they offset passive income freely, and up to $25,000/yr can offset ordinary (W-2) income if you actively participate and your MAGI is under $100k (phasing out to $0 by $150k); unused losses carry forward. On sale, claimed depreciation is recaptured at up to 25%, and gains may owe capital-gains tax (a 1031 exchange can defer both). Figures are a year-1 estimate at your 24.0% rate — not tax advice; consult a CPA.
Condition & rehab AI · 8 photos
This single-wide home in a senior-living community requires moderate renovations to update the kitchen and bathroom, but has a good foundation and exterior. With some updates, it could be a great entry point into the beach market.
Repairs flagged
- Major kitchen cabinets — outdated and in poor condition
- Major kitchen appliances — outdated and in poor condition
- Major kitchen countertops — outdated and in poor condition
- Major bathroom fixtures — outdated and in poor condition
- Major bathroom tile — outdated and in poor condition
Value-add opportunities
- Resale paint interior walls — Fresh paint can make a significant difference in the home's appearance
- Resale update flooring — New flooring can improve the home's overall look and feel
- Resale update kitchen cabinets and appliances — Modernizing the kitchen can attract more buyers
- Resale update bathroom fixtures and tile — A fresh bathroom can make a big impact on a home's appeal
Renovation cost estimate screening
| Repair item | Severity | Est. cost |
|---|---|---|
| kitchen cabinets · outdated and in poor condition | Major | $15,000–50,000 |
| kitchen appliances · outdated and in poor condition | Major | $15,000–50,000 |
| kitchen countertops · outdated and in poor condition | Major | $15,000–50,000 |
| bathroom fixtures · outdated and in poor condition | Major | $15,000–50,000 |
| bathroom tile · outdated and in poor condition | Major | $15,000–50,000 |
| Total estimated repair cost · 5 items | $75,000–250,000 |
Value-add ROI direction
- Resale paint interior walls — Fresh paint can make a significant difference in the home's appearance ↑
- Resale update flooring — New flooring can improve the home's overall look and feel ↑
- Resale update kitchen cabinets and appliances — Modernizing the kitchen can attract more buyers ↑
- Resale update bathroom fixtures and tile — A fresh bathroom can make a big impact on a home's appeal ↑
ⓘ Cost ranges are severity-bucket heuristics (US national rule-of-thumb). Get contractor quotes + a written scope before underwriting a rehab budget.
Schools (NCES district)
- District
- Worcester County Public Schools
- NCES district ID
- 2400720
- Math proficiency
- 30% ▼ -25.00%
- Reading proficiency
- 44% ▼ -20.00%
- Median HH income
- $56,748
- Composite
- 32.6/100
- National rank
- #5672
- State rank
- #6 of 24 in MD
Livability — West Ocean City
- Score
- 78/100
- State rank
- #69
- US rank
- #2499
Category grades
Schools grade is shown separately in the Schools card above.
Census & demographics
- Census place
- West Ocean City, MD
- County
- Worcester County · 35,603 people
- Metro
- Salisbury, MD-DE
- Population (ZIP)
- 11,226
- Household income
- $79,876
- Rent vs Own
- Severe rent burden
- 322.0
Population outlook (Worcester County) Hauer SSP2
- Today (2025)
- 51,363 people
- By 2030
- 51,191 · -0.3%
- By 2040
- 50,459 · -1.8%
- By 2050
- 49,451 · -3.7%
- By 2075
- 48,533 · -5.5%
- By 2100
- 44,223 · -13.9%
Race, ethnicity, and origin ACS 2023
- Neighborhood character
- Predominantly White (86%)
- Race & ethnicity
- White 86% Hispanic / Latino 8% Two or more races 5% Black 3%
- Hispanic origin (detail)
- Mexican 3%
- Common ancestry
- Romanian 6% Slovak 3% Lithuanian 2%
- Foreign-born
- 10% · Canada, China
- Languages at home
- 87% English-only · Spanish 7% Russian/Polish/Slavic 3% Other Indo-European 2%
Political lean MEDSL · Worcester
- 2024 margin
- Strong R (+22.0) · D 38.0% · R 60.0% · Other 2.0%
- 2008→2024 swing
- -6.5pp toward R · 2008: -15.5pp · 2024: -22.0pp
- All cycles
- 2024: R+22.0 2020: R+19.0 2016: R+27.9 2012: R+18.3 2008: R+15.5
Not yet ingested
- Civics
- —
Market trends
- HPI YoY
- ▼ -25.65%
- Current HPI
- 482.18
- Rent YoY
- —
- Metro
- Salisbury, MD-DE
- State GDP YoY
- ▲ 2.97%
- F500 in state
- 12
Industry mix (Fortune 500 HQ in MD)
| Industry | F500 HQs | Revenue |
|---|---|---|
| Aerospace / Defense | 1 | $71B |
|
||
| Utilities | 1 | $25B |
|
||
| Hotels | 1 | $24B |
|
||
| Consumer Goods | 1 | $7B |
|
||
| Real Estate | 1 | $6B |
|
||
| Chemicals | 1 | $2B |
|
||
Price history
-4.4% since first listed3 events — show timeline
- 2026-05-20 Price Changed $129,000 BRIGHT MLS
- 2026-04-29 Listed $135,000 BRIGHT MLS
- 2026-04-26 Coming Soon $135,000 BRIGHT MLS
Cash-flow waterfall
monthlySold comps — $/sqft
last 12 mo · ≤1 miLoading sold comps…