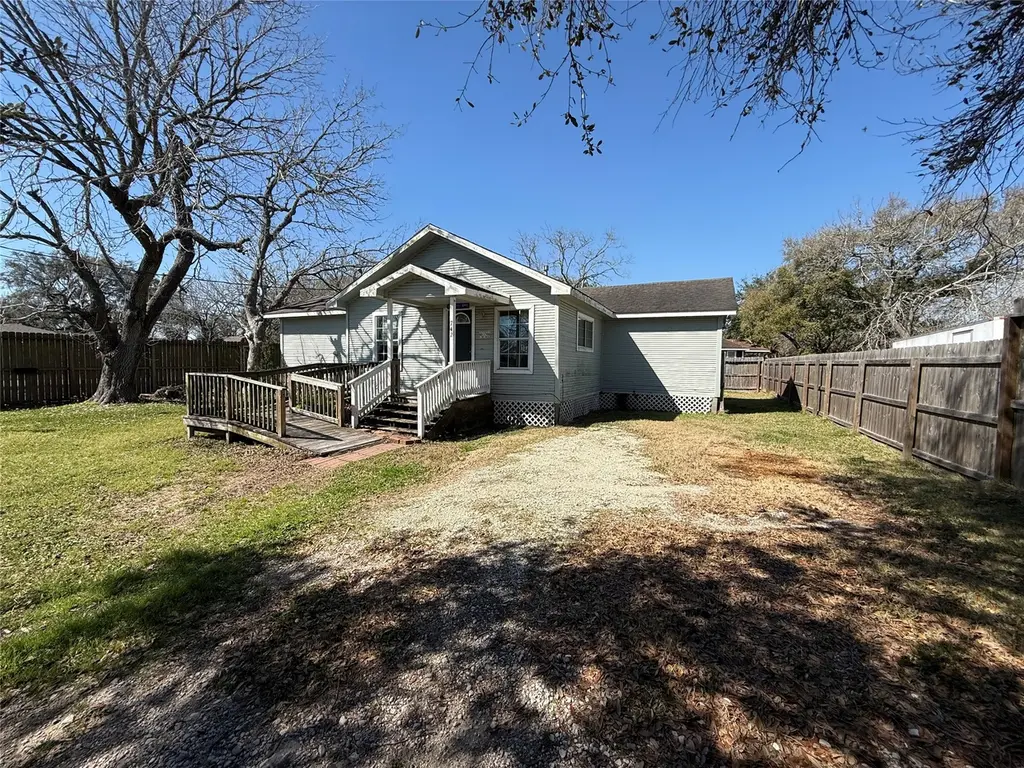
742 27th St · San Leon, TX
Flood risk 9/10 · Severe
- FEMA flood zone
- X (shaded)
- Chance of flooding over 30 yrs
- 0.98%
- Est. flood insurance / yr
- $507 – $1,088
Fire risk 1/10 · Minimal
- Est. fire insurance / yr
- $1,222 – $2,270
Heat risk 10/10 · Severe
- Hot days now (above 108°F)
- 7 days/yr
- Hot days in 30 yrs
- 27 days/yr
Wind risk 10/10 · Severe
- Chance of severe wind over 30 yrs
- 99.0%
Air-quality risk 2/10 · Minimal
- Unhealthy air days now
- 1 days/yr
- Unhealthy air days in 30 yrs
- 1 days/yr
Risk factors via First Street. Map © Google.
Why this score? — see what drove the C+ grade
The composite is a weighted blend of 9 inputs, each scored 0–100. Each bar is that input's sub-score; the figure is the points it added to the 100-point composite (weight × sub-score).
- Cash flow +20.3/30.0
- ARV discount +15.0/15.0
- 1% rule +6.9/10.0
- DSCR +6.4/10.0
- Schools +3.5/10.0
- Livability +3.1/5.0
- Rent growth +2.5/5.0
- Condition / age +2.5/5.0
- Appreciation +0.0/10.0
$175,000
🖨 Deal sheet 📄 Offer letter ✓ Due diligence
Listing remarks MLS
Investor opportunity! Charming 3 bed, 2 bath home on a corner lot with mature trees. Ideal for rental or weekend retreat, close to San Leon Elementary. Convenient location near HWY 146 and I-45, minutes from local dining in San Leon and Bacliff. Short drive to Kemah or Galveston. Sold as is.
Key facts
- Corner lot
- Mature trees
- Short drive to kemah
Tags
Neighborhood map
What this means for you Summary
Snapshot
- This is a 3-bed/1.0-bath single-family listed at $175k.
Deal economics
- At list price, monthly cash flow is $158 ($2k/yr) — positive.
- The deal already cash-flows at list — no discount required.
- Meets the 1% rule at list price ($2k rent vs $175k).
- Recommended offer: $164k (6.0% below list) — sets the bar for market timing.
- Cap rate 7.8% vs local median 1.8% in San Leon — top-decile yield for the area; either an underpriced asset or a hidden risk that comps aren't pricing in. Stress-test before assuming the spread holds.
Location & tenants
- Location reads 62/100 on livability (#899 in TX) — a middle-class / working-renter tenant base. Strengths: cost of living A+, housing A+, employment B+; Watch: schools F, amenities F, commute F.
- Dickinson ISD (suburban): math 39% / reading 40% proficiency, ranked #366 of 826 in TX (top 44%) — families likely to look elsewhere, expect single-tenant / working-renter base with shorter leases; 60% free/reduced lunch — lower-income household profile, screen leases tightly.
- Market conditions: Rents soft (-0.1%/yr); 664 active listings in the ZIP; 4 comparable units currently listed for rent nearby; rentals leasing fast (median 10d on market — plan ~1-2 weeks tenant-placement turnaround); solid renter incomes; 3,258 units permitted in Galveston County in 2024 (0 in 5+ unit buildings).
Forward outlook
- Local home prices are declining (-3.0%/yr); year-one equity from $1k of loan paydown is wiped out by about $5k of value loss. Plan a longer hold.
- Galveston County population projected at +43% by 2050 — long-run rental-demand tailwind backs the buy-and-hold thesis.
Negotiation context
- It's been on market 69 days — a 6% lower offer ($164k) is reasonable based on typical stale-listing flexibility.
- 3 sale attempts since 22y ago with the ask held roughly flat each time — persistent listings suggest the price (not the market) is what's stuck; bring a comps-based counter.
Risks & watch-outs
- Watch-outs: property tax is 3.0% of price; flood insurance adds $66/mo.
- Climate carrying-cost: severe flood risk; severe wind risk, 99% chance of damaging wind over 30y; extreme-heat days projected 7→27/yr by 2055 (HVAC capex compounding) — expect insurance premiums to compound above CPI over the hold.
Questions for the listing agent
- It's been on market 69 days. Have you received any prior offers? Is the seller open to a 6% concession, seller financing, or rate buy-down credit?
- Property tax is high relative to price — has the assessment been appealed recently, and will the sale trigger a re-assessment?
- What's the actual annual flood-insurance premium (NFIP or private), and is the property in a SFHA with mandatory coverage?
- Why hasn't it sold? Are there any deal-killer items the seller is aware of (foundation, flood, title, zoning, code violations)?
- Is there a deadline driving the sale (1031 exchange, divorce, estate, relocation)? That informs how much negotiation room exists.
- Schools are F-rated, which usually means shorter tenancies and higher turnover. Who's the typical renter profile here, and what's been the actual vacancy rate?
- What's the average days-on-market for RENTAL listings here right now (not sales)? A rising rental-DOM trend means longer vacancies and softer asking-rent achievability than the comps imply.
- What's the recent tenant-quality profile in this submarket — average credit score on applications, eviction rate, late-payment / NSF rate, and stable-employment percentage? A property-management company in the area should have these aggregated.
- How much new for-sale + rental construction is in the pipeline within 1–3 miles? Heavy new supply typically softens prices + rents 12–24 months out; constrained supply supports both.
Investment metrics
- 1% rule
- 1.19% ✓
- Cap rate
- 7.83%
- Cash-on-cash
- 5.50%
- DSCR
- 1.24
- GRM
- 7.0
CMA / ARV
- ARV (median comp)
- $271,245
- List price
- $175,000
- Delta
- -35.48%
- Verdict
- UNDERPRICED
- Comps
- 20 within 1.0 mi
Show comp detail 3 sales within ~0.75 mi
| Address | Dist | Beds/Ba | Sqft | Sold | Price | $/sf | Match |
|---|---|---|---|---|---|---|---|
| 615 28th St | 0.27mi | 2/2.0 (-1) | 1,376 (+9%) | 3mo | $299,900 | $218 | 61 |
| 2786 Avenue H | 0.23mi | 2/1.0 (-1) | 1,170 (-7%) | 23mo | $90,000 | $77 | 53 |
| 2730 Avenue D | 0.53mi | 2/1.5 (-1) | 1,271 (+1%) | 22mo | $275,000 | $216 | 49 |
Match score weights: distance 35% · size 25% · config 20% · recency 20%. Top-matched comps best support the ARV.
Projected returns pro-forma
-3.0% appreciation · 0.0% rent growth · sell at horizon
- IRR
- -14.3%
- Equity multiple
- 0.51×
- Total profit
- $-24,206
- Equity at exit
- $26,093
- IRR
- -12.8%
- Equity multiple
- 0.37×
- Total profit
- $-30,916
- Equity at exit
- $15,131
Cash invested: $49,000 (down + closing). Projections, not guarantees.
Landlord ↔ Tenant lean methodology
- Overall (STATE)
- 87 Strongly Landlord-Friendly
- State Texas
- 87 Strongly Landlord-Friendly · R+5
- County
- — inherits STATE
- City
- — inherits STATE
ZIP-level market 77539
- Home prices YoY
- -29.8%
- Rents YoY
- -0.1%
- Active inventory
- 664
- Price-to-rent
- 7.0×
Monthly cashflow live
- Estimated rent
- $2,085 medium interval (Pro) →
- Mortgage (P&I)
- −$918
- Tax from tax record
- −$432 /mo · $5,190/yr
- Insurance
- −$73
- Flood insurance flood zone
- −$66 /mo · $798/yr
- HOA
- −$0
- Vacancy / Maint / Mgmt
- −$438
- Net cashflow
- $158
Break-even live
UW: 25.0% down · 7.5% · 30yr · 1.5% tax · 5.0% vac · 8.0% maint · 8.0% mgmt
Financing live
Cash to close
- Down payment
- $43,750
- Closing costs
- $5,250
- Reserves months
- —
- Total cash needed
- —
Loan-product check · same deal, 3 products live
Conventional
25% down · 7.5% · 30yr
- Down + closing
- —
- Monthly P&I
- —
- Monthly cashflow
- —
- DSCR
- —
- Eligible?
- —
Personal DTI + credit; lowest rate.
DSCR
20% down · 8.5% · 30yr
- Down + closing
- —
- Monthly P&I
- —
- Monthly cashflow
- —
- DSCR
- —
- Eligible?
- —
No personal income docs; deal must DSCR.
Hard money
10% down · 12.0% · 12mo
- Down + closing
- —
- Monthly P&I
- —
- Monthly cashflow
- —
- DSCR
- —
- Eligible?
- —
Short-term bridge; refi at stabilization.
Rent comps 4 comps
| Address | Beds | Baths | Sqft | Rent | $/sqft | DOM | Units | Dist |
|---|---|---|---|---|---|---|---|---|
| 2735 Broadway St Unit 1546437P San Leon, TX | 3.0 | 2.0 | 1819 | $4,994 | $2.75 | 12d | 1 | 0.26mi |
| 339 Sea Breeze Dr Bacliff, TX | 3.0 | 2.5 | 1456 | $1,985 | $1.36 | 4d | 1 | 1.20mi |
| 5223 Gulf Stream Ln Bacliff, TX | 3.0 | 2.5 | 1778 | $2,080 | $1.17 | 10d | 1 | 1.20mi |
| 5139 Misty Ln Bacliff, TX | 3.0 | 2.0 | 1794 | $1,970 | $1.10 | 10d | 1 | 1.26mi |
Listing history 16 events
-
2026-06-07days on market $175,000 Active 69 DOM
-
2026-06-04days on market $175,000 Active 66 DOM
-
2026-06-03days on market $175,000 Active 65 DOM
-
2026-06-02days on market $175,000 Active 64 DOM
-
2026-06-01days on market $175,000 Active 63 DOM
-
2026-05-31days on market $175,000 Active 62 DOM
-
2026-03-30$175,000 Active 292-char remark
Show marketing remark (292 chars)
Investor opportunity! Charming 3 bed, 2 bath home on a corner lot with mature trees. Ideal for rental or weekend retreat, close to San Leon Elementary. Convenient location near HWY 146 and I-45, minutes from local dining in San Leon and Bacliff. Short drive to Kemah or Galveston. Sold as is.
-
2025-09-12soldstatus
-
2021-02-24soldstatus
-
2018-08-07soldstatus
-
2018-07-30soldstatus Sold 322-char remark
Show marketing remark (322 chars)
RECENTLY RENOVATED 3 BEDROOM 2 BATH HOME ! WALKING DISTANCE TO THE SCHOOL ON A CORNER LOT WITH LARGE MATURE TREES. FRESHLY PAINTED, WITH NEW FLOORS. NICE SIZE YARD WITH FRONT AND BACK PORCH. EXCELLENT INVESTMENT FOR RENTAL , OR FIRST TIME HOME BUYER , WEEKEND GET AWAY! GREAT LOCATION WITH EASY ACCESS TO HWY 146 AND I-45.
-
2018-07-08status Pending 322-char remark
Show marketing remark (322 chars)
RECENTLY RENOVATED 3 BEDROOM 2 BATH HOME ! WALKING DISTANCE TO THE SCHOOL ON A CORNER LOT WITH LARGE MATURE TREES. FRESHLY PAINTED, WITH NEW FLOORS. NICE SIZE YARD WITH FRONT AND BACK PORCH. EXCELLENT INVESTMENT FOR RENTAL , OR FIRST TIME HOME BUYER , WEEKEND GET AWAY! GREAT LOCATION WITH EASY ACCESS TO HWY 146 AND I-45.
-
2018-06-28status Option Pending 322-char remark
Show marketing remark (322 chars)
RECENTLY RENOVATED 3 BEDROOM 2 BATH HOME ! WALKING DISTANCE TO THE SCHOOL ON A CORNER LOT WITH LARGE MATURE TREES. FRESHLY PAINTED, WITH NEW FLOORS. NICE SIZE YARD WITH FRONT AND BACK PORCH. EXCELLENT INVESTMENT FOR RENTAL , OR FIRST TIME HOME BUYER , WEEKEND GET AWAY! GREAT LOCATION WITH EASY ACCESS TO HWY 146 AND I-45.
-
2018-05-21$145,000 Active 322-char remark
Show marketing remark (322 chars)
RECENTLY RENOVATED 3 BEDROOM 2 BATH HOME ! WALKING DISTANCE TO THE SCHOOL ON A CORNER LOT WITH LARGE MATURE TREES. FRESHLY PAINTED, WITH NEW FLOORS. NICE SIZE YARD WITH FRONT AND BACK PORCH. EXCELLENT INVESTMENT FOR RENTAL , OR FIRST TIME HOME BUYER , WEEKEND GET AWAY! GREAT LOCATION WITH EASY ACCESS TO HWY 146 AND I-45.
-
2005-02-26historical
-
2004-08-07$85,000
ⓘ Source: listings_history table (triggers on properties + properties_extension) + one-shot
backfill from property_details.listing_events for pre-trigger history.
Tax reassessment forecast TX · Resets to sale price
- Current annual tax
- $5,190 · $432/mo
- Projected year-2 tax
- $5,190 · $432/mo
- Expected delta
- $0/yr ($0/mo · 0.0%)
ⓘ Screening estimate from a state-policy table — verify with the county assessor before closing.
Climate risk First Street
- Flood 9/10 Extreme FEMA zone X (shaded) · 98% chance over 30 yrs
- Wildfire 1/10 Low
- Heat 10/10 Extreme 7 d/yr ≥108°F today · 27 d/yr by 30 yrs out
- Wind 10/10 Extreme 99% chance of damaging wind over 30 yrs
- Air quality 2/10 Low 1 unhealthy d/yr today · 1 by 30 yrs out
Nearby sold comps map
Loading sold comps map…
Walkable amenities ~0.75 mi
Loading nearby amenities…
Taxation est. · year 1
- Rental income
- $25,026
- − Mortgage interest
- −$9,803
- − Property taxes
- −$5,190
- − Insurance
- −$1,672
- − Repairs & maintenance
- −$2,002
- − Management
- −$2,002
- − Depreciation
- −$5,091
- Taxable loss
- −$734
- Est. tax savings @ 24.0%
- +$176
- After-tax cash flow
- $2,072/yr
For passive investors: Depreciation is non-cash, so a rental often shows a tax loss while cash-flowing — sheltering income. Rental losses are passive: they offset passive income freely, and up to $25,000/yr can offset ordinary (W-2) income if you actively participate and your MAGI is under $100k (phasing out to $0 by $150k); unused losses carry forward. On sale, claimed depreciation is recaptured at up to 25%, and gains may owe capital-gains tax (a 1031 exchange can defer both). Figures are a year-1 estimate at your 24.0% rate — not tax advice; consult a CPA.
Schools (NCES district)
- District
- Dickinson ISD
- NCES district ID
- 4817070
- Math proficiency
- 39% ▼ -11.00%
- Reading proficiency
- 40% ▼ -2.00%
- Median HH income
- $61,318
- Composite
- 35.16/100
- National rank
- #5005
- State rank
- #366 of 826 in TX
Livability — San Leon
- Score
- 62/100
- State rank
- #899
- US rank
- #16159
Category grades
Schools grade is shown separately in the Schools card above.
Census & demographics
- Census place
- San Leon, TX
- County
- Galveston County · 357,330 people
- Metro
- Houston-The Woodlands-Sugar Land, TX
- Population (ZIP)
- 49,375
- Household income
- $89,111
- Rent vs Own
- Severe rent burden
- 869.0
Population outlook (Galveston County) Hauer SSP2
- Today (2025)
- 390,640 people
- By 2030
- 425,226 · +8.9%
- By 2040
- 493,765 · +26.4%
- By 2050
- 559,698 · +43.3%
- By 2075
- 719,260 · +84.1%
- By 2100
- 819,628 · +109.8%
Race, ethnicity, and origin ACS 2023
- Neighborhood character
- Diverse neighborhood (Simpson 0.64)
- Race & ethnicity
- White 47% Hispanic / Latino 37% Two or more races 19% Black 10% Asian 3%
- Hispanic origin (detail)
- Mexican 29% Puerto Rican 2%
- Common ancestry
- Italian 3% Romanian 2% Lithuanian 1%
- Foreign-born
- 13% · Canada, Vietnam
- Languages at home
- 73% English-only · Spanish 24% Vietnamese 1% Other Indo-European 1%
Political lean MEDSL · Galveston
- 2024 margin
- Strong R (+27.4) · D 35.7% · R 63.1% · Other 1.2%
- 2008→2024 swing
- -7.9pp toward R · 2008: -19.5pp · 2024: -27.4pp
- All cycles
- 2024: R+27.4 2020: R+22.6 2016: R+22.6 2012: R+26.9 2008: R+19.5
Not yet ingested
- Civics
- —
Market trends
- HPI YoY
- ▼ -109.46%
- Current HPI
- 258.0104
- Rent YoY
- ▼ -0.12%
- Metro
- Houston-The Woodlands-Sugar Land, TX
- State GDP YoY
- ▲ 3.95%
- F500 in state
- 110
Industry mix (Fortune 500 HQ in TX)
| Industry | F500 HQs | Revenue |
|---|---|---|
| Energy | 16 | $1,198B |
|
||
| Technology | 5 | $198B |
|
||
| Engineering / Construction | 4 | $72B |
|
||
| Energy Services | 3 | $60B |
|
||
| Utilities | 3 | $41B |
|
||
| Healthcare | 2 | $330B |
|
||
Price history
+105.9% since first listed10 events — show timeline
- 2026-03-30 Listed $175,000 HARMLS
- 2025-09-12 Sold (Public Records) — Public Records
- 2021-02-24 Sold (Public Records) — Public Records
- 2018-08-07 Sold (Public Records) — Public Records
- 2018-07-30 Sold (MLS) — HARMLS
- 2018-07-08 Pending — HARMLS
- 2018-06-28 Pending — HARMLS
- 2018-05-21 Listed $145,000 HARMLS
- 2005-02-26 Listing Removed — HARMLS
- 2004-08-07 Listed $85,000 HARMLS
Property tax history
+8.9%/yrLatest (2025): $5,190 · +6.0% YoY. Source: county tax records.
Cash-flow waterfall
monthlySold comps — $/sqft
last 12 mo · ≤1 miLoading sold comps…