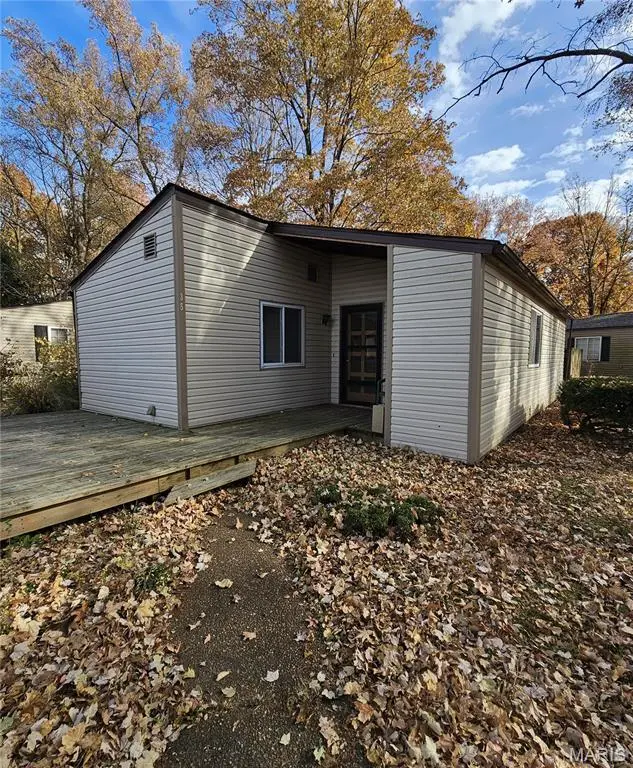
35 Lilac St · Glen Carbon, IL
Flood risk 1/10 · Minimal
- FEMA flood zone
- —
- Chance of flooding over 30 yrs
- 0.0%
- Est. flood insurance / yr
- —
Fire risk 1/10 · Minimal
- Est. fire insurance / yr
- $804 – $1,492
Heat risk 5/10 · Moderate
- Hot days now (above 107°F)
- 7 days/yr
- Hot days in 30 yrs
- 21 days/yr
Wind risk 2/10 · Minimal
- Chance of severe wind over 30 yrs
- 1.0%
Air-quality risk 3/10 · Minor
- Unhealthy air days now
- 2 days/yr
- Unhealthy air days in 30 yrs
- 4 days/yr
Risk factors via First Street. Map © Google.
Why this score? — see what drove the B- grade
The composite is a weighted blend of 9 inputs, each scored 0–100. Each bar is that input's sub-score; the figure is the points it added to the 100-point composite (weight × sub-score).
- Cash flow +30.0/30.0
- 1% rule +10.0/10.0
- DSCR +10.0/10.0
- ARV discount +7.5/15.0
- Livability +3.8/5.0
- Schools +3.5/10.0
- Rent growth +2.5/5.0
- Condition / age +2.5/5.0
- Appreciation +0.0/10.0
$80,000
🖨 Deal sheet 📄 Offer letter ✓ Due diligence
Listing remarks MLS
Come see this amazing 3bed 1bath home in an amazing community that is price to sell. Fresh paint, new windows and patio door. Pond view from the front deck. Home is being sold "As-Is"
Key facts
- Pond view
- Patio door
- Fresh paint
Tags
Neighborhood map
What this means for you Summary
Snapshot
- This is a 3-bed/1.0-bath single-family listed at $80k.
Deal economics
- At list price, monthly cash flow is $608 ($7k/yr) — positive.
- The deal already cash-flows at list — no discount required.
- Meets the 1% rule at list price ($2k rent vs $80k).
- Recommended offer: $73k (9.0% below list) — sets the bar for market timing.
- Cap rate 15.4% vs local median 2.1% in Glen Carbon — top-decile yield for the area; either an underpriced asset or a hidden risk that comps aren't pricing in. Stress-test before assuming the spread holds.
Location & tenants
- Location reads 75/100 on livability (#236 in IL, #4,344 nationally) — a middle-class / working-renter tenant base. Strengths: crime A+, employment A+, housing A+; Watch: amenities F, commute F, health & safety F.
- Edwardsville CUSD 7 (suburban): math 39% / reading 36% proficiency, ranked #142 of 620 in IL (top 23%) — families likely to look elsewhere, expect single-tenant / working-renter base with shorter leases; only 16% free/reduced lunch — higher-income household profile.
- Market conditions: 114 active listings in the ZIP; 3 comparable units currently listed for rent nearby; rentals at typical pace (median 22d on market — plan ~3-4 weeks tenant-placement turnaround); solid renter incomes; 336 units permitted in Madison County in 2024 (0 in 5+ unit buildings).
Forward outlook
- Local home prices are declining (-3.0%/yr); year-one equity from $553 of loan paydown is wiped out by about $2k of value loss. Plan a longer hold.
- Madison County population projected at -18% by 2050 — secular population decline; favor cash flow + early exit over multi-decade hold.
- At projected returns (-3.0% appreciation + 3.0% rent growth), your $22k cash investment doubles in ~4 years — after that, you're playing with house money.
Negotiation context
- It's been on market 104 days — a 9% lower offer ($73k) is reasonable based on typical stale-listing flexibility.
- 3 sale attempts; this cycle's ask has dropped $5k (6%) from the opening price — seller is motivated, your offer sets the floor, not the list.
Risks & watch-outs
- Climate carrying-cost: extreme-heat days projected 7→21/yr by 2055 (HVAC capex compounding) — expect insurance premiums to compound above CPI over the hold.
Questions for the listing agent
- It's been on market 104 days. Have you received any prior offers? Is the seller open to a 9% concession, seller financing, or rate buy-down credit?
- Built in 1973 — when were the roof, HVAC, electrical panel, plumbing, and water heater last replaced?
- What does the HOA fee cover, when was the last increase, and are there any pending special assessments or reserve-fund shortfalls?
- Why hasn't it sold? Are there any deal-killer items the seller is aware of (foundation, flood, title, zoning, code violations)?
- Is there a deadline driving the sale (1031 exchange, divorce, estate, relocation)? That informs how much negotiation room exists.
- Schools are B-rated — typically a magnet for longer-tenancy family renters. What's the average tenant stay here, and is there a school-zone premium baked into asking?
- What's the average days-on-market for RENTAL listings here right now (not sales)? A rising rental-DOM trend means longer vacancies and softer asking-rent achievability than the comps imply.
- What's the recent tenant-quality profile in this submarket — average credit score on applications, eviction rate, late-payment / NSF rate, and stable-employment percentage? A property-management company in the area should have these aggregated.
- How much new for-sale + rental construction is in the pipeline within 1–3 miles? Heavy new supply typically softens prices + rents 12–24 months out; constrained supply supports both.
Investment metrics
- 1% rule
- 1.98% ✓
- Cap rate
- 15.41%
- Cash-on-cash
- 32.56%
- DSCR
- 2.45
- GRM
- 4.2
CMA / ARV
- ARV (median comp)
- $197,025
- List price
- $80,000
- Delta
- -59.40%
- Verdict
- UNDERPRICED
- Comps
- 20 within 1.0 mi
Show comp detail 6 sales within ~0.75 mi
| Address | Dist | Beds/Ba | Sqft | Sold | Price | $/sf | Match |
|---|---|---|---|---|---|---|---|
| 41 Lilac St | 0.04mi | 3/1.0 | 1,008 (0%) | 3mo | $25,000 | $25 | 96 |
| 6 Wintergreen Dr | 0.10mi | 3/1.0 | 1,008 (0%) | 2mo | $120,000 | $119 | 93 |
| 39 Lilac St | 0.02mi | 3/1.0 | 1,008 (0%) | 14mo | $99,900 | $99 | 88 |
| 515 Trails Ridge Dr | 0.43mi | 3/2.0 | 912 (-10%) | 18mo | $174,000 | $191 | 45 |
| 18 Crabapple Ln | 0.73mi | 2/2.0 (-1) | 1,128 (+12%) | 5mo | $220,000 | $195 | 33 |
| 40 Depot Dr | 0.69mi | 3/2.5 | 1,144 (+14%) | 15mo | $265,000 | $232 | 27 |
Match score weights: distance 35% · size 25% · config 20% · recency 20%. Top-matched comps best support the ARV.
Projected returns pro-forma
-3.0% appreciation · 3.0% rent growth · sell at horizon
- IRR
- 27.7%
- Equity multiple
- 2.15×
- Total profit
- $25,823
- Equity at exit
- $11,928
- IRR
- 35.2%
- Equity multiple
- 4.24×
- Total profit
- $72,646
- Equity at exit
- $6,917
Cash invested: $22,400 (down + closing). Projections, not guarantees.
Landlord ↔ Tenant lean methodology
- Overall (STATE)
- 43 Moderately Tenant-Leaning
- State Illinois
- 43 Moderately Tenant-Leaning · D+7
- County
- — inherits STATE
- City
- — inherits STATE
ZIP-level market 62034
- Home prices YoY
- -13.7%
- Active inventory
- 114
- Price-to-rent
- 4.2×
Monthly cashflow live
- Estimated rent
- $1,581 medium interval (Pro) →
- Mortgage (P&I)
- −$420
- Tax from tax record
- −$129 /mo · $1,550/yr
- Insurance
- −$33
- HOA
- −$59
- Vacancy / Maint / Mgmt
- −$332
- Net cashflow
- $608
Break-even live
UW: 25.0% down · 7.5% · 30yr · 1.5% tax · 5.0% vac · 8.0% maint · 8.0% mgmt
Financing live
Cash to close
- Down payment
- $20,000
- Closing costs
- $2,400
- Reserves months
- —
- Total cash needed
- —
Loan-product check · same deal, 3 products live
Conventional
25% down · 7.5% · 30yr
- Down + closing
- —
- Monthly P&I
- —
- Monthly cashflow
- —
- DSCR
- —
- Eligible?
- —
Personal DTI + credit; lowest rate.
DSCR
20% down · 8.5% · 30yr
- Down + closing
- —
- Monthly P&I
- —
- Monthly cashflow
- —
- DSCR
- —
- Eligible?
- —
No personal income docs; deal must DSCR.
Hard money
10% down · 12.0% · 12mo
- Down + closing
- —
- Monthly P&I
- —
- Monthly cashflow
- —
- DSCR
- —
- Eligible?
- —
Short-term bridge; refi at stabilization.
Rent comps 3 comps
| Address | Beds | Baths | Sqft | Rent | $/sqft | DOM | Units | Dist |
|---|---|---|---|---|---|---|---|---|
| 80 Village Ct Glen Carbon, IL | 3.0 | 2.0 | 850 | $1,550 | $1.82 | 1d | 1 | 0.09mi |
| 2 Berry Patch Ln Glen Carbon, IL | 2.0 | 2.0 | 1328 | $1,950 | $1.47 | 23d | 1 | 0.71mi |
| 18 Crabapple Ln Glen Carbon, IL | 2.0 | 2.0 | 1200 | $1,950 | $1.62 | 21d | 1 | 0.71mi |
HOA detail
- Monthly dues
- $59 · $708/yr
Listing history 6 events
-
2026-05-04status Active 193-char remark
Show marketing remark (193 chars)
Come see this amazing 3bed 1bath home in an amazing community that is price to sell. Fresh paint, new windows and patio door. Pond view from the front deck. Home is being sold "As-Is"
-
2026-05-04price $80,000 193-char remark
Show marketing remark (193 chars)
Come see this amazing 3bed 1bath home in an amazing community that is price to sell. Fresh paint, new windows and patio door. Pond view from the front deck. Home is being sold "As-Is"
-
2026-03-08status Pending 193-char remark
Show marketing remark (193 chars)
Come see this amazing 3bed 1bath home in an amazing community that is price to sell. Fresh paint, new windows and patio door. Pond view from the front deck. Home is being sold "As-Is"
-
2026-02-12status Active 193-char remark
Show marketing remark (193 chars)
Come see this amazing 3bed 1bath home in an amazing community that is price to sell. Fresh paint, new windows and patio door. Pond view from the front deck. Home is being sold "As-Is"
-
2026-01-19status Pending 193-char remark
Show marketing remark (193 chars)
Come see this amazing 3bed 1bath home in an amazing community that is price to sell. Fresh paint, new windows and patio door. Pond view from the front deck. Home is being sold "As-Is"
-
2025-11-25$85,000 Active 193-char remark
Show marketing remark (193 chars)
Come see this amazing 3bed 1bath home in an amazing community that is price to sell. Fresh paint, new windows and patio door. Pond view from the front deck. Home is being sold "As-Is"
ⓘ Source: listings_history table (triggers on properties + properties_extension) + one-shot
backfill from property_details.listing_events for pre-trigger history.
Tax reassessment forecast IL · Partial reset (capped growth)
- Current annual tax
- $1,550 · $129/mo
- Projected year-2 tax
- $1,683 · $140/mo
- Expected delta
- +$133/yr (+$11/mo · 8.6%)
ⓘ Screening estimate from a state-policy table — verify with the county assessor before closing.
Climate risk First Street
- Flood 1/10 Low 0% chance over 30 yrs
- Wildfire 1/10 Low
- Heat 5/10 Major 7 d/yr ≥107°F today · 21 d/yr by 30 yrs out
- Wind 2/10 Low 100% chance of damaging wind over 30 yrs
- Air quality 3/10 Moderate 2 unhealthy d/yr today · 4 by 30 yrs out
Nearby sold comps map
Loading sold comps map…
Walkable amenities ~0.75 mi
Loading nearby amenities…
Taxation est. · year 1
- Rental income
- $18,969
- − Mortgage interest
- −$4,481
- − Property taxes
- −$1,550
- − Insurance
- −$400
- − Repairs & maintenance
- −$1,518
- − Management
- −$1,518
- − HOA
- −$708
- − Depreciation
- −$2,327
- Taxable income
- $6,467
- Est. tax owed @ 24.0%
- −$1,552
- After-tax cash flow
- $5,741/yr
For passive investors: Depreciation is non-cash, so a rental often shows a tax loss while cash-flowing — sheltering income. Rental losses are passive: they offset passive income freely, and up to $25,000/yr can offset ordinary (W-2) income if you actively participate and your MAGI is under $100k (phasing out to $0 by $150k); unused losses carry forward. On sale, claimed depreciation is recaptured at up to 25%, and gains may owe capital-gains tax (a 1031 exchange can defer both). Figures are a year-1 estimate at your 24.0% rate — not tax advice; consult a CPA.
Schools (NCES district)
- District
- Edwardsville CUSD 7
- NCES district ID
- 1713530
- Math proficiency
- 39% ▼ -12.00%
- Reading proficiency
- 36% ▼ -17.00%
- Median HH income
- $72,131
- Composite
- 34.56/100
- National rank
- #5169
- State rank
- #142 of 620 in IL
Livability — Glen Carbon
- Score
- 75/100
- State rank
- #236
- US rank
- #4344
Category grades
Schools grade is shown separately in the Schools card above.
Census & demographics
- Census place
- Glen Carbon, IL
- County
- Madison County · 189,064 people
- City population
- 14,870
- Metro
- St. Louis, MO-IL
- Population (ZIP)
- 14,870
- Household income
- $101,260
- Rent vs Own
- Severe rent burden
- 153.0
Population outlook (Madison County) Hauer SSP2
- Today (2025)
- 258,371 people
- By 2030
- 251,523 · -2.7%
- By 2040
- 233,640 · -9.6%
- By 2050
- 213,042 · -17.5%
- By 2075
- 165,255 · -36.0%
- By 2100
- 123,953 · -52.0%
Race, ethnicity, and origin ACS 2023
- Neighborhood character
- Predominantly White (83%)
- Race & ethnicity
- White 83% Black 8% Two or more races 5% Hispanic / Latino 4%
- Common ancestry
- Romanian 4% Lithuanian 4% Italian 3%
- Foreign-born
- 2% · Canada, China
- Languages at home
- 97% English-only · Spanish 1%
Political lean MEDSL · Madison
- 2024 margin
- R (+13.3) · D 42.5% · R 55.8% · Other 1.8%
- 2008→2024 swing
- -22.5pp toward R · 2008: 9.2pp · 2024: -13.3pp
- All cycles
- 2024: R+13.3 2020: R+13.2 2016: R+15.6 2012: R+1.4 2008: D+9.2
Not yet ingested
- Civics
- —
Market trends
- HPI YoY
- ▼ -37.33%
- Current HPI
- 235.3221
- Rent YoY
- —
- Metro
- St. Louis, MO-IL
- State GDP YoY
- ▲ 1.59%
- F500 in state
- 60
Industry mix (Fortune 500 HQ in IL)
| Industry | F500 HQs | Revenue |
|---|---|---|
| Insurance | 4 | $201B |
|
||
| Consumer Goods | 4 | $87B |
|
||
| Industrial Machinery | 3 | $64B |
|
||
| Healthcare | 2 | $55B |
|
||
| Retail / Pharmacy | 1 | $148B |
|
||
| Agriculture / Food | 1 | $86B |
|
||
Price history
-5.9% since first listed6 events — show timeline
- 2026-05-04 Relisted — MARIS as Distributed by MLS Grid
- 2026-05-04 Price Changed $80,000 MARIS as Distributed by MLS Grid
- 2026-03-08 Pending — MARIS as Distributed by MLS Grid
- 2026-02-12 Relisted — MARIS as Distributed by MLS Grid
- 2026-01-19 Pending — MARIS as Distributed by MLS Grid
- 2025-11-25 Listed $85,000 MARIS as Distributed by MLS Grid
Property tax history
+8.2%/yrLatest (2024): $1,550 · +4.9% YoY. Source: county tax records.
Cash-flow waterfall
monthlySold comps — $/sqft
last 12 mo · ≤1 miLoading sold comps…