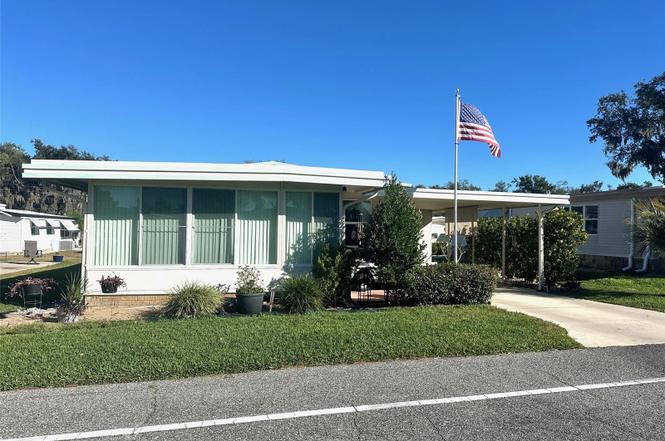
428 Palo Verde Dr · Leesburg, FL
Flood risk 1/10 · Minimal
- FEMA flood zone
- X (unshaded)
- Chance of flooding over 30 yrs
- 0.0%
- Est. flood insurance / yr
- $507 – $1,088
Fire risk 3/10 · Minor
- Est. fire insurance / yr
- $947 – $1,759
Heat risk 8/10 · Major
- Hot days now (above 108°F)
- 7 days/yr
- Hot days in 30 yrs
- 22 days/yr
Wind risk 9/10 · Severe
- Chance of severe wind over 30 yrs
- 99.0%
Air-quality risk 2/10 · Minimal
- Unhealthy air days now
- 1 days/yr
- Unhealthy air days in 30 yrs
- 1 days/yr
Risk factors via First Street. Map © Google.
Why this score? — see what drove the C grade
The composite is a weighted blend of 9 inputs, each scored 0–100. Each bar is that input's sub-score; the figure is the points it added to the 100-point composite (weight × sub-score).
- Cash flow +20.6/30.0
- 1% rule +10.0/10.0
- ARV discount +7.5/15.0
- DSCR +6.5/10.0
- Schools +4.2/10.0
- Livability +3.1/5.0
- Condition / age +2.5/5.0
- Rent growth +2.3/5.0
- Appreciation +0.0/10.0
$90,000
🖨 Deal sheet 📄 Offer letter ✓ Due diligence
Listing remarks
Tired of the cold weather and snow?? NOW is the time to move! Welcome to easy, carefree, sunshine living in this well-maintained 2 bedroom, 2 bath mobile home located in a desirable 55+ gated community packed with amenities. This home has seen several recent updates, including new double-pane insulated windows, a recently seal-coated roof, and new vinyl plank flooring throughout most of the home, giving it a fresh, modern feel. The oversized main suite offers a comfortable retreat with a private en suite featuring a step-in tiled shower. A spacious Florida Room adds extra living space—perfect for relaxing, entertaining, or enjoying your morning coffee. For added peace of mind, the hom
Key facts
- Gated community
- Florida room
- Impressive amenities
Tags
Property features AI
Finance
- Other: Partially furnished; Irrigation equipment; Lot approximately 0.1 acres (concrete road access)
- Financial info: Total annual fees $4,764; Total monthly fees $397; Taxes paid annually (2025): $893
- HOA & community: Has HOA (monthly fee $397); Association fee required; Senior community; Pets allowed; Association contact: Samantha Malik
Exterior
- Parking: Carport with 1 space
- Utilities: Cable connected; Electricity connected; Water connected; Water source: None; Sewer: Other
- Home design: Residential mobile home (double wide); One level; Faces west; Entry on main level
- Construction: Metal siding; Metal roof; Pillar/Post/Pier foundation; Building area estimated at 1,000 sq ft
- Exterior features: Rain gutters; Storage
Interior
- Kitchen: Microwave; Range; Range hood; Refrigerator; Eat-in kitchen
- Bedrooms: 2 bedrooms
- Flooring: Vinyl; Approximately 864 sq ft living area (public records)
- Bathrooms: 2 full bathrooms
- Heating & cooling: Central heating; Central air conditioning
- Interior features: Ceiling fans; Eat-in kitchen; Thermostat; Window treatments
- Laundry & utility: Washer; Dryer; Electric water heater; Laundry: Other
Neighborhood map
What this means for you Summary
Snapshot
- This is a 2-bed/2.0-bath condo listed at $90k.
Deal economics
- At list price, monthly cash flow is $120 ($1k/yr) — positive.
- The deal already cash-flows at list — no discount required.
- Meets the 1% rule at list price ($1k rent vs $90k).
- Recommended offer: $79k (12.0% below list) — sets the bar for market timing.
- Cap rate 7.9% vs local median 4.5% in Leesburg — top-decile yield for the area; either an underpriced asset or a hidden risk that comps aren't pricing in. Stress-test before assuming the spread holds.
Location & tenants
- Location reads 62/100 on livability (#751 in FL) — a middle-class / working-renter tenant base. Strengths: cost of living A+, housing A+; Watch: crime D, amenities F, commute F.
- Lake (suburban): math 49% / reading 50% proficiency, ranked #37 of 73 in FL (top 51%) — families likely to look elsewhere, expect single-tenant / working-renter base with shorter leases.
- Zoned schools: Leesburg Elementary School (math 31% / reading 32%, grade F, #1,841 of 2,144 statewide, top 86%, 822 students, 71% FRL); Leesburg High School (math 24% / reading 32%, grade F, #464 of 667 statewide, top 70%, 1,641 students, 58% FRL) — zoned schools average 64% FRL vs 49% district-wide (15 pts higher); higher-poverty schools than district average — tighter screening recommended.
- Zoned-school proficiency averages 30% at this address vs 50% district-wide (-20 pts) — the specific schools serving this property underperform the Lake average; the district grade overstates school quality for this exact location.
- Market conditions: Rents soft (-0.9%/yr); 783 active listings in the ZIP; 4,799 units permitted in Lake County in 2024 (814 in 5+ unit buildings).
Forward outlook
- Local home prices are declining (-3.0%/yr); year-one equity from $622 of loan paydown is wiped out by about $3k of value loss. Plan a longer hold.
- Lake County population projected at +37% by 2050 — long-run rental-demand tailwind backs the buy-and-hold thesis.
Negotiation context
- It's been on market 139 days — a 12% lower offer ($79k) is reasonable based on typical stale-listing flexibility.
Risks & watch-outs
- Watch-outs: HOA is 29% of rent.
- Climate carrying-cost: severe wind risk, 99% chance of damaging wind over 30y; extreme-heat days projected 7→22/yr by 2055 (HVAC capex compounding) — expect insurance premiums to compound above CPI over the hold.
Questions for the listing agent
- It's been on market 139 days. Have you received any prior offers? Is the seller open to a 12% concession, seller financing, or rate buy-down credit?
- Built in 1974 — when were the roof, HVAC, electrical panel, plumbing, and water heater last replaced?
- What does the HOA fee cover, when was the last increase, and are there any pending special assessments or reserve-fund shortfalls?
- Any open or pending special assessments — roof, HVAC, plumbing, elevator, façade? What's the per-unit balance and payoff schedule, and is the seller paying it off at close or rolling it to the buyer?
- Why hasn't it sold? Are there any deal-killer items the seller is aware of (foundation, flood, title, zoning, code violations)?
- Is there a deadline driving the sale (1031 exchange, divorce, estate, relocation)? That informs how much negotiation room exists.
- Schools are D-rated, which usually means shorter tenancies and higher turnover. Who's the typical renter profile here, and what's been the actual vacancy rate?
- Crime grade is D in this area — have there been break-ins, vandalism, or insurance claims at this property in the last 3 years? What carrier currently insures it and at what premium?
- What's the average days-on-market for RENTAL listings here right now (not sales)? A rising rental-DOM trend means longer vacancies and softer asking-rent achievability than the comps imply.
- What's the recent tenant-quality profile in this submarket — average credit score on applications, eviction rate, late-payment / NSF rate, and stable-employment percentage? A property-management company in the area should have these aggregated.
- How much new apartment / multifamily construction is in the pipeline within 1–3 miles? Heavy new supply (>2% of stock underway) typically softens rents 12–24 months out; light construction supports rent growth.
Investment metrics
- 1% rule
- 1.55% ✓
- Cap rate
- 7.89%
- Cash-on-cash
- 5.69%
- DSCR
- 1.25
- GRM
- 5.4
CMA / ARV
No comps found within radius.
Projected returns pro-forma
-3.0% appreciation · 0.0% rent growth · sell at horizon
- IRR
- -12.4%
- Equity multiple
- 0.57×
- Total profit
- $-10,809
- Equity at exit
- $13,419
- IRR
- -12.1%
- Equity multiple
- 0.43×
- Total profit
- $-14,401
- Equity at exit
- $7,782
Cash invested: $25,200 (down + closing). Projections, not guarantees.
Landlord ↔ Tenant lean methodology
- Overall (STATE)
- 87 Strongly Landlord-Friendly
- State Florida
- 87 Strongly Landlord-Friendly · R+3
- County
- — inherits STATE
- City
- — inherits STATE
ZIP-level market 34748
- Home prices YoY
- -25.3%
- Rents YoY
- -0.9%
- Active inventory
- 783
- Price-to-rent
- 5.4×
Monthly cashflow live
- Estimated rent
- $1,393 medium interval (Pro) →
- Mortgage (P&I)
- −$472
- Tax from tax record
- −$74 /mo · $893/yr
- Insurance
- −$38
- HOA
- −$397
- Vacancy / Maint / Mgmt
- −$293
- Net cashflow
- $120
Break-even live
UW: 25.0% down · 7.5% · 30yr · 1.5% tax · 5.0% vac · 8.0% maint · 8.0% mgmt
Financing live
Cash to close
- Down payment
- $22,500
- Closing costs
- $2,700
- Reserves months
- —
- Total cash needed
- —
Loan-product check · same deal, 3 products live
Conventional
25% down · 7.5% · 30yr
- Down + closing
- —
- Monthly P&I
- —
- Monthly cashflow
- —
- DSCR
- —
- Eligible?
- —
Personal DTI + credit; lowest rate.
DSCR
20% down · 8.5% · 30yr
- Down + closing
- —
- Monthly P&I
- —
- Monthly cashflow
- —
- DSCR
- —
- Eligible?
- —
No personal income docs; deal must DSCR.
Hard money
10% down · 12.0% · 12mo
- Down + closing
- —
- Monthly P&I
- —
- Monthly cashflow
- —
- DSCR
- —
- Eligible?
- —
Short-term bridge; refi at stabilization.
HOA detail condo
- Monthly dues
- $397 · $4,764/yr
- Likely covers
- security
- Assessments
- None detected in remarks — confirm with the listing agent.
Listing history 15 events
-
2026-06-18days on market $90,000 Active 139 DOM
-
2026-06-17days on market $90,000 Active 138 DOM
-
2026-06-16days on market $90,000 Active 137 DOM
-
2026-06-15days on market $90,000 Active 136 DOM
-
2026-06-13days on market $90,000 Active 134 DOM
-
2026-06-09days on market $90,000 Active 130 DOM
-
2026-06-08days on market $90,000 Active 129 DOM
-
2026-06-07days on market $90,000 Active 128 DOM
-
2026-06-04days on market $90,000 Active 125 DOM
-
2026-06-03days on market $90,000 Active 124 DOM
-
2026-06-02days on market $90,000 Active 123 DOM
-
2026-06-02days on market $90,000 Active 122 DOM
-
2026-05-31days on market $90,000 Active 121 DOM
-
2026-04-14price $90,000
-
2026-01-30$98,900 Active
ⓘ Source: listings_history table (triggers on properties + properties_extension) + one-shot
backfill from property_details.listing_events for pre-trigger history.
Tax reassessment forecast FL · Resets to sale price
- Current annual tax
- $893 · $74/mo
- Projected year-2 tax
- $893 · $74/mo
- Expected delta
- $0/yr ($0/mo · 0.0%)
ⓘ Screening estimate from a state-policy table — verify with the county assessor before closing.
Climate risk First Street
- Flood 1/10 Low FEMA zone X (unshaded) · 0% chance over 30 yrs
- Wildfire 3/10 Moderate
- Heat 8/10 Severe 7 d/yr ≥108°F today · 22 d/yr by 30 yrs out
- Wind 9/10 Extreme 99% chance of damaging wind over 30 yrs
- Air quality 2/10 Low 1 unhealthy d/yr today · 1 by 30 yrs out
Nearby sold comps map
Loading sold comps map…
Walkable amenities ~0.75 mi
Loading nearby amenities…
Taxation est. · year 1
- Rental income
- $16,716
- − Mortgage interest
- −$5,041
- − Property taxes
- −$893
- − Insurance
- −$450
- − Repairs & maintenance
- −$1,337
- − Management
- −$1,337
- − HOA
- −$4,764
- − Depreciation
- −$2,618
- Taxable income
- $275
- Est. tax owed @ 24.0%
- −$66
- After-tax cash flow
- $1,369/yr
For passive investors: Depreciation is non-cash, so a rental often shows a tax loss while cash-flowing — sheltering income. Rental losses are passive: they offset passive income freely, and up to $25,000/yr can offset ordinary (W-2) income if you actively participate and your MAGI is under $100k (phasing out to $0 by $150k); unused losses carry forward. On sale, claimed depreciation is recaptured at up to 25%, and gains may owe capital-gains tax (a 1031 exchange can defer both). Figures are a year-1 estimate at your 24.0% rate — not tax advice; consult a CPA.
Schools (NCES district)
- District
- Lake
- NCES district ID
- 1201050
- Math proficiency
- 49% ▼ -7.00%
- Reading proficiency
- 50% ▼ -4.00%
- Median HH income
- $46,632
- Composite
- 42.05/100
- National rank
- #3327
- State rank
- #37 of 73 in FL
Livability — Leesburg
- Score
- 62/100
- State rank
- #751
- US rank
- #16429
Category grades
Schools grade is shown separately in the Schools card above.
Census & demographics
- County
- Lake County · 364,602 people
- City population
- 70,232
- Metro
- Orlando-Kissimmee-Sanford, FL
- Population (ZIP)
- 48,095
- Household income
- $58,192
- Rent vs Own
- Severe rent burden
- 1745.0
Population outlook (Lake County) Hauer SSP2
- Today (2025)
- 386,640 people
- By 2030
- 417,107 · +7.9%
- By 2040
- 476,676 · +23.3%
- By 2050
- 531,296 · +37.4%
- By 2075
- 648,303 · +67.7%
- By 2100
- 698,530 · +80.7%
Race, ethnicity, and origin ACS 2023
- Neighborhood character
- Majority White (64%)
- Race & ethnicity
- White 64% Black 16% Hispanic / Latino 15% Two or more races 9% Asian 1%
- Hispanic origin (detail)
- Mexican 4% Puerto Rican 5% Cuban 3%
- Common ancestry
- Romanian 3% Lithuanian 3% Slovak 2%
- Foreign-born
- 9% · Canada, Vietnam, Jamaica
- Languages at home
- 88% English-only · Spanish 10% French/Haitian/Cajun 1%
Political lean MEDSL · Lake
- 2024 margin
- Strong R (+24.7) · D 37.3% · R 62.0%
- 2008→2024 swing
- -11.2pp toward R · 2008: -13.5pp · 2024: -24.7pp
- All cycles
- 2024: R+24.7 2020: R+20.0 2016: R+23.1 2012: R+17.1 2008: R+13.5
Not yet ingested
- Civics
- —
Market trends
- HPI YoY
- ▼ -88.97%
- Current HPI
- 262.1766
- Rent YoY
- ▼ -0.95%
- Metro
- Orlando-Kissimmee-Sanford, FL
- State GDP YoY
- ▲ 3.28%
- F500 in state
- 36
Industry mix (Fortune 500 HQ in FL)
| Industry | F500 HQs | Revenue |
|---|---|---|
| Industrial Technology | 2 | $29B |
|
||
| Insurance | 2 | $17B |
|
||
| Retail | 1 | $60B |
|
||
| Technology Distribution | 1 | $58B |
|
||
| Homebuilding | 1 | $35B |
|
||
| Technology Manufacturing | 1 | $35B |
|
||
Price history
-9.0% since first listed2 events — show timeline
- 2026-04-14 Price Changed $90,000 Stellar MLS as Distributed by MLS Grid
- 2026-01-30 Listed $98,900 Stellar MLS as Distributed by MLS Grid
Property tax history
+14.1%/yrLatest (2025): $893 · +3.8% YoY. Source: county tax records.
Cash-flow waterfall
monthlySold comps — $/sqft
last 12 mo · ≤1 miLoading sold comps…