14519 Sandalfoot St · Houston, TX
Flood risk 4/10 · Minor
- FEMA flood zone
- X (unshaded)
- Chance of flooding over 30 yrs
- 0.2%
- Est. flood insurance / yr
- $507 – $1,088
Fire risk 1/10 · Minimal
- Est. fire insurance / yr
- $1,222 – $2,270
Heat risk 9/10 · Severe
- Hot days now (above 110°F)
- 7 days/yr
- Hot days in 30 yrs
- 21 days/yr
Wind risk 8/10 · Major
- Chance of severe wind over 30 yrs
- 99.0%
Air-quality risk 3/10 · Minor
- Unhealthy air days now
- 2 days/yr
- Unhealthy air days in 30 yrs
- 3 days/yr
Risk factors via First Street. Map © Google.
Why this score? — see what drove the D grade
The composite is a weighted blend of 9 inputs, each scored 0–100. Each bar is that input's sub-score; the figure is the points it added to the 100-point composite (weight × sub-score).
- ARV discount +14.0/15.0
- Cash flow +5.7/30.0
- Appreciation +4.5/10.0
- Schools +4.4/10.0
- Livability +3.7/5.0
- Rent growth +3.0/5.0
- 1% rule +2.6/10.0
- Condition / age +2.5/5.0
- DSCR +0.1/10.0
$275,000
🖨 Deal sheet (PDF) 📄 Offer letter ✓ Due diligence
Listing remarks MLS
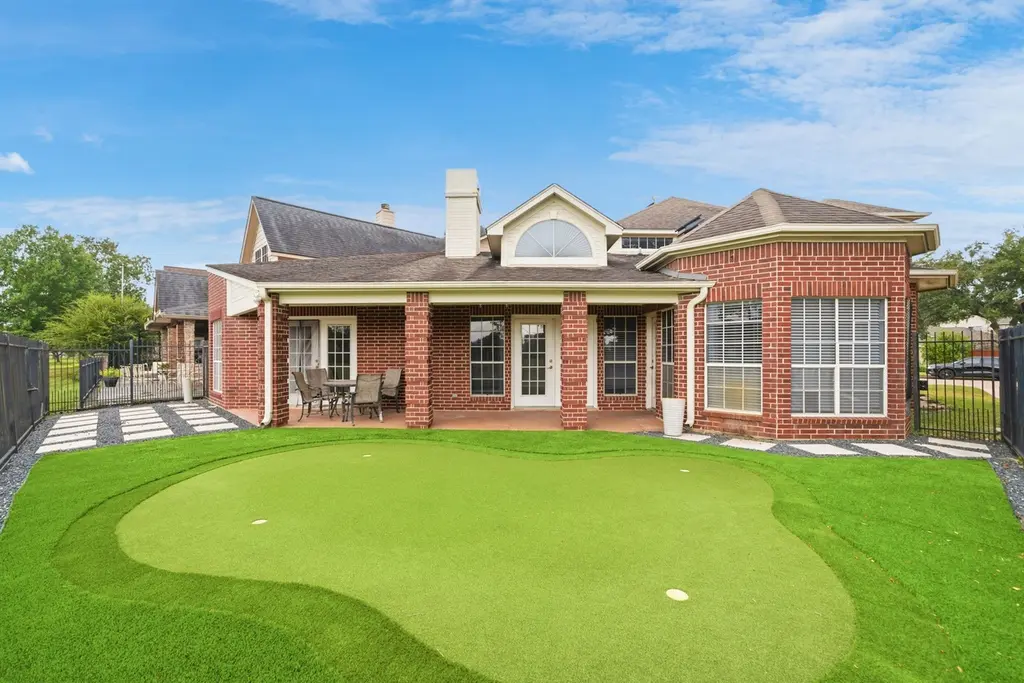
Beautiful home on Hearthstone Golf Course. Recent updates include: New AC units and furnaces, attic insulation, solar attic fans, new dishwasher, new oven, backyard landscaping installation. Welcome home!!
Key facts
- Solar attic fans
- New ac units
- New furnaces
Tags
Neighborhood map
What this means for you Summary
Snapshot
- This is a 3-bed/2.5-bath single-family listed at $275k.
Deal economics
- At list price, monthly cash flow is $-566 ($-7k/yr) — negative.
- To cash-flow at today's rent, offer at most $175k (36.4% below list).
- To meet the 1% rule (rent ≥ 1% of price), the offer needs to be $210k (23.7% below list).
- Recommended offer: $175k (36.4% below list) — sets the bar for cash-flow.
- Cap rate 3.8% vs local median 3.1% in Houston — meaningfully above typical; check what's discounted (condition, days-on-market, listing class) to confirm the premium yield is real.
Location & tenants
- Location reads 74/100 on livability (#184 in TX, #4,771 nationally) — a middle-class / working-renter tenant base. Strengths: amenities A+, cost of living A+, housing A+; Watch: schools D, crime F.
- Cypress-Fairbanks ISD (suburban): math 45% / reading 52% proficiency, ranked #161 of 826 in TX (top 20%) — families likely to look elsewhere, expect single-tenant / working-renter base with shorter leases.
- Market conditions: Rents rising (+2.1%/yr); 330 active listings in the ZIP; 18 comparable units currently listed for rent nearby; rentals leasing fast (median 12d on market — plan ~1-2 weeks tenant-placement turnaround); solid renter incomes; 29,883 units permitted in Harris County in 2024 (8,621 in 5+ unit buildings).
Forward outlook
- Local home prices are declining (-0.9%/yr); year-one equity from $2k of loan paydown is wiped out by about $3k of value loss. Plan a longer hold.
- Harris County population projected at +47% by 2050 — long-run rental-demand tailwind backs the buy-and-hold thesis.
Negotiation context
- It's been on market 106 days — a 9% lower offer ($250k) is reasonable based on typical stale-listing flexibility.
- 8 sale attempts since 20y ago; this cycle's ask has dropped $30k (10%) from the opening price — seller is motivated, your offer sets the floor, not the list.
- Current owner paid $133k; list at $275k implies a 107% gain — meaningful room to come down on a strong offer.
Risks & watch-outs
- Watch-outs: property tax is 2.7% of price.
- Climate carrying-cost: severe wind risk, 99% chance of damaging wind over 30y; extreme-heat days projected 7→21/yr by 2055 (HVAC capex compounding) — expect insurance premiums to compound above CPI over the hold.
Questions for the listing agent
- What do current leases actually rent for vs. the listed asking? Can we see a recent rent roll and the last 12 months of T-12 income?
- It's been on market 106 days. Have you received any prior offers? Is the seller open to a 36% concession, seller financing, or rate buy-down credit?
- Property tax is high relative to price — has the assessment been appealed recently, and will the sale trigger a re-assessment?
- What does the HOA fee cover, when was the last increase, and are there any pending special assessments or reserve-fund shortfalls?
- Why hasn't it sold? Are there any deal-killer items the seller is aware of (foundation, flood, title, zoning, code violations)?
- Is there a deadline driving the sale (1031 exchange, divorce, estate, relocation)? That informs how much negotiation room exists.
- Schools are D-rated, which usually means shorter tenancies and higher turnover. Who's the typical renter profile here, and what's been the actual vacancy rate?
- Crime grade is F in this area — have there been break-ins, vandalism, or insurance claims at this property in the last 3 years? What carrier currently insures it and at what premium?
- The area grade is low — what's the realistic commute time and amenity access for the typical tenant pool here? Any planned neighborhood developments (good or bad) we should know about?
- What's the average days-on-market for RENTAL listings here right now (not sales)? A rising rental-DOM trend means longer vacancies and softer asking-rent achievability than the comps imply.
- What's the recent tenant-quality profile in this submarket — average credit score on applications, eviction rate, late-payment / NSF rate, and stable-employment percentage? A property-management company in the area should have these aggregated.
- How much new for-sale + rental construction is in the pipeline within 1–3 miles? Heavy new supply typically softens prices + rents 12–24 months out; constrained supply supports both.
Investment metrics
- 1% rule
- 0.76% ✗
- Cap rate
- 3.82%
- Cash-on-cash
- -8.82%
- DSCR
- 0.61
- GRM
- 10.9
CMA / ARV
- ARV (median comp)
- $321,111
- List price
- $275,000
- Delta
- -14.36%
- Verdict
- UNDERPRICED
- Comps
- 20 within 1.0 mi
Show comp detail 12 sales within ~0.75 mi
| Address | Dist | Beds/Ba | Sqft | Sold | Price | $/sf | Match |
|---|---|---|---|---|---|---|---|
| 8003 Oceanside Dr | 0.05mi | 3/2.5 | 2,127 (-3%) | 1mo | $299,000 | $141 | 92 |
| 14203 Sandalfoot St | 0.21mi | 4/2.5 (+1) | 2,358 (+8%) | 8mo | $380,000 | $161 | 66 |
| 7614 Virginia Water Ln | 0.42mi | 3/2.0 | 2,359 (+8%) | 4mo | $320,000 | $136 | 63 |
| 7823 Autumn Hollow Ln | 0.47mi | 4/2.5 (+1) | 2,310 (+5%) | 3mo | $364,900 | $158 | 62 |
| 8506 Willancy Ln | 0.51mi | 4/2.0 (+1) | 2,113 (-4%) | 3mo | $299,000 | $142 | 61 |
| 7203 W Hearthstone Green Dr | 0.73mi | 3/2.0 | 2,270 (+4%) | 4mo | $300,000 | $132 | 55 |
| 7306 Creek Crest Dr | 0.66mi | 4/2.0 (+1) | 2,285 (+4%) | 6mo | $315,000 | $138 | 50 |
| 7406 Bull Creek Rd | 0.72mi | 3/2.0 | 1,997 (-9%) | 3mo | $339,999 | $170 | 47 |
| 15131 New Hastings Dr | 0.63mi | 3/2.5 | 2,490 (+14%) | 3mo | $309,500 | $124 | 46 |
| 7238 N Hearthstone Green Dr | 0.65mi | 3/2.0 | 1,911 (-13%) | 5mo | $280,000 | $147 | 42 |
| 7210 W Hearthstone Green Dr | 0.70mi | 3/2.5 | 2,447 (+12%) | 8mo | $342,500 | $140 | 41 |
| 7511 Weatherhill Ln | 0.75mi | 4/2.5 (+1) | 1,894 (-14%) | 3mo | $299,900 | $158 | 35 |
Match score weights: distance 35% · size 25% · config 20% · recency 20%. Top-matched comps best support the ARV.
Projected returns pro-forma
-0.94% appreciation · 2.1% rent growth · sell at horizon
- IRR
- -17.7%
- Equity multiple
- 0.25×
- Total profit
- $-57,731
- Equity at exit
- $67,102
- IRR
- -12.0%
- Equity multiple
- -0.04×
- Total profit
- $-80,244
- Equity at exit
- $71,078
Cash invested: $77,000 (down + closing). Projections, not guarantees.
Landlord ↔ Tenant lean methodology
- Overall (STATE)
- 87 Strongly Landlord-Friendly
- State Texas
- 87 Strongly Landlord-Friendly · R+5
- County
- — inherits STATE
- City
- — inherits STATE
ZIP-level market 77095
- Home prices YoY
- -0.4%
- Rents YoY
- 2.1%
- Active inventory
- 330
- Price-to-rent
- 10.9×
Monthly cashflow live
- Estimated rent
- $2,098 high interval (Pro) →
- Mortgage (P&I)
- −$1,442
- Tax from tax record
- −$616 /mo · $7,398/yr
- Insurance
- −$115
- HOA
- −$50
- Vacancy / Maint / Mgmt
- −$441
- Net cashflow
- $-566
Break-even live
Sensitivity live
| Price | -10% $-410 | -5% $-488 | +0% $-566 | +5% $-644 | +10% $-722 |
|---|---|---|---|---|---|
| Rent | -10% $-732 | -5% $-649 | +0% $-566 | +5% $-483 | +10% $-400 |
| Rate | -1.0pp $-428 | -0.5pp $-496 | base $-566 | +0.5pp $-637 | +1.0pp $-710 |
UW: 25.0% down · 7.5% · 30yr · 1.5% tax · 5.0% vac · 8.0% maint · 8.0% mgmt
Financing live
Cash to close
- Down payment
- $68,750
- Closing costs
- $8,250
- Reserves months
- —
- Total cash needed
- —
Loan-product check · same deal, 3 products live
Conventional
25% down · 7.5% · 30yr
- Down + closing
- —
- Monthly P&I
- —
- Monthly cashflow
- —
- DSCR
- —
- Eligible?
- —
Personal DTI + credit; lowest rate.
DSCR
20% down · 8.5% · 30yr
- Down + closing
- —
- Monthly P&I
- —
- Monthly cashflow
- —
- DSCR
- —
- Eligible?
- —
No personal income docs; deal must DSCR.
Hard money
10% down · 12.0% · 12mo
- Down + closing
- —
- Monthly P&I
- —
- Monthly cashflow
- —
- DSCR
- —
- Eligible?
- —
Short-term bridge; refi at stabilization.
Rent comps 18 comps
| Address | Beds | Baths | Sqft | Rent | $/sqft | DOM | Units | Dist |
|---|---|---|---|---|---|---|---|---|
| 14811 West Rd Unit 14844 Houston, TX | 3.0 | 2.0 | 1570 | $2,172 | $1.38 | 11d | 1 | 0.41mi |
| 14811 West Rd Unit 3148 Houston, TX | 3.0 | 2.0 | 1570 | $2,178 | $1.39 | 0d | 1 | 0.41mi |
| 8335 Columbia Forest Dr Houston, TX | 3.0 | 3.0 | 1767 | $2,000 | $1.13 | 44d | 1 | 0.43mi |
| 7451 Tunbury Ln Houston, TX | 4.0 | 2.5 | 2630 | $2,171 | $0.83 | 8d | 1 | 0.46mi |
| 14818 Chetland Place Dr Unit CHEP18-1 Houston, TX | 3.0 | 2.5 | 2490 | $2,100 | $0.84 | 44d | 1 | 0.47mi |
| 7331 Millbrae Ln Houston, TX | 4.0 | 2.0 | 2481 | $1,779 | $0.72 | 2d | 1 | 0.68mi |
| 7511 Stamen Dr Houston, TX | 3.0 | 2.5 | 1575 | $2,350 | $1.49 | 44d | 1 | 0.78mi |
| 8738 Willancy Ln Houston, TX | 4.0 | 3.0 | 2636 | $2,400 | $0.91 | 44d | 1 | 0.81mi |
| 9140 Highway 6 N Houston, TX | 1.0–3.0 | 1.0–3.0 | 1083 | $2,008 | $1.85 | 0d | 38 | 1.01mi |
| 7415 Broken Ridge Dr Houston, TX | 3.0 | 2.5 | 2416 | $2,245 | $0.93 | 44d | 1 | 1.10mi |
| 14623 Sanour Dr Houston, TX | 3.0 | 2.5 | 2032 | $2,170 | $1.07 | 6d | 1 | 1.12mi |
| 15255 Farm to Market Road 529 #525 Houston, TX | 3.0 | 2.0 | 1652 | $2,165 | $1.31 | 0d | 1 | 1.21mi |
| 15255 Farm to Market Road 529 #3174 Houston, TX | 3.0 | 2.0 | 1652 | $2,170 | $1.31 | 12d | 1 | 1.21mi |
| 15255 Farm to Market Road 529 #15288 Houston, TX | 3.0 | 2.0 | 1652 | $2,170 | $1.31 | 44d | 1 | 1.21mi |
| 6803 Hedgewick Dr Houston, TX | 4.0 | 2.5 | 2336 | $2,550 | $1.09 | 22d | 1 | 1.35mi |
| 15111 Falmouth Ave Houston, TX | 3.0 | 2.0 | 1674 | $1,850 | $1.11 | 44d | 1 | 1.44mi |
| 15050 Copper Grove Blvd Houston, TX | 1.0–3.0 | 1.0–2.5 | 1211 | $2,028 | $1.67 | 0d | 29 | 1.47mi |
| 15022 Mulberry Meadows Dr Houston, TX | 3.0 | 2.0 | 1832 | $1,905 | $1.04 | 0d | 1 | 1.48mi |
HOA detail
- Monthly dues
- $50 · $600/yr
- Likely covers
- landscaping
Listing history 42 events
-
2026-06-18days on market $275,000 Pending 106 DOM
-
2026-06-17days on market $275,000 Pending 105 DOM
-
2026-06-16days on market $275,000 Pending 104 DOM
-
2026-06-15days on market $275,000 Pending 103 DOM
-
2026-06-13days on market $275,000 Pending 101 DOM
-
2026-06-13statusdays on market $275,000 Pending 100 DOM
-
2026-06-09days on market $275,000 Active 97 DOM
-
2026-06-08days on market $275,000 Active 96 DOM
-
2026-06-07days on market $275,000 Active 95 DOM
-
2026-06-04days on market $275,000 Active 92 DOM
-
2026-06-03days on market $275,000 Active 91 DOM
-
2026-06-02days on market $275,000 Active 90 DOM
-
2026-06-02days on market $275,000 Active 89 DOM
-
2026-05-31days on market $275,000 Active 88 DOM
-
2026-05-19price $275,000 205-char remark
Show marketing remark (205 chars)
Beautiful home on Hearthstone Golf Course. Recent updates include: New AC units and furnaces, attic insulation, solar attic fans, new dishwasher, new oven, backyard landscaping installation. Welcome home!!
-
2026-05-01status Active 205-char remark
Show marketing remark (205 chars)
Beautiful home on Hearthstone Golf Course. Recent updates include: New AC units and furnaces, attic insulation, solar attic fans, new dishwasher, new oven, backyard landscaping installation. Welcome home!!
-
2026-04-24status Pending 205-char remark
Show marketing remark (205 chars)
Beautiful home on Hearthstone Golf Course. Recent updates include: New AC units and furnaces, attic insulation, solar attic fans, new dishwasher, new oven, backyard landscaping installation. Welcome home!!
-
2026-04-14price $285,000 205-char remark
Show marketing remark (205 chars)
Beautiful home on Hearthstone Golf Course. Recent updates include: New AC units and furnaces, attic insulation, solar attic fans, new dishwasher, new oven, backyard landscaping installation. Welcome home!!
-
2026-04-07price $295,000 205-char remark
Show marketing remark (205 chars)
Beautiful home on Hearthstone Golf Course. Recent updates include: New AC units and furnaces, attic insulation, solar attic fans, new dishwasher, new oven, backyard landscaping installation. Welcome home!!
-
2026-03-04$305,000 Active 205-char remark
Show marketing remark (205 chars)
Beautiful home on Hearthstone Golf Course. Recent updates include: New AC units and furnaces, attic insulation, solar attic fans, new dishwasher, new oven, backyard landscaping installation. Welcome home!!
-
2026-02-27historical
-
2026-01-23price $325,000
-
2025-12-02price $329,000
-
2025-11-19$335,000 Active
-
2021-10-01soldstatus Sold
-
2021-10-01soldstatus
-
2021-08-30status Pending, Continue to Show
-
2021-08-23status Active
-
2021-08-17status Option Pending
-
2021-07-28price $269,900
-
2021-06-20price $279,900
-
2021-06-19$269,999 Active
-
2009-05-15soldstatus
-
2009-05-06historical
-
2009-03-26$136,500
-
2009-02-06historical
-
2008-11-03$145,000
-
2007-01-25soldstatus
-
2006-07-13historical
-
2006-05-04$175,000
-
1997-06-26soldstatus
-
1993-05-01soldstatus $132,756
ⓘ Source: listings_history table (triggers on properties + properties_extension) + one-shot
backfill from property_details.listing_events for pre-trigger history.
Tax reassessment forecast TX · Resets to sale price
- Current annual tax
- $7,398 · $616/mo
- Projected year-2 tax
- $7,398 · $616/mo
- Expected delta
- $0/yr ($0/mo · 0.0%)
ⓘ Screening estimate from a state-policy table — verify with the county assessor before closing.
Climate risk First Street
- Flood 4/10 Moderate FEMA zone X (unshaded) · 20% chance over 30 yrs
- Wildfire 1/10 Low
- Heat 9/10 Extreme 7 d/yr ≥110°F today · 21 d/yr by 30 yrs out
- Wind 8/10 Severe 99% chance of damaging wind over 30 yrs
- Air quality 3/10 Moderate 2 unhealthy d/yr today · 3 by 30 yrs out
Nearby sold comps map
Loading sold comps map…
Walkable amenities ~0.75 mi
Loading nearby amenities…
Taxation est. · year 1
- Rental income
- $25,173
- − Mortgage interest
- −$15,404
- − Property taxes
- −$7,398
- − Insurance
- −$1,375
- − Repairs & maintenance
- −$2,014
- − Management
- −$2,014
- − HOA
- −$600
- − Depreciation
- −$8,000
- Taxable loss
- −$11,632
- Est. tax savings @ 24.0%
- +$2,792
- After-tax cash flow
- $-4,000/yr
For passive investors: Depreciation is non-cash, so a rental often shows a tax loss while cash-flowing — sheltering income. Rental losses are passive: they offset passive income freely, and up to $25,000/yr can offset ordinary (W-2) income if you actively participate and your MAGI is under $100k (phasing out to $0 by $150k); unused losses carry forward. On sale, claimed depreciation is recaptured at up to 25%, and gains may owe capital-gains tax (a 1031 exchange can defer both). Figures are a year-1 estimate at your 24.0% rate — not tax advice; consult a CPA.
Schools (NCES district)
- District
- Cypress-Fairbanks ISD
- NCES district ID
- 4816110
- Math proficiency
- 45% ▼ -12.00%
- Reading proficiency
- 52% ▼ -2.00%
- Median HH income
- $72,025
- Composite
- 43.63/100
- National rank
- #2968
- State rank
- #161 of 826 in TX
Livability — Houston
- Score
- 74/100
- State rank
- #184
- US rank
- #4771
Category grades
Schools grade is shown separately in the Schools card above.
Census & demographics
- County
- Harris County · 4,702,590 people
- City population
- 3,226,434
- Metro
- Houston-The Woodlands-Sugar Land, TX
- Population (ZIP)
- 69,767
- Household income
- $91,594
- Rent vs Own
- Severe rent burden
- 1870.0
Population outlook (Harris County) Hauer SSP2
- Today (2025)
- 5,571,493 people
- By 2030
- 6,089,821 · +9.3%
- By 2040
- 7,142,806 · +28.2%
- By 2050
- 8,185,864 · +46.9%
- By 2075
- 10,574,329 · +89.8%
- By 2100
- 12,109,958 · +117.4%
Race, ethnicity, and origin ACS 2023
- Neighborhood character
- Highly diverse neighborhood (Simpson 0.73)
- Race & ethnicity
- White 39% Hispanic / Latino 28% Two or more races 18% Black 16% Asian 12%
- Hispanic origin (detail)
- Mexican 16% Cuban 2%
- Common ancestry
- Italian 2% Romanian 2% Lithuanian 1%
- Foreign-born
- 25% · Canada, Vietnam, Jamaica
- Languages at home
- 66% English-only · Spanish 19% Vietnamese 5% Arabic 3%
Political lean MEDSL · Harris
- 2024 margin
- Lean D (+5.5) · D 52.0% · R 46.4% · Other 1.6%
- 2008→2024 swing
- +3.9pp toward D · 2008: 1.6pp · 2024: 5.5pp
- All cycles
- 2024: D+5.5 2020: D+13.3 2016: D+12.4 2012: D+0.1 2008: D+1.6
Not yet ingested
- Civics
- —
Market trends
- HPI YoY
- ▼ -0.94%
- Current HPI
- 236.0249
- Rent YoY
- ▲ 2.10%
- Metro
- Houston-The Woodlands-Sugar Land, TX
- State GDP YoY
- ▲ 3.95%
- F500 in state
- 110
Industry mix (Fortune 500 HQ in TX)
| Industry | F500 HQs | Revenue |
|---|---|---|
| Energy | 16 | $1,198B |
|
||
| Technology | 5 | $198B |
|
||
| Engineering / Construction | 4 | $72B |
|
||
| Energy Services | 3 | $60B |
|
||
| Utilities | 3 | $41B |
|
||
| Healthcare | 2 | $330B |
|
||
Price history
+107.1% since first listed28 events — show timeline
- 2026-05-19 Price Changed $275,000 HARMLS
- 2026-05-01 Relisted — HARMLS
- 2026-04-24 Pending — HARMLS
- 2026-04-14 Price Changed $285,000 HARMLS
- 2026-04-07 Price Changed $295,000 HARMLS
- 2026-03-04 Listed $305,000 HARMLS
- 2026-02-27 Listing Removed — HARMLS
- 2026-01-23 Price Changed $325,000 HARMLS
- 2025-12-02 Price Changed $329,000 HARMLS
- 2025-11-19 Listed $335,000 HARMLS
- 2021-10-01 Sold (Public Records) — Public Records
- 2021-10-01 Sold (MLS) — HARMLS
- 2021-08-30 Pending — HARMLS
- 2021-08-23 Relisted — HARMLS
- 2021-08-17 Pending — HARMLS
- 2021-07-28 Price Changed $269,900 HARMLS
- 2021-06-20 Price Changed $279,900 HARMLS
- 2021-06-19 Listed $269,999 HARMLS
- 2009-05-15 Sold (MLS) — HARMLS
- 2009-05-06 Listing Removed — HARMLS
- 2009-03-26 Listed $136,500 HARMLS
- 2009-02-06 Listing Removed — HARMLS
- 2008-11-03 Listed $145,000 HARMLS
- 2007-01-25 Sold (Public Records) — Public Records
- 2006-07-13 Listing Removed — HARMLS
- 2006-05-04 Listed $175,000 HARMLS
- 1997-06-26 Sold (Public Records) — Public Records
- 1993-05-01 Sold (Public Records) $132,756 Public Records
Property tax history
+3.4%/yrLatest (2025): $7,398 · +3.8% YoY. Source: county tax records.
Cash-flow waterfall
monthlySold comps — $/sqft
last 12 mo · ≤1 miLoading sold comps…