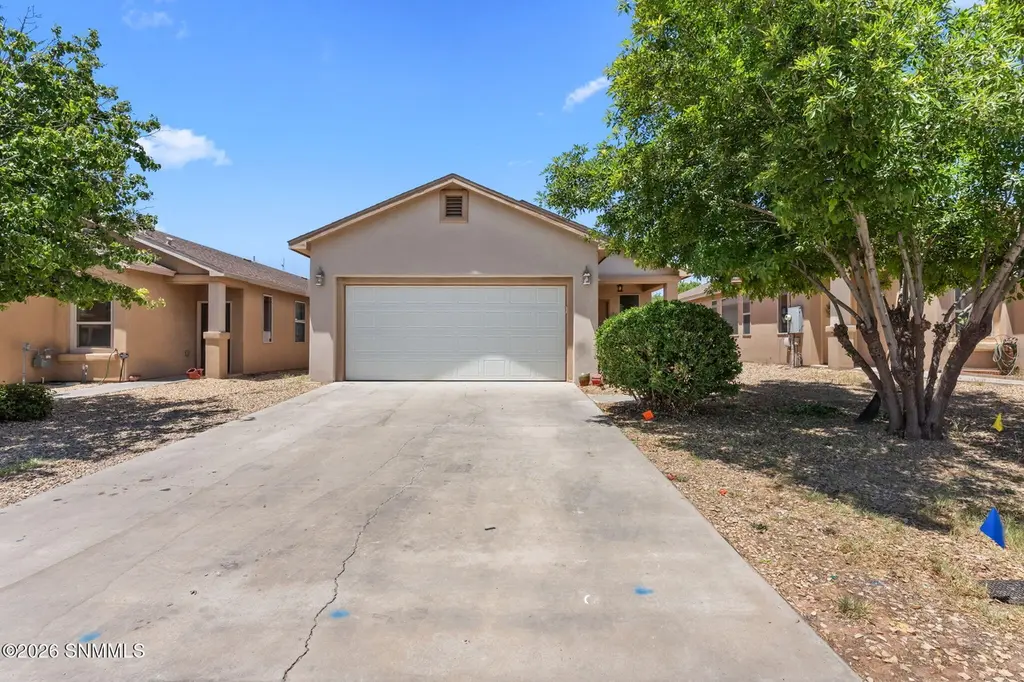
4939 Sherwood Rd · Las Cruces, NM
Flood risk 1/10 · Minimal
- FEMA flood zone
- X (unshaded)
- Chance of flooding over 30 yrs
- 0.0%
- Est. flood insurance / yr
- $507 – $1,088
Fire risk 5/10 · Moderate
- Est. fire insurance / yr
- $706 – $1,312
Heat risk 5/10 · Moderate
- Hot days now (above 98°F)
- 6 days/yr
- Hot days in 30 yrs
- 20 days/yr
Wind risk 1/10 · Minimal
- Chance of severe wind over 30 yrs
- —
Air-quality risk 1/10 · Minimal
- Unhealthy air days now
- 0 days/yr
- Unhealthy air days in 30 yrs
- 0 days/yr
Risk factors via First Street. Map © Google.
Why this score? — see what drove the D- grade
The composite is a weighted blend of 9 inputs, each scored 0–100. Each bar is that input's sub-score; the figure is the points it added to the 100-point composite (weight × sub-score).
- Cash flow +12.1/30.0
- ARV discount +7.5/15.0
- Schools +4.6/10.0
- DSCR +3.6/10.0
- Rent growth +3.4/5.0
- Livability +3.0/5.0
- 1% rule +2.5/10.0
- Condition / age +2.5/5.0
- Appreciation +0.0/10.0
$230,000
🖨 Deal sheet (PDF) 📄 Offer letter ✓ Due diligence
Listing remarks MLS
Very well maintained and ready for you! This 3 bedroom 2 bath home includes tile flooring throughout. Open kitchen with island, breakfast bar & all appliances. Washer, Dryer and water softener included. Great Price, location and won't last long! 2 car garage and fully landscaped front and backyard. Contact us for showing today. Great interest rates, programs and closing cost assistance available!
Key facts
- Refrigerated air
- Spacious kitchen
- Ample cabinet space
Tags
Property features AI
Finance
- Other: Directions: GPS
- Financial info: Details not provided
- HOA & community: Subdivision: Rincon Hills Phase 3
Exterior
- Parking: 2-car garage
- Security: Details not provided
- Utilities: Public water; Public sewer; Natural gas available
- Home design: Single-family residence; One level
- Construction: Frame and stucco construction; Shingle roof; Slab foundation; Built details not provided
- Exterior features: Covered patio/porch; Lot about 0.11 acre
Interior
- Kitchen: Dishwasher; Gas range; Microwave; Refrigerator
- Bedrooms: Details not provided
- Flooring: Details not provided
- Bathrooms: 2 full bathrooms
- Heating & cooling: Forced air heating; Central air conditioning
- Interior features: Kitchen island; Double pane windows; Low emissivity windows; Water softener (owned)
- Laundry & utility: Laundry in hall; Gas water heater
Neighborhood map
What this means for you Summary
Snapshot
- This is a 3-bed/2.0-bath single-family listed at $230k.
Deal economics
- At list price, monthly cash flow is $-51 ($-614/yr) — negative.
- To cash-flow at today's rent, offer at most $221k (3.9% below list).
- To meet the 1% rule (rent ≥ 1% of price), the offer needs to be $173k (24.8% below list).
- Recommended offer: $173k (24.8% below list) — sets the bar for 1% rule.
Location & tenants
- Location reads 59/100 on livability (#120 in NM) — a working-class tenant base; expect higher turnover. Strengths: cost of living A+, housing A; Watch: amenities D+, schools D-, crime F.
- Las Cruces Public Schools (urban): math 42% / reading 68% proficiency, ranked #5 of 29 in NM (top 17%) — acceptable for families but not a draw, mixed tenant base, ~2y average lease; 62% free/reduced lunch — lower-income household profile, screen leases tightly.
- Market conditions: Rents rising (+3.5%/yr); 591 active listings in the ZIP; 3 comparable units currently listed for rent nearby; rentals at typical pace (median 22d on market — plan ~3-4 weeks tenant-placement turnaround); 964 units permitted in Doña Ana County in 2024 (0 in 5+ unit buildings).
- This rent runs 30% of the median local income ($69k/yr) — at the standard rent-burdened threshold; future hikes will face affordability resistance.
Forward outlook
- Local home prices are declining (-3.0%/yr); year-one equity from $2k of loan paydown is wiped out by about $7k of value loss. Plan a longer hold.
Negotiation context
- Only 5 days on market — expect competitive offers; lowballing is unlikely to land.
- 2 sale attempts since 10y ago with the ask held roughly flat each time — persistent listings suggest the price (not the market) is what's stuck; bring a comps-based counter.
Risks & watch-outs
- Climate carrying-cost: moderate wildfire risk; extreme-heat days projected 6→20/yr by 2055 (HVAC capex compounding) — expect insurance premiums to compound above CPI over the hold.
Questions for the listing agent
- What do current leases actually rent for vs. the listed asking? Can we see a recent rent roll and the last 12 months of T-12 income?
- Is there a deadline driving the sale (1031 exchange, divorce, estate, relocation)? That informs how much negotiation room exists.
- Schools are D-rated, which usually means shorter tenancies and higher turnover. Who's the typical renter profile here, and what's been the actual vacancy rate?
- Crime grade is F in this area — have there been break-ins, vandalism, or insurance claims at this property in the last 3 years? What carrier currently insures it and at what premium?
- The area grade is low — what's the realistic commute time and amenity access for the typical tenant pool here? Any planned neighborhood developments (good or bad) we should know about?
- What's the average days-on-market for RENTAL listings here right now (not sales)? A rising rental-DOM trend means longer vacancies and softer asking-rent achievability than the comps imply.
- What's the recent tenant-quality profile in this submarket — average credit score on applications, eviction rate, late-payment / NSF rate, and stable-employment percentage? A property-management company in the area should have these aggregated.
- How much new for-sale + rental construction is in the pipeline within 1–3 miles? Heavy new supply typically softens prices + rents 12–24 months out; constrained supply supports both.
Investment metrics
- 1% rule
- 0.75% ✗
- Cap rate
- 6.03%
- Cash-on-cash
- -0.95%
- DSCR
- 0.96
- GRM
- 11.1
CMA / ARV
No comps found within radius.
Projected returns pro-forma
-3.0% appreciation · 3.52% rent growth · sell at horizon
- IRR
- -17.4%
- Equity multiple
- 0.38×
- Total profit
- $-39,698
- Equity at exit
- $34,294
- IRR
- -8.6%
- Equity multiple
- 0.45×
- Total profit
- $-35,312
- Equity at exit
- $19,886
Cash invested: $64,400 (down + closing). Projections, not guarantees.
Landlord ↔ Tenant lean methodology
- Overall (STATE)
- 55 Moderately Landlord-Leaning
- State New Mexico
- 55 Moderately Landlord-Leaning · D+3
- County
- — inherits STATE
- City
- — inherits STATE
ZIP-level market 88012
- Home prices YoY
- -26.2%
- Rents YoY
- 3.5%
- Active inventory
- 591
- Price-to-rent
- 11.1×
Monthly cashflow live
- Estimated rent
- $1,731 medium interval (Pro) →
- Mortgage (P&I)
- −$1,206
- Tax from tax record
- −$116 /mo · $1,396/yr
- Insurance
- −$96
- HOA
- −$0
- Vacancy / Maint / Mgmt
- −$363
- Net cashflow
- $-51
Break-even live
Sensitivity live
| Price | -10% $79 | -5% $14 | +0% $-51 | +5% $-116 | +10% $-181 |
|---|---|---|---|---|---|
| Rent | -10% $-188 | -5% $-120 | +0% $-51 | +5% $17 | +10% $86 |
| Rate | -1.0pp $65 | -0.5pp $7 | base $-51 | +0.5pp $-111 | +1.0pp $-171 |
UW: 25.0% down · 7.5% · 30yr · 1.5% tax · 5.0% vac · 8.0% maint · 8.0% mgmt
Financing live
Cash to close
- Down payment
- $57,500
- Closing costs
- $6,900
- Reserves months
- —
- Total cash needed
- —
Loan-product check · same deal, 3 products live
Conventional
25% down · 7.5% · 30yr
- Down + closing
- —
- Monthly P&I
- —
- Monthly cashflow
- —
- DSCR
- —
- Eligible?
- —
Personal DTI + credit; lowest rate.
DSCR
20% down · 8.5% · 30yr
- Down + closing
- —
- Monthly P&I
- —
- Monthly cashflow
- —
- DSCR
- —
- Eligible?
- —
No personal income docs; deal must DSCR.
Hard money
10% down · 12.0% · 12mo
- Down + closing
- —
- Monthly P&I
- —
- Monthly cashflow
- —
- DSCR
- —
- Eligible?
- —
Short-term bridge; refi at stabilization.
Rent comps 3 comps
| Address | Beds | Baths | Sqft | Rent | $/sqft | DOM | Units | Dist |
|---|---|---|---|---|---|---|---|---|
| 4942 Sherwood Rd Las Cruces, NM | 3.0 | 2.0 | 1376 | $1,625 | $1.18 | 14d | 1 | 0.02mi |
| 4950 Ortega Rd Las Cruces, NM | 3.0 | 2.0 | 1035 | $1,475 | $1.43 | 22d | 1 | 0.03mi |
| 5095 Kensington Way Las Cruces, NM | 2.0 | 2.0 | 1002 | $1,525 | $1.52 | 44d | 1 | 0.31mi |
Listing history 4 events
-
2026-06-08status $230,000 Pending 5 DOM
-
2026-06-07days on market $230,000 Active 5 DOM
-
2026-06-03remarks 489-char remark
-
2026-06-03$230,000 Active 1 DOM
ⓘ Source: listings_history table (triggers on properties + properties_extension) + one-shot
backfill from property_details.listing_events for pre-trigger history.
Tax reassessment forecast NM · Resets to sale price
- Current annual tax
- $1,396 · $116/mo
- Projected year-2 tax
- $1,840 · $153/mo
- Expected delta
- +$444/yr (+$37/mo · 31.8%)
ⓘ Screening estimate from a state-policy table — verify with the county assessor before closing.
Climate risk First Street
- Flood 1/10 Low FEMA zone X (unshaded) · 0% chance over 30 yrs
- Wildfire 5/10 Major
- Heat 5/10 Major 6 d/yr ≥98°F today · 20 d/yr by 30 yrs out
- Wind 1/10 Low
- Air quality 1/10 Low 0 unhealthy d/yr today · 0 by 30 yrs out
Nearby sold comps map
Loading sold comps map…
Walkable amenities ~0.75 mi
Loading nearby amenities…
Taxation est. · year 1
- Rental income
- $20,766
- − Mortgage interest
- −$12,884
- − Property taxes
- −$1,396
- − Insurance
- −$1,150
- − Repairs & maintenance
- −$1,661
- − Management
- −$1,661
- − Depreciation
- −$6,691
- Taxable loss
- −$4,676
- Est. tax savings @ 24.0%
- +$1,122
- After-tax cash flow
- $508/yr
For passive investors: Depreciation is non-cash, so a rental often shows a tax loss while cash-flowing — sheltering income. Rental losses are passive: they offset passive income freely, and up to $25,000/yr can offset ordinary (W-2) income if you actively participate and your MAGI is under $100k (phasing out to $0 by $150k); unused losses carry forward. On sale, claimed depreciation is recaptured at up to 25%, and gains may owe capital-gains tax (a 1031 exchange can defer both). Figures are a year-1 estimate at your 24.0% rate — not tax advice; consult a CPA.
Schools (NCES district)
- District
- Las Cruces Public Schools
- NCES district ID
- 3501500
- Math proficiency
- 42% ▲ 24.00%
- Reading proficiency
- 68% ▲ 35.00%
- Median HH income
- $41,157
- Composite
- 45.98/100
- National rank
- #2535
- State rank
- #5 of 29 in NM
Livability — Las Cruces
- Score
- 59/100
- State rank
- #120
- US rank
- #19687
Category grades
Schools grade is shown separately in the Schools card above.
Census & demographics
- Census place
- Las Cruces, NM
- County
- Dona Ana County · 144,044 people
- City population
- 131,421
- Metro
- Las Cruces, NM
- Population (ZIP)
- 33,158
- Household income
- $69,052
- Rent vs Own
- Severe rent burden
- 717.0
Population outlook (Doña Ana County) Hauer SSP2
- Today (2025)
- 219,177 people
- By 2030
- 220,967 · +0.8%
- By 2040
- 222,775 · +1.6%
- By 2050
- 223,576 · +2.0%
- By 2075
- 228,461 · +4.2%
- By 2100
- 214,536 · -2.1%
Race, ethnicity, and origin ACS 2023
- Neighborhood character
- Majority Hispanic (63%)
- Race & ethnicity
- Hispanic / Latino 63% White 32% Two or more races 25% Native American 2% Black 1% Asian 1%
- Hispanic origin (detail)
- Mexican 55%
- Common ancestry
- Slovak 2% Russian 1% Iranian 1%
- Foreign-born
- 10% · Canada, South Korea
- Languages at home
- 65% English-only · Spanish 33%
Political lean MEDSL · Doña Ana
- 2024 margin
- Lean D (+9.8) · D 53.8% · R 44.0% · Other 2.2%
- 2008→2024 swing
- -7.9pp toward R · 2008: 17.6pp · 2024: 9.8pp
- All cycles
- 2024: D+9.8 2020: D+18.3 2016: D+18.0 2012: D+14.9 2008: D+17.6
Not yet ingested
- Civics
- —
Market trends
- HPI YoY
- ▼ -66.04%
- Current HPI
- 185.7733
- Rent YoY
- ▲ 3.52%
- Metro
- Las Cruces, NM
- State GDP YoY
- —
- F500 in state
- 0
Price history
+84.1% since first listed4 events — show timeline
- 2026-06-02 Listed $230,000 SNMMLS as distributed by MLS GRID
- 2016-07-25 Sold (Public Records) — Public Records
- 2016-07-25 Sold (MLS) — SNMMLS as distributed by MLS GRID
- 2016-05-21 Listed $124,900 SNMMLS as distributed by MLS GRID
Property tax history
+2.8%/yrLatest (2025): $1,396 · +2.4% YoY. Source: county tax records.
Cash-flow waterfall
monthlySold comps — $/sqft
last 12 mo · ≤1 miLoading sold comps…