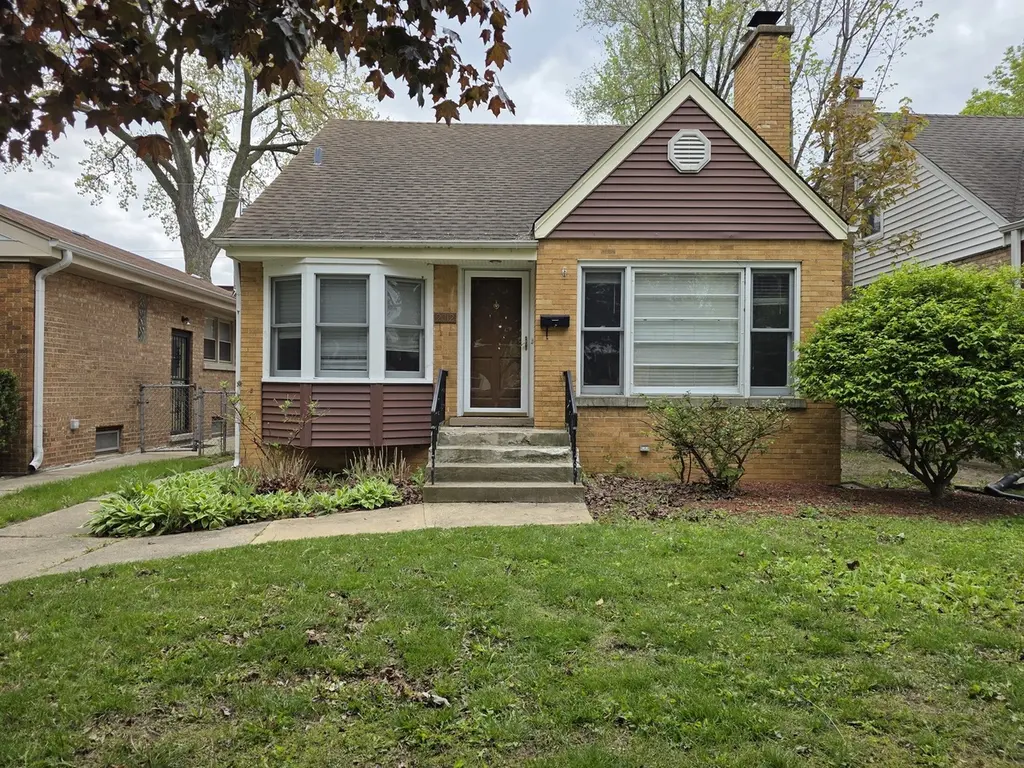
2012 Dobson St · Evanston, IL
Flood risk 4/10 · Minor
- FEMA flood zone
- X (unshaded)
- Chance of flooding over 30 yrs
- 0.22%
- Est. flood insurance / yr
- $507 – $1,088
Fire risk 1/10 · Minimal
- Est. fire insurance / yr
- $804 – $1,492
Heat risk 3/10 · Minor
- Hot days now (above 98°F)
- 7 days/yr
- Hot days in 30 yrs
- 14 days/yr
Wind risk 2/10 · Minimal
- Chance of severe wind over 30 yrs
- 0.0%
Air-quality risk 4/10 · Minor
- Unhealthy air days now
- 5 days/yr
- Unhealthy air days in 30 yrs
- 6 days/yr
Risk factors via First Street. Map © Google.
Why this score? — see what drove the C- grade
The composite is a weighted blend of 9 inputs, each scored 0–100. Each bar is that input's sub-score; the figure is the points it added to the 100-point composite (weight × sub-score).
- Cash flow +17.8/30.0
- ARV discount +7.5/15.0
- 1% rule +7.3/10.0
- DSCR +5.6/10.0
- Schools +4.5/10.0
- Livability +4.2/5.0
- Rent growth +3.6/5.0
- Condition / age +2.5/5.0
- Appreciation +0.0/10.0
$199,900
🖨 Deal sheet 📄 Offer letter ✓ Due diligence
Listing remarks MLS
Well maintained home located on a dead end street close to transp, shopping & parks. This home has an updated eat in kitchen, newer furnace, recent tear-off roof, fireplace, hardwood flrs, 2 1/2 car garage, 2 BR & full bth on 1st flr. Office space on 2nd floor plus bedroom 1/2 bath & walk-in closet. Basement offers a spacious recreation rm., utility room & storage. Hardwood floors & kitchen greenhouse window too!
Key facts
- 4,375 sq ft lot
- 2 garage spots
- Built 1951
Property features AI
Finance
- HOA & community: No master association fee required
Exterior
- Parking: Detached garage with garage door opener (2 garage spaces, 2 total parking spaces)
- Utilities: Public water; Public sewer
- Home design: Detached single-family home; 1.5-story design; Fee simple ownership
- Construction: Brick construction; Estimated age 71–80 years; Built before 1978
- Exterior features: Lot dimensions approximately 35 x 125; Lot smaller than 0.25 acre; Off-alley access
Interior
- Kitchen: Kitchen with eating area/table space (8 x 16) and ceramic tile flooring
- Bedrooms: Master bedroom on main level (11 x 11) with hardwood flooring; Second bedroom on main level (10 x 14) with hardwood flooring; Third bedroom on second level (13 x 13) with carpet
- Flooring: Hardwood flooring in primary areas; Carpet in some bedrooms and living areas; Ceramic tile in the kitchen
- Bathrooms: One full bathroom; One half bathroom
- Heating & cooling: Natural gas forced-air heating; Central air conditioning
- Interior features: Seven total rooms; Partially finished full basement; Wood-burning fireplace in the living room
- Laundry & utility: Dedicated laundry room
Neighborhood map
What this means for you Summary
Snapshot
- This is a 3-bed/1.5-bath single-family listed at $200k.
Deal economics
- At list price, monthly cash flow is $166 ($2k/yr) — positive.
- The deal already cash-flows at list — no discount required.
- Meets the 1% rule at list price ($2k rent vs $200k).
- Cap rate 7.3% vs local median 2.9% in Evanston — top-decile yield for the area; either an underpriced asset or a hidden risk that comps aren't pricing in. Stress-test before assuming the spread holds.
Location & tenants
- Location reads 85/100 on livability (#26 in IL, #464 nationally) — a professional / high-income tenant draw. Strengths: amenities A+, commute A+, employment A+; Watch: cost of living F.
- Evanston Twp Hsd 202 (urban): math 47% / reading 52% proficiency, ranked #54 of 620 in IL (top 9%) — families likely to look elsewhere, expect single-tenant / working-renter base with shorter leases.
- Zoned schools: Evanston Twp High School (math 47% / reading 52%, grade D, #44 of 693 statewide, top 7%, 3,691 students, 0% FRL).
- Market conditions: Rents rising fast (+4.3%/yr); 72 active listings in the ZIP; 27 comparable units currently listed for rent nearby; rentals at typical pace (median 22d on market — plan ~3-4 weeks tenant-placement turnaround); solid renter incomes; 6,272 units permitted in Cook County in 2024 (4,658 in 5+ unit buildings).
Forward outlook
- Local home prices are declining (-3.0%/yr); year-one equity from $1k of loan paydown is wiped out by about $6k of value loss. Plan a longer hold.
Negotiation context
- Only 4 days on market — expect competitive offers; lowballing is unlikely to land.
- 2 sale attempts since 13y ago with the ask held roughly flat each time — persistent listings suggest the price (not the market) is what's stuck; bring a comps-based counter.
Risks & watch-outs
- Watch-outs: property tax is 3.9% of price; built in 1951 — expect roof / HVAC / electrical / plumbing capex.
Questions for the listing agent
- Built in 1951 — when were the roof, HVAC, electrical panel, plumbing, and water heater last replaced?
- Property tax is high relative to price — has the assessment been appealed recently, and will the sale trigger a re-assessment?
- Is there a deadline driving the sale (1031 exchange, divorce, estate, relocation)? That informs how much negotiation room exists.
- Schools are A-rated — typically a magnet for longer-tenancy family renters. What's the average tenant stay here, and is there a school-zone premium baked into asking?
- What's the average days-on-market for RENTAL listings here right now (not sales)? A rising rental-DOM trend means longer vacancies and softer asking-rent achievability than the comps imply.
- What's the recent tenant-quality profile in this submarket — average credit score on applications, eviction rate, late-payment / NSF rate, and stable-employment percentage? A property-management company in the area should have these aggregated.
- How much new for-sale + rental construction is in the pipeline within 1–3 miles? Heavy new supply typically softens prices + rents 12–24 months out; constrained supply supports both.
Investment metrics
- 1% rule
- 1.23% ✓
- Cap rate
- 7.29%
- Cash-on-cash
- 3.56%
- DSCR
- 1.16
- GRM
- 6.8
CMA / ARV
- ARV (on-the-fly)
- $440,250
- Comps found
- 9
Show comp detail 9 sales within ~0.75 mi
| Address | Dist | Beds/Ba | Sqft | Sold | Price | $/sf | Match |
|---|---|---|---|---|---|---|---|
| 2012 Dobson St | 0.00mi | 3/1.5 | 1,174 (0%) | 1mo | $302,100 | $257 | 99 |
| 2109 Dobson St | 0.05mi | 3/2.0 | 1,181 (+1%) | 1mo | $540,000 | $457 | 94 |
| 3030 W Jarvis Ave | 0.36mi | 3/2.5 | 1,224 (+4%) | 16mo | $530,000 | $433 | 59 |
| 7323 N California Ave | 0.39mi | 4/2.0 (+1) | 1,200 (+2%) | 15mo | $450,000 | $375 | 59 |
| 309 Darrow Ave | 0.31mi | 2/1.0 (-1) | 1,059 (-10%) | 7mo | $382,000 | $361 | 56 |
| 301 Darrow Ave | 0.30mi | 3/2.0 | 1,300 (+11%) | 19mo | $485,000 | $373 | 50 |
| 1923 Warren St | 0.54mi | 3/1.5 | 1,329 (+13%) | 10mo | $599,900 | $451 | 44 |
| 2716 W Fitch Ave | 0.62mi | 3/2.0 | 1,083 (-8%) | 14mo | $490,000 | $452 | 44 |
| 1407 Oakton St | 0.69mi | 4/2.0 (+1) | 1,239 (+6%) | 20mo | $342,500 | $276 | 35 |
Match score weights: distance 35% · size 25% · config 20% · recency 20%. Top-matched comps best support the ARV.
Projected returns pro-forma
-3.0% appreciation · 4.35% rent growth · sell at horizon
- IRR
- -8.7%
- Equity multiple
- 0.68×
- Total profit
- $-18,147
- Equity at exit
- $29,806
- IRR
- 3.0%
- Equity multiple
- 1.24×
- Total profit
- $13,246
- Equity at exit
- $17,284
Cash invested: $55,972 (down + closing). Projections, not guarantees.
Landlord ↔ Tenant lean methodology
- Overall (STATE)
- 43 Moderately Tenant-Leaning
- State Illinois
- 43 Moderately Tenant-Leaning · D+7
- County
- — inherits STATE
- City
- — inherits STATE
ZIP-level market 60202
- Rents YoY
- 4.3%
- Active inventory
- 72
- Price-to-rent
- 6.8×
Monthly cashflow live
- Estimated rent
- $2,461 high interval (Pro) →
- Mortgage (P&I)
- −$1,048
- Tax from tax record
- −$646 /mo · $7,756/yr
- Insurance
- −$83
- HOA
- −$0
- Vacancy / Maint / Mgmt
- −$517
- Net cashflow
- $166
Break-even live
UW: 25.0% down · 7.5% · 30yr · 1.5% tax · 5.0% vac · 8.0% maint · 8.0% mgmt
Financing live
Cash to close
- Down payment
- $49,975
- Closing costs
- $5,997
- Reserves months
- —
- Total cash needed
- —
Loan-product check · same deal, 3 products live
Conventional
25% down · 7.5% · 30yr
- Down + closing
- —
- Monthly P&I
- —
- Monthly cashflow
- —
- DSCR
- —
- Eligible?
- —
Personal DTI + credit; lowest rate.
DSCR
20% down · 8.5% · 30yr
- Down + closing
- —
- Monthly P&I
- —
- Monthly cashflow
- —
- DSCR
- —
- Eligible?
- —
No personal income docs; deal must DSCR.
Hard money
10% down · 12.0% · 12mo
- Down + closing
- —
- Monthly P&I
- —
- Monthly cashflow
- —
- DSCR
- —
- Eligible?
- —
Short-term bridge; refi at stabilization.
Rent comps 27 comps
| Address | Beds | Baths | Sqft | Rent | $/sqft | DOM | Units | Dist |
|---|---|---|---|---|---|---|---|---|
| 2113 Seward St Evanston, IL | 2.0 | 1.0 | 864 | $3,400 | $3.94 | 21d | 1 | 0.67mi |
| 611 Wesley Ave Unit 1 Evanston, IL | 2.0 | 1.5 | 1200 | $2,750 | $2.29 | 24d | 1 | 0.76mi |
| 1605 Monroe St #4 Evanston, IL | 2.0 | 1.0 | 800 | $1,800 | $2.25 | 21d | 1 | 0.82mi |
| 336 Ridge Ave #2 Evanston, IL | 2.0 | 1.0 | 950 | $2,250 | $2.37 | 24d | 1 | 0.83mi |
| 243 Ridge Ave Evanston, IL | 2.0 | 1.0 | 1200 | $1,745 | $1.45 | 24d | 1 | 0.87mi |
| 730 Wesley Ave Unit 2 Evanston, IL | 2.0 | 1.0 | 1000 | $3,200 | $3.20 | 7d | 1 | 0.90mi |
| 419 Ridge Ave Unit L Evanston, IL | 2.0 | 1.0 | 1000 | $1,945 | $1.95 | 24d | 1 | 0.91mi |
| 647 Asbury Ave Unit 2 Evanston, IL | 2.0 | 2.0 | 1050 | $2,595 | $2.47 | 1d | 1 | 0.91mi |
| 1327 Washington St Unit 2 Evanston, IL | 2.0 | 1.0 | 1200 | $2,150 | $1.79 | 10d | 1 | 1.03mi |
| 940 Pitner Ave Unit 2 Evanston, IL | 2.0 | 1.0 | 1400 | $2,400 | $1.71 | 15d | 1 | 1.08mi |
| 940 Pitner Ave Unit 4 Evanston, IL | 2.0 | 1.0 | 1400 | $2,400 | $1.71 | 24d | 1 | 1.08mi |
| 609 Oakton St Unit 3A Evanston, IL | 3.0 | 2.0 | 1250 | $2,250 | $1.80 | 24d | 1 | 1.21mi |
| 907 Washington St Unit 1C Evanston, IL | 2.0 | 1.0 | 1000 | $1,745 | $1.75 | 7d | 1 | 1.24mi |
| 100 Chicago Ave Evanston, IL | 1.0–2.0 | 1.0–2.0 | 945 | $2,995 | $3.17 | 24d | 3 | 1.26mi |
| 415 W Howard St Evanston, IL | 2.0 | 2.0 | 1133 | $2,466 | $2.18 | 12d | 1 | 1.33mi |
| 740 Main St Evanston, IL | 2.0 | 2.0 | 596 | $3,550 | $5.95 | 24d | 28 | 1.37mi |
| 610 Hinman Ave Evanston, IL | 1.0–3.0 | 1.0–2.0 | 912 | $2,495 | $2.73 | 6d | 6 | 1.37mi |
| 539 Hinman Ave Evanston, IL | 2.0–3.0 | 1.0–2.0 | 1325 | $2,995 | $2.26 | 3d | 2 | 1.37mi |
| 555 Hinman Ave Evanston, IL | 2.0 | 1.0 | 1050 | $2,200 | $2.10 | 15d | 2 | 1.39mi |
| 605 Hinman Ave Unit 3M Evanston, IL | 3.0 | 2.0 | 1235 | $2,495 | $2.02 | 6d | 1 | 1.40mi |
| 605 Hinman Ave Unit 605-3M Evanston, IL | 3.0 | 2.0 | 1235 | $2,495 | $2.02 | 7d | 1 | 1.40mi |
| 704 Hinman Ave Evanston, IL | 1.0–2.0 | 1.0 | 850 | $1,785 | $2.10 | 24d | 1 | 1.42mi |
| 718 Hinman Ave Unit 18GD Evanston, IL | 2.0 | 1.0 | 1100 | $1,635 | $1.49 | 24d | 1 | 1.42mi |
| 718 Hinman Ave Unit 21N2 Evanston, IL | 2.0 | 1.0 | 1100 | $1,695 | $1.54 | 24d | 1 | 1.42mi |
| 718 Hinman Ave Unit 24E2 Evanston, IL | 2.0 | 1.0 | 1100 | $1,750 | $1.59 | 24d | 1 | 1.42mi |
| 847 Chicago Ave Evanston, IL | 3.0 | 1.0–2.0 | 962 | $5,088 | $5.29 | 1d | 12 | 1.48mi |
| 515 Main St #608 Evanston, IL | 2.0 | 2.0 | 1200 | $3,200 | $2.67 | 21d | 1 | 1.49mi |
Listing history 7 events
-
2026-05-13status Pending
-
2026-05-09$199,900 Active
-
2013-07-23soldstatus $225,000
-
2013-06-27soldstatus $225,000 Closed Sale 436-char remark
Show marketing remark (436 chars)
Well maintained home located on a dead end street close to transp, shopping & parks. This home has an updated eat in kitchen, newer furnace, recent tear-off roof, fireplace, hardwood flrs, 2 1/2 car garage, 2 BR & full bth on 1st flr. Office space on 2nd floor plus bedroom 1/2 bath & walk-in closet. Basement offers a spacious recreation rm., utility room & storage. Hardwood floors & kitchen greenhouse window too!
-
2013-05-24historical Contingent 436-char remark
Show marketing remark (436 chars)
Well maintained home located on a dead end street close to transp, shopping & parks. This home has an updated eat in kitchen, newer furnace, recent tear-off roof, fireplace, hardwood flrs, 2 1/2 car garage, 2 BR & full bth on 1st flr. Office space on 2nd floor plus bedroom 1/2 bath & walk-in closet. Basement offers a spacious recreation rm., utility room & storage. Hardwood floors & kitchen greenhouse window too!
-
2013-05-20$255,000 New 436-char remark
Show marketing remark (436 chars)
Well maintained home located on a dead end street close to transp, shopping & parks. This home has an updated eat in kitchen, newer furnace, recent tear-off roof, fireplace, hardwood flrs, 2 1/2 car garage, 2 BR & full bth on 1st flr. Office space on 2nd floor plus bedroom 1/2 bath & walk-in closet. Basement offers a spacious recreation rm., utility room & storage. Hardwood floors & kitchen greenhouse window too!
-
1999-09-23soldstatus $158,000
ⓘ Source: listings_history table (triggers on properties + properties_extension) + one-shot
backfill from property_details.listing_events for pre-trigger history.
Tax reassessment forecast IL · Partial reset (capped growth)
- Current annual tax
- $7,756 · $646/mo
- Projected year-2 tax
- $7,756 · $646/mo
- Expected delta
- $0/yr ($0/mo · 0.0%)
ⓘ Screening estimate from a state-policy table — verify with the county assessor before closing.
Climate risk First Street
- Flood 4/10 Moderate FEMA zone X (unshaded) · 22% chance over 30 yrs
- Wildfire 1/10 Low
- Heat 3/10 Moderate 7 d/yr ≥98°F today · 14 d/yr by 30 yrs out
- Wind 2/10 Low 0% chance of damaging wind over 30 yrs
- Air quality 4/10 Moderate 5 unhealthy d/yr today · 6 by 30 yrs out
Nearby sold comps map
Loading sold comps map…
Walkable amenities ~0.75 mi
Loading nearby amenities…
Taxation est. · year 1
- Rental income
- $29,529
- − Mortgage interest
- −$11,198
- − Property taxes
- −$7,756
- − Insurance
- −$1,000
- − Repairs & maintenance
- −$2,362
- − Management
- −$2,362
- − Depreciation
- −$5,815
- Taxable loss
- −$964
- Est. tax savings @ 24.0%
- +$231
- After-tax cash flow
- $2,224/yr
For passive investors: Depreciation is non-cash, so a rental often shows a tax loss while cash-flowing — sheltering income. Rental losses are passive: they offset passive income freely, and up to $25,000/yr can offset ordinary (W-2) income if you actively participate and your MAGI is under $100k (phasing out to $0 by $150k); unused losses carry forward. On sale, claimed depreciation is recaptured at up to 25%, and gains may owe capital-gains tax (a 1031 exchange can defer both). Figures are a year-1 estimate at your 24.0% rate — not tax advice; consult a CPA.
Schools (NCES district)
- District
- Evanston Twp Hsd 202
- NCES district ID
- 1714490
- Math proficiency
- 47% ▼ -3.00%
- Reading proficiency
- 52% ▬ 0.00%
- Median HH income
- $72,672
- Composite
- 44.52/100
- National rank
- #2794
- State rank
- #54 of 620 in IL
Livability — Evanston
- Score
- 85/100
- State rank
- #26
- US rank
- #464
Category grades
Schools grade is shown separately in the Schools card above.
Census & demographics
- Census place
- Evanston, IL
- County
- Cook County · 4,486,803 people
- City population
- 76,085
- Metro
- Chicago-Naperville-Elgin, IL-IN-WI
- Population (ZIP)
- 32,341
- Household income
- $98,989
- Rent vs Own
- Severe rent burden
- 784.0
Population outlook (Cook County) Hauer SSP2
- Today (2025)
- 5,347,519 people
- By 2030
- 5,357,703 · +0.2%
- By 2040
- 5,324,924 · -0.4%
- By 2050
- 5,230,762 · -2.2%
- By 2075
- 4,785,735 · -10.5%
- By 2100
- 4,188,836 · -21.7%
Race, ethnicity, and origin ACS 2023
- Neighborhood character
- Diverse neighborhood (Simpson 0.65)
- Race & ethnicity
- White 54% Black 18% Hispanic / Latino 14% Two or more races 11% Asian 8%
- Hispanic origin (detail)
- Mexican 8%
- Common ancestry
- Romanian 8% Scotch-Irish 2% Portuguese 2%
- Foreign-born
- 19% · Canada, Jamaica, Vietnam
- Languages at home
- 73% English-only · Spanish 11% Other Indo-European 3% Russian/Polish/Slavic 2%
Political lean MEDSL · Cook
- 2024 margin
- Solid D (+42.0) · D 70.4% · R 28.4% · Other 1.2%
- 2008→2024 swing
- -11.4pp toward R · 2008: 53.4pp · 2024: 42.0pp
- All cycles
- 2024: D+42.0 2020: D+50.3 2016: D+53.0 2012: D+49.4 2008: D+53.4
Not yet ingested
- Civics
- —
Market trends
- HPI YoY
- ▼ -245.25%
- Current HPI
- 172.9605
- Rent YoY
- ▲ 4.35%
- Metro
- Chicago-Naperville-Elgin, IL-IN-WI
- State GDP YoY
- ▲ 1.59%
- F500 in state
- 60
Industry mix (Fortune 500 HQ in IL)
| Industry | F500 HQs | Revenue |
|---|---|---|
| Insurance | 4 | $201B |
|
||
| Consumer Goods | 4 | $87B |
|
||
| Industrial Machinery | 3 | $64B |
|
||
| Healthcare | 2 | $55B |
|
||
| Retail / Pharmacy | 1 | $148B |
|
||
| Agriculture / Food | 1 | $86B |
|
||
Price history
+26.5% since first listed7 events — show timeline
- 2026-05-13 Pending — MRED as Distributed by MLS Grid
- 2026-05-09 Listed $199,900 MRED as Distributed by MLS Grid
- 2013-07-23 Sold (Public Records) $225,000 Public Records
- 2013-06-27 Sold (MLS) $225,000 MRED as Distributed by MLS Grid
- 2013-05-24 Contingent — MRED as Distributed by MLS Grid
- 2013-05-20 Listed $255,000 MRED as Distributed by MLS Grid
- 1999-09-23 Sold (Public Records) $158,000 Public Records
Property tax history
+5.5%/yrLatest (2023): $7,756 · -1.2% YoY. Source: county tax records.
Cash-flow waterfall
monthlySold comps — $/sqft
last 12 mo · ≤1 miLoading sold comps…