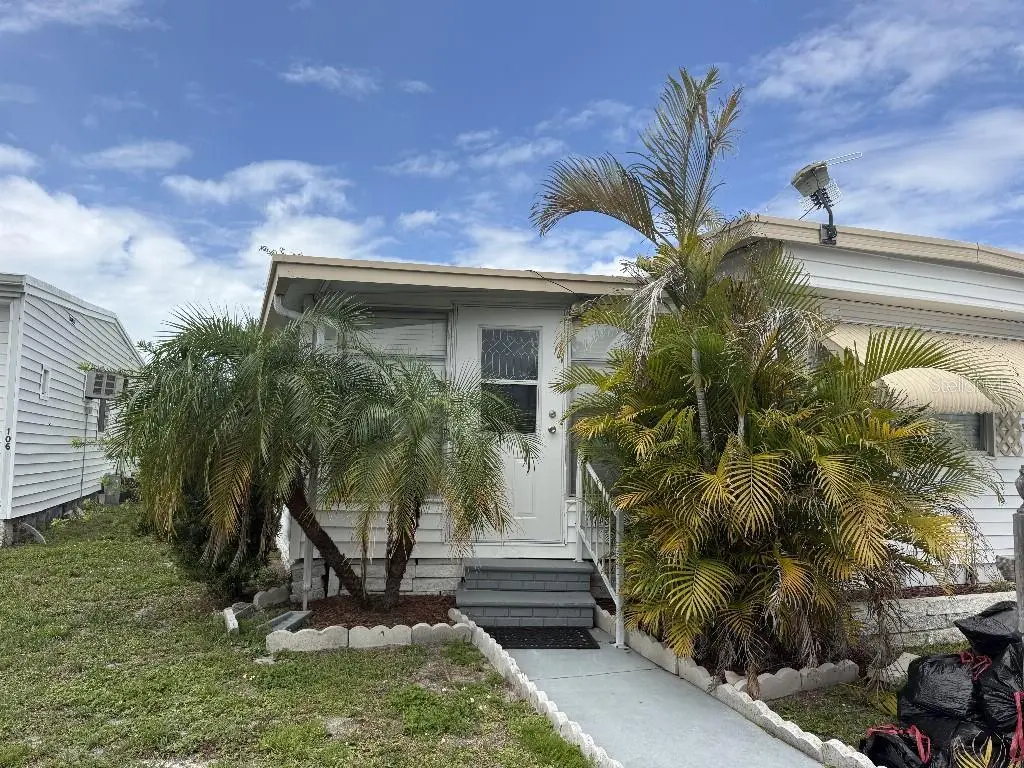
104 Dove Rd · Largo, FL
Flood risk 6/10 · Moderate
- FEMA flood zone
- X (unshaded)
- Chance of flooding over 30 yrs
- 0.66%
- Est. flood insurance / yr
- $507 – $1,088
Fire risk 1/10 · Minimal
- Est. fire insurance / yr
- $947 – $1,759
Heat risk 10/10 · Severe
- Hot days now (above 107°F)
- 6 days/yr
- Hot days in 30 yrs
- 22 days/yr
Wind risk 10/10 · Severe
- Chance of severe wind over 30 yrs
- 99.0%
Air-quality risk 3/10 · Minor
- Unhealthy air days now
- 3 days/yr
- Unhealthy air days in 30 yrs
- 3 days/yr
Risk factors via First Street. Map © Google.
Why this score? — see what drove the B- grade
The composite is a weighted blend of 9 inputs, each scored 0–100. Each bar is that input's sub-score; the figure is the points it added to the 100-point composite (weight × sub-score).
- Cash flow +30.0/30.0
- 1% rule +10.0/10.0
- DSCR +10.0/10.0
- ARV discount +7.5/15.0
- Schools +4.3/10.0
- Livability +4.1/5.0
- Condition / age +2.5/5.0
- Rent growth +1.2/5.0
- Appreciation +0.0/10.0
$65,000
🖨 Deal sheet 📄 Offer letter ✓ Due diligence
Listing remarks
1969, 12×40', 1 Bedrooms, 1 Bathroom + BONUS Bedroom or Den. 10×20' Porch, 6×10' Shed, Central HVAC & Heat, Ceiling Fans, Washer & Dryer, Fully Furnished, Roof Over, Vinyl Siding. Charming Clean, Bright and Sunny Unit. New Carport/Porch Siding
Key facts
- Central hvac
- 10x20 porch
- Washer and dryer
Tags
Property features AI
Finance
- Other: Turn right onto FL-686 then U.S. 19 Frontage Rd; inside Ranch Mobile Home Park (directions provided)
- Financial info: Total monthly fees $155; Total annual fees $1,860; Furnished
- HOA & community: HOA (Faith) with required monthly fee of $155; HOA amenities include pool, clubhouse, fitness center, laundry, park, tennis and basketball courts, racquetball, shuffleboard, spa/hot tub, recreation facilities; Association fee includes pool, grounds maintenance, recreational facilities, sewer, trash and water; Community features include sidewalks, street lights, no truck/RV/motorcycle parking, golf carts allowed, senior community; Pets not allowed
Exterior
- Parking: Covered parking; Driveway; Guest parking; 2-space carport
- Security: Fire alarm; Smoke detectors
- Utilities: Public water; Public sewer; Electricity connected; Cable available; Underground utilities; Water connected; Sewer connected
- Home design: Residential modular home; One story; Faces west; Slab foundation; Inside a mobile home park
- Construction: Metal frame construction; Vinyl siding; Metal roof; Built on slab
- Exterior features: Covered front porch; Side porch; Covered patio/porch; Dog run; Outdoor grill; Rain gutters; Storage shed(s); Tennis court(s); Other storage; Level lot; Trees and landscaped; Near public transit; Paved road
Interior
- Kitchen: Built-in oven; Range; Microwave; Refrigerator; Disposal; Electric water heater
- Bedrooms: 1 bedroom
- Flooring: Carpet; Laminate
- Bathrooms: 1 full bathroom
- Heating & cooling: Central heating; Space heater; Central air conditioning
- Interior features: Ceiling fans; Thermostat; Blinds; Shutters; Fire alarm; Smoke detectors
- Laundry & utility: Washer; Dryer; Laundry in garage
Neighborhood map
What this means for you Summary
Snapshot
- This is a 1-bed/1.0-bath manufactured listed at $65k.
Deal economics
- At list price, monthly cash flow is $730 ($9k/yr) — positive.
- The deal already cash-flows at list — no discount required.
- Meets the 1% rule at list price ($2k rent vs $65k).
- Recommended offer: $64k (1.5% below list) — sets the bar for market timing.
- Cap rate 19.8% vs local median 4.2% in Largo — top-decile yield for the area; either an underpriced asset or a hidden risk that comps aren't pricing in. Stress-test before assuming the spread holds.
Location & tenants
- Location reads 82/100 on livability (#82 in FL, #1,240 nationally) — a professional / high-income tenant draw. Strengths: commute A+, cost of living A+, housing A+; Watch: employment D+, amenities F.
- Pinellas (suburban): math 51% / reading 51% proficiency, ranked #31 of 73 in FL (top 42%) — acceptable for families but not a draw, mixed tenant base, ~2y average lease.
- Market conditions: Rents falling (-5.2%/yr); 261 active listings in the ZIP; 1 comparable units currently listed for rent nearby; 2,676 units permitted in Pinellas County in 2024 (1,422 in 5+ unit buildings).
Forward outlook
- Local home prices are declining (-3.0%/yr); year-one equity from $449 of loan paydown is wiped out by about $2k of value loss. Plan a longer hold.
- Pinellas County population projected at +14% by 2050 — modest demand growth; plan on rents tracking national, not racing it.
- At projected returns (-3.0% appreciation + 0.0% rent growth), your $18k cash investment doubles in ~3 years — after that, you're playing with house money.
Negotiation context
- It's been on market 17 days — a 2% lower offer ($64k) is reasonable based on typical stale-listing flexibility.
- Current owner paid $22k; list at $65k implies a 195% gain — meaningful room to come down on a strong offer.
Risks & watch-outs
- Climate carrying-cost: major flood risk; severe wind risk, 99% chance of damaging wind over 30y; extreme-heat days projected 6→22/yr by 2055 (HVAC capex compounding) — expect insurance premiums to compound above CPI over the hold.
Questions for the listing agent
- Built in 1969 — when were the roof, HVAC, electrical panel, plumbing, and water heater last replaced?
- What does the HOA fee cover, when was the last increase, and are there any pending special assessments or reserve-fund shortfalls?
- Is there a deadline driving the sale (1031 exchange, divorce, estate, relocation)? That informs how much negotiation room exists.
- What's the average days-on-market for RENTAL listings here right now (not sales)? A rising rental-DOM trend means longer vacancies and softer asking-rent achievability than the comps imply.
- What's the recent tenant-quality profile in this submarket — average credit score on applications, eviction rate, late-payment / NSF rate, and stable-employment percentage? A property-management company in the area should have these aggregated.
- How much new for-sale + rental construction is in the pipeline within 1–3 miles? Heavy new supply typically softens prices + rents 12–24 months out; constrained supply supports both.
Investment metrics
- 1% rule
- 2.51% ✓
- Cap rate
- 19.77%
- Cash-on-cash
- 48.12%
- DSCR
- 3.14
- GRM
- 3.3
CMA / ARV
No comps found within radius.
Projected returns pro-forma
-3.0% appreciation · 0.0% rent growth · sell at horizon
- IRR
- 41.9%
- Equity multiple
- 2.72×
- Total profit
- $31,253
- Equity at exit
- $9,692
- IRR
- 46.5%
- Equity multiple
- 4.79×
- Total profit
- $68,937
- Equity at exit
- $5,620
Cash invested: $18,200 (down + closing). Projections, not guarantees.
Landlord ↔ Tenant lean methodology
- Overall (STATE)
- 87 Strongly Landlord-Friendly
- State Florida
- 87 Strongly Landlord-Friendly · R+3
- County
- — inherits STATE
- City
- — inherits STATE
ZIP-level market 33764
- Rents YoY
- -5.2%
- Active inventory
- 261
- Price-to-rent
- 3.3×
Monthly cashflow live
- Estimated rent
- $1,634 medium interval (Pro) →
- Mortgage (P&I)
- −$341
- Tax from tax record
- −$38 /mo · $462/yr
- Insurance
- −$27
- HOA
- −$155
- Vacancy / Maint / Mgmt
- −$343
- Net cashflow
- $730
Break-even live
UW: 25.0% down · 7.5% · 30yr · 1.5% tax · 5.0% vac · 8.0% maint · 8.0% mgmt
Financing live
Cash to close
- Down payment
- $16,250
- Closing costs
- $1,950
- Reserves months
- —
- Total cash needed
- —
Loan-product check · same deal, 3 products live
Conventional
25% down · 7.5% · 30yr
- Down + closing
- —
- Monthly P&I
- —
- Monthly cashflow
- —
- DSCR
- —
- Eligible?
- —
Personal DTI + credit; lowest rate.
DSCR
20% down · 8.5% · 30yr
- Down + closing
- —
- Monthly P&I
- —
- Monthly cashflow
- —
- DSCR
- —
- Eligible?
- —
No personal income docs; deal must DSCR.
Hard money
10% down · 12.0% · 12mo
- Down + closing
- —
- Monthly P&I
- —
- Monthly cashflow
- —
- DSCR
- —
- Eligible?
- —
Short-term bridge; refi at stabilization.
Rent comps 1 comps
| Address | Beds | Baths | Sqft | Rent | $/sqft | DOM | Units | Dist |
|---|---|---|---|---|---|---|---|---|
| 15672 US Hwy 19 N Clearwater, FL | — | 1.0 | 300 | $2,099 | $7.00 | 7d | 1 | 0.48mi |
HOA detail
- Monthly dues
- $155 · $1,860/yr
Listing history 12 events
-
2026-06-18days on market $65,000 Active 17 DOM
-
2026-06-17days on market $65,000 Active 16 DOM
-
2026-06-16days on market $65,000 Active 15 DOM
-
2026-06-15days on market $65,000 Active 14 DOM
-
2026-06-13days on market $65,000 Active 12 DOM
-
2026-06-09days on market $65,000 Active 8 DOM
-
2026-06-08days on market $65,000 Active 7 DOM
-
2026-06-07days on market $65,000 Active 6 DOM
-
2026-06-04days on market $65,000 Active 3 DOM
-
2026-06-03days on market $65,000 Active 2 DOM
-
2026-06-02remarks 247-char remark
-
2026-06-02$65,000 Active 1 DOM
ⓘ Source: listings_history table (triggers on properties + properties_extension) + one-shot
backfill from property_details.listing_events for pre-trigger history.
Tax reassessment forecast FL · Resets to sale price
- Current annual tax
- $462 · $38/mo
- Projected year-2 tax
- $540 · $45/mo
- Expected delta
- +$78/yr (+$6/mo · 16.8%)
ⓘ Screening estimate from a state-policy table — verify with the county assessor before closing.
Climate risk First Street
- Flood 6/10 Major FEMA zone X (unshaded) · 66% chance over 30 yrs
- Wildfire 1/10 Low
- Heat 10/10 Extreme 6 d/yr ≥107°F today · 22 d/yr by 30 yrs out
- Wind 10/10 Extreme 99% chance of damaging wind over 30 yrs
- Air quality 3/10 Moderate 3 unhealthy d/yr today · 3 by 30 yrs out
Nearby sold comps map
Loading sold comps map…
Walkable amenities ~0.75 mi
Loading nearby amenities…
Taxation est. · year 1
- Rental income
- $19,614
- − Mortgage interest
- −$3,641
- − Property taxes
- −$462
- − Insurance
- −$325
- − Repairs & maintenance
- −$1,569
- − Management
- −$1,569
- − HOA
- −$1,860
- − Depreciation
- −$1,891
- Taxable income
- $8,297
- Est. tax owed @ 24.0%
- −$1,991
- After-tax cash flow
- $6,767/yr
For passive investors: Depreciation is non-cash, so a rental often shows a tax loss while cash-flowing — sheltering income. Rental losses are passive: they offset passive income freely, and up to $25,000/yr can offset ordinary (W-2) income if you actively participate and your MAGI is under $100k (phasing out to $0 by $150k); unused losses carry forward. On sale, claimed depreciation is recaptured at up to 25%, and gains may owe capital-gains tax (a 1031 exchange can defer both). Figures are a year-1 estimate at your 24.0% rate — not tax advice; consult a CPA.
Schools (NCES district)
- District
- Pinellas
- NCES district ID
- 1201560
- Math proficiency
- 51% ▼ -5.00%
- Reading proficiency
- 51% ▼ -3.00%
- Median HH income
- $46,270
- Composite
- 43.27/100
- National rank
- #3046
- State rank
- #31 of 73 in FL
Livability — Largo
- Score
- 82/100
- State rank
- #82
- US rank
- #1240
Category grades
Schools grade is shown separately in the Schools card above.
Census & demographics
- Census place
- Largo, FL
- County
- Pinellas County · 939,478 people
- City population
- 106,311
- Metro
- Tampa-St. Petersburg-Clearwater, FL
- Population (ZIP)
- 27,311
- Household income
- $67,256
- Rent vs Own
- Severe rent burden
- 1118.0
Population outlook (Pinellas County) Hauer SSP2
- Today (2025)
- 1,027,532 people
- By 2030
- 1,063,586 · +3.5%
- By 2040
- 1,125,020 · +9.5%
- By 2050
- 1,168,637 · +13.7%
- By 2075
- 1,265,188 · +23.1%
- By 2100
- 1,260,357 · +22.7%
Race, ethnicity, and origin ACS 2023
- Neighborhood character
- Predominantly White (76%)
- Race & ethnicity
- White 76% Hispanic / Latino 13% Two or more races 8% Asian 4% Black 2%
- Hispanic origin (detail)
- Mexican 2% Puerto Rican 3% Cuban 2%
- Common ancestry
- Romanian 4% Lithuanian 3% German 2%
- Foreign-born
- 14% · Canada, Jamaica, Vietnam
- Languages at home
- 80% English-only · Spanish 10% Russian/Polish/Slavic 4% Other Indo-European 2%
Political lean MEDSL · Pinellas
- 2024 margin
- Lean R (+5.2) · D 46.9% · R 52.1%
- 2008→2024 swing
- -13.5pp toward R · 2008: 8.3pp · 2024: -5.2pp
- All cycles
- 2024: R+5.2 2020: D+0.2 2016: R+1.1 2012: D+5.6 2008: D+8.3
Not yet ingested
- Civics
- —
Market trends
- HPI YoY
- ▼ -350.08%
- Current HPI
- 315.4133
- Rent YoY
- ▼ -5.24%
- Metro
- Tampa-St. Petersburg-Clearwater, FL
- State GDP YoY
- ▲ 3.28%
- F500 in state
- 36
Industry mix (Fortune 500 HQ in FL)
| Industry | F500 HQs | Revenue |
|---|---|---|
| Industrial Technology | 2 | $29B |
|
||
| Insurance | 2 | $17B |
|
||
| Retail | 1 | $60B |
|
||
| Technology Distribution | 1 | $58B |
|
||
| Homebuilding | 1 | $35B |
|
||
| Technology Manufacturing | 1 | $35B |
|
||
Price history
+622.2% since first listed4 events — show timeline
- 2026-06-01 Listed $65,000 Stellar MLS as Distributed by MLS Grid
- 2002-12-01 Sold (Public Records) $22,000 Public Records
- 2001-02-01 Sold (Public Records) $11,000 Public Records
- 1997-04-23 Sold (Public Records) $9,000 Public Records
Property tax history
+0.2%/yrLatest (2025): $462 · -60.2% YoY. Source: county tax records.
Cash-flow waterfall
monthlySold comps — $/sqft
last 12 mo · ≤1 miLoading sold comps…