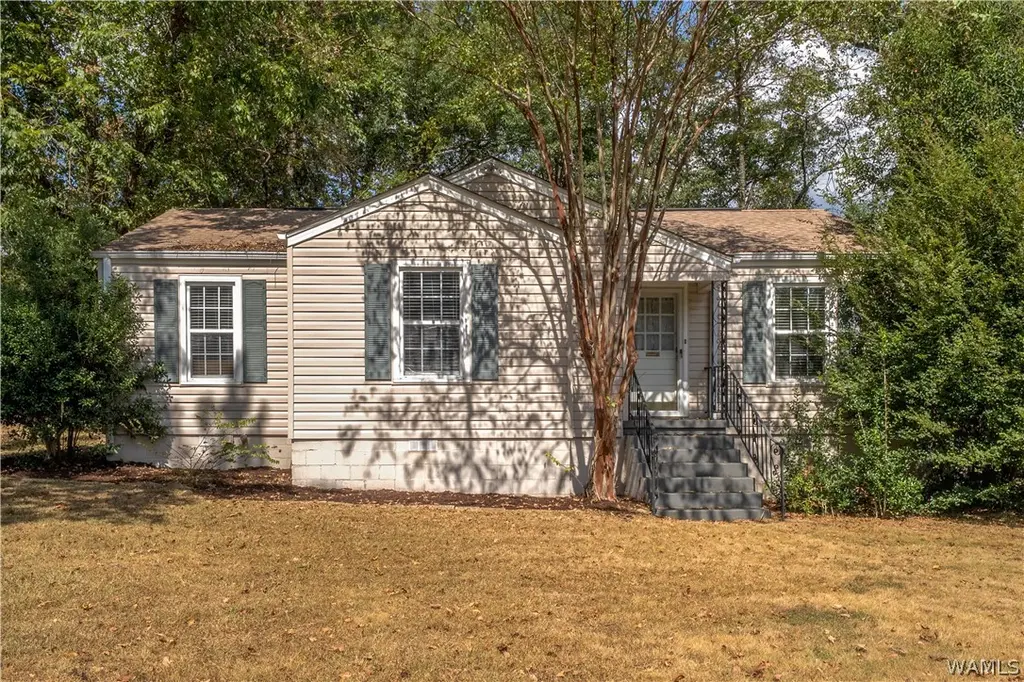
5 Springbrook · Tuscaloosa, AL
Flood risk 1/10 · Minimal
- FEMA flood zone
- X (unshaded)
- Chance of flooding over 30 yrs
- 0.0%
- Est. flood insurance / yr
- $507 – $1,088
Fire risk 1/10 · Minimal
- Est. fire insurance / yr
- $916 – $1,700
Heat risk 7/10 · Major
- Hot days now (above 108°F)
- 7 days/yr
- Hot days in 30 yrs
- 20 days/yr
Wind risk 6/10 · Moderate
- Chance of severe wind over 30 yrs
- 59.0%
Air-quality risk 3/10 · Minor
- Unhealthy air days now
- 2 days/yr
- Unhealthy air days in 30 yrs
- 3 days/yr
Risk factors via First Street. Map © Google.
Why this score? — see what drove the D grade
The composite is a weighted blend of 9 inputs, each scored 0–100. Each bar is that input's sub-score; the figure is the points it added to the 100-point composite (weight × sub-score).
- Cash flow +14.9/30.0
- ARV discount +8.0/15.0
- DSCR +4.5/10.0
- Rent growth +3.9/5.0
- Livability +3.9/5.0
- 1% rule +3.2/10.0
- Schools +2.5/10.0
- Condition / age +2.5/5.0
- Appreciation +0.0/10.0
$169,900
🖨 Deal sheet (PDF) 📄 Offer letter ✓ Due diligence
Listing remarks MLS
Nestled on a spacious lot just minutes from Downtown Tuscaloosa, the University of Alabama, Target, and local parks, this 1945 cottage is full of charm and character. Inside, you’ll find beautiful hardwood floors, a cozy living room with a fireplace, and windows that fill the home with natural light. The dining room connects easily to the kitchen, and the third bedroom is currently being used as a large laundry and utility space, offering versatile options. A newer roof adds peace of mind, complementing the home’s timeless appeal. Enjoy mornings or evenings on the screened-in porch and take in the generous backyard, made for outdoor enjoyment. With its warmth, convenience, and inviting appeal, this cottage is truly a special find.
Key facts
- Cozy living room
- Large laundry
- Natural light
Tags
Neighborhood map
What this means for you Summary
Snapshot
- This is a 3-bed/1.0-bath single-family listed at $170k.
Deal economics
- At list price, monthly cash flow is $48 ($580/yr) — positive.
- The deal already cash-flows at list — no discount required.
- To meet the 1% rule (rent ≥ 1% of price), the offer needs to be $139k (18.0% below list).
- Recommended offer: $139k (18.0% below list) — sets the bar for 1% rule.
- Cap rate 6.6% vs local median 3.4% in Tuscaloosa — top-decile yield for the area; either an underpriced asset or a hidden risk that comps aren't pricing in. Stress-test before assuming the spread holds.
Location & tenants
- Location reads 77/100 on livability (#9 in AL, #2,909 nationally) — a middle-class / working-renter tenant base. Strengths: amenities A+, health & safety A+, cost of living A; Watch: crime F, employment D-.
- Tuscaloosa City (urban): math 19% / reading 40% proficiency, ranked #74 of 129 in AL (top 57%) — low school quality limits family demand, transient renter base, plan for 1-2y turnover.
- Zoned schools: Eastwood Middle School (math 3% / reading 31%, grade F, #201 of 257 statewide, top 79%, 758 students, 78% FRL); Paul W Bryant High School (math 3% / reading 7%, grade F, #276 of 305 statewide, top 95%, 1,042 students, 48% FRL) — zoned schools at 63% FRL track the district average.
- Zoned-school proficiency averages 11% at this address vs 30% district-wide (-18 pts) — the specific schools serving this property underperform the Tuscaloosa City average; the district grade overstates school quality for this exact location.
- Market conditions: Rents rising fast (+5.4%/yr); 462 active listings in the ZIP; 26 comparable units currently listed for rent nearby; rentals lingering (median 46d on market — plan ~5-8 weeks vacancy on turnover, expect pricing pressure); 62% of comp listings sitting > 30 days — soft ceiling on asking rent; 622 units permitted in Tuscaloosa County in 2024 (69 in 5+ unit buildings).
Forward outlook
- Local home prices are declining (-3.0%/yr); year-one equity from $1k of loan paydown is wiped out by about $5k of value loss. Plan a longer hold.
- Tuscaloosa County population projected at +26% by 2050 — long-run rental-demand tailwind backs the buy-and-hold thesis.
Negotiation context
- It's been on market 77 days — a 6% lower offer ($160k) is reasonable based on typical stale-listing flexibility.
- 3 sale attempts since 4y ago with the ask held roughly flat each time — persistent listings suggest the price (not the market) is what's stuck; bring a comps-based counter.
Risks & watch-outs
- Watch-outs: built in 1945 — expect roof / HVAC / electrical / plumbing capex.
- Climate carrying-cost: major wind risk, 59% chance of damaging wind over 30y; extreme-heat days projected 7→20/yr by 2055 (HVAC capex compounding) — expect insurance premiums to compound above CPI over the hold.
Questions for the listing agent
- It's been on market 77 days. Have you received any prior offers? Is the seller open to a 18% concession, seller financing, or rate buy-down credit?
- Built in 1945 — when were the roof, HVAC, electrical panel, plumbing, and water heater last replaced?
- Why hasn't it sold? Are there any deal-killer items the seller is aware of (foundation, flood, title, zoning, code violations)?
- Is there a deadline driving the sale (1031 exchange, divorce, estate, relocation)? That informs how much negotiation room exists.
- Crime grade is F in this area — have there been break-ins, vandalism, or insurance claims at this property in the last 3 years? What carrier currently insures it and at what premium?
- The area grade is low — what's the realistic commute time and amenity access for the typical tenant pool here? Any planned neighborhood developments (good or bad) we should know about?
- What's the average days-on-market for RENTAL listings here right now (not sales)? A rising rental-DOM trend means longer vacancies and softer asking-rent achievability than the comps imply.
- What's the recent tenant-quality profile in this submarket — average credit score on applications, eviction rate, late-payment / NSF rate, and stable-employment percentage? A property-management company in the area should have these aggregated.
- How much new for-sale + rental construction is in the pipeline within 1–3 miles? Heavy new supply typically softens prices + rents 12–24 months out; constrained supply supports both.
Investment metrics
- 1% rule
- 0.82% ✗
- Cap rate
- 6.63%
- Cash-on-cash
- 1.22%
- DSCR
- 1.05
- GRM
- 10.2
CMA / ARV
- ARV (median comp)
- $171,849
- List price
- $169,900
- Delta
- -1.13%
- Verdict
- FAIR
- Comps
- 20 within 1.0 mi
Show comp detail 12 sales within ~0.75 mi
| Address | Dist | Beds/Ba | Sqft | Sold | Price | $/sf | Match |
|---|---|---|---|---|---|---|---|
| 70 Springbrook | 0.14mi | 3/1.0 | 1,178 (+10%) | 2mo | $170,000 | $144 | 75 |
| 2502 E 5th Ave E | 0.34mi | 3/1.0 | 1,160 (+9%) | 3mo | $187,500 | $162 | 67 |
| 217 32nd Pl E | 0.38mi | 3/1.5 | 1,175 (+10%) | 1mo | $170,000 | $145 | 62 |
| 12 Dubois Terrace Ter | 0.53mi | 3/1.0 | 1,182 (+11%) | 1mo | $145,000 | $123 | 56 |
| 33 Cedar Knoll Knl | 0.44mi | 3/2.0 | 1,185 (+11%) | 2mo | $240,000 | $203 | 55 |
| 214 32nd Pl E | 0.37mi | 3/1.5 | 1,222 (+14%) | 2mo | $220,000 | $180 | 55 |
| 304 Orange St | 0.36mi | 2/1.0 (-1) | 928 (-13%) | 4mo | $75,000 | $81 | 53 |
| 61 Cedar Knoll Knl | 0.48mi | 3/2.0 | 1,176 (+10%) | 5mo | $196,450 | $167 | 53 |
| 3800 3rd Ave | 0.74mi | 3/2.0 | 1,120 (+5%) | 2mo | $100,000 | $89 | 52 |
| 2506 4th Ave E | 0.40mi | 2/2.0 (-1) | 912 (-14%) | 1mo | $131,500 | $144 | 48 |
| 405 26th St St E | 0.36mi | 2/1.0 (-1) | 912 (-14%) | 9mo | $115,000 | $126 | 47 |
| 2216 Forest Lake Dr | 0.67mi | 3/2.0 | 1,218 (+14%) | 2mo | $249,000 | $204 | 39 |
Match score weights: distance 35% · size 25% · config 20% · recency 20%. Top-matched comps best support the ARV.
Projected returns pro-forma
-3.0% appreciation · 5.42% rent growth · sell at horizon
- IRR
- -12.0%
- Equity multiple
- 0.56×
- Total profit
- $-21,035
- Equity at exit
- $25,333
- IRR
- 0.1%
- Equity multiple
- 1.01×
- Total profit
- $400
- Equity at exit
- $14,690
Cash invested: $47,572 (down + closing). Projections, not guarantees.
Landlord ↔ Tenant lean methodology
- Overall (STATE)
- 90 Strongly Landlord-Friendly
- State Alabama
- 90 Strongly Landlord-Friendly · R+15
- County
- — inherits STATE
- City
- — inherits STATE
ZIP-level market 35405
- Home prices YoY
- -26.9%
- Rents YoY
- 5.4%
- Active inventory
- 462
- Price-to-rent
- 10.2×
Monthly cashflow live
- Estimated rent
- $1,393 high interval (Pro) →
- Mortgage (P&I)
- −$891
- Tax from tax record
- −$90 /mo · $1,082/yr
- Insurance
- −$71
- HOA
- −$0
- Vacancy / Maint / Mgmt
- −$292
- Net cashflow
- $48
Break-even live
Sensitivity live
| Price | -10% $144 | -5% $96 | +0% $48 | +5% $0 | +10% $-48 |
|---|---|---|---|---|---|
| Rent | -10% $-62 | -5% $-7 | +0% $48 | +5% $103 | +10% $158 |
| Rate | -1.0pp $134 | -0.5pp $92 | base $48 | +0.5pp $4 | +1.0pp $-41 |
UW: 25.0% down · 7.5% · 30yr · 1.5% tax · 5.0% vac · 8.0% maint · 8.0% mgmt
Financing live
Cash to close
- Down payment
- $42,475
- Closing costs
- $5,097
- Reserves months
- —
- Total cash needed
- —
Loan-product check · same deal, 3 products live
Conventional
25% down · 7.5% · 30yr
- Down + closing
- —
- Monthly P&I
- —
- Monthly cashflow
- —
- DSCR
- —
- Eligible?
- —
Personal DTI + credit; lowest rate.
DSCR
20% down · 8.5% · 30yr
- Down + closing
- —
- Monthly P&I
- —
- Monthly cashflow
- —
- DSCR
- —
- Eligible?
- —
No personal income docs; deal must DSCR.
Hard money
10% down · 12.0% · 12mo
- Down + closing
- —
- Monthly P&I
- —
- Monthly cashflow
- —
- DSCR
- —
- Eligible?
- —
Short-term bridge; refi at stabilization.
Rent comps 26 comps
| Address | Beds | Baths | Sqft | Rent | $/sqft | DOM | Units | Dist |
|---|---|---|---|---|---|---|---|---|
| 621 E 33rd St Unit D Tuscaloosa, AL | 2.0 | 1.0 | 1000 | $925 | $0.93 | 45d | 1 | 0.24mi |
| 713 33rd St E Tuscaloosa, AL | 2.0 | 2.0 | 1036 | $815 | $0.79 | 45d | 1 | 0.24mi |
| 3014 3rd Ct E Tuscaloosa, AL | 3.0 | 2.0 | 1449 | $1,675 | $1.16 | 15d | 1 | 0.32mi |
| 3504 12th Ave E Tuscaloosa, AL | 2.0 | 1.0–1.5 | 1019 | $1,037 | $1.02 | 45d | 10 | 0.47mi |
| 632 23rd St E Tuscaloosa, AL | 2.0 | 1.5 | 960 | $1,058 | $1.10 | 23d | 2 | 0.61mi |
| 235 James I Harrison Jr Pkwy E Tuscaloosa, AL | 1.0–3.0 | 1.0–2.0 | 1259 | $1,200 | $0.95 | 45d | 37 | 0.61mi |
| 302 22nd St E Tuscaloosa, AL | 3.0 | 2.0 | 1150 | $1,475 | $1.28 | 23d | 1 | 0.68mi |
| 1901 5th Ave E Tuscaloosa, AL | 3.0 | 3.0 | 1336 | $2,300 | $1.72 | 23d | 1 | 0.75mi |
| 1800 Hargrove East Rd Tuscaloosa, AL | 2.0 | 1.0 | 950 | $875 | $0.92 | 15d | 1 | 0.81mi |
| 3820 1st Ave Tuscaloosa, AL | 1.0–3.0 | 1.0–2.0 | 835 | $1,250 | $1.50 | 45d | 11 | 0.83mi |
| 715 Dogwood Ln Tuscaloosa, AL | 2.0 | 1.0 | 1126 | $1,099 | $0.98 | 15d | 3 | 1.10mi |
| 20 16th St Tuscaloosa, AL | 1.0–3.0 | 1.0–3.0 | 1320 | $3,000 | $2.27 | 45d | 4 | 1.16mi |
| 80 16th St Unit 1-8 Tuscaloosa, AL | 1.0–3.0 | 1.0–3.0 | 1320 | $3,000 | $2.27 | 45d | 4 | 1.17mi |
| 380 14th Pl E Tuscaloosa, AL | 2.0 | 2.0 | 1440 | $1,850 | $1.28 | 45d | 1 | 1.19mi |
| 1415 2nd East Ct Tuscaloosa, AL | 2.0 | 1.5 | 1033 | $2,200 | $2.13 | 45d | 1 | 1.24mi |
| 1724 5th Ave Tuscaloosa, AL | 4.0 | 2.0 | 1350 | $1,550 | $1.15 | 45d | 1 | 1.26mi |
| 1813 Hackberry Ln Tuscaloosa, AL | 2.0 | 2.0 | 894 | $1,450 | $1.62 | 45d | 1 | 1.27mi |
| 2837 Valley Crest Rd Tuscaloosa, AL | 2.0 | 1.0 | 1369 | $550 | $0.40 | 45d | 1 | 1.32mi |
| 1915 6th Ave Tuscaloosa, AL | 2.0 | 2.5 | 1290 | $1,195 | $0.93 | 23d | 1 | 1.33mi |
| 1515 Kicker Rd Tuscaloosa, AL | 1.0–2.0 | 1.0–2.0 | 1050 | $1,025 | $0.98 | 45d | 1 | 1.33mi |
| 123 Circlewood Tuscaloosa, AL | 2.0 | 1.0 | 1250 | $1,150 | $0.92 | 45d | 1 | 1.38mi |
| 1925 8th Ave Tuscaloosa, AL | 1.0–2.0 | 1.0 | 794 | $1,054 | $1.33 | 15d | 1 | 1.39mi |
| 502 16th St Unit 6 Tuscaloosa, AL | 3.0 | 3.0 | 1480 | $2,000 | $1.35 | 23d | 1 | 1.40mi |
| 1305 12th St E Tuscaloosa, AL | 4.0 | 2.0 | 1377 | $1,615 | $1.17 | 23d | 1 | 1.42mi |
| 4527 18th Ave E Tuscaloosa, AL | 1.0–2.0 | 1.0–2.0 | 878 | $1,249 | $1.42 | 45d | 6 | 1.43mi |
| 1805 8th Ave Tuscaloosa, AL | 1.0–2.0 | 1.0–2.0 | 1175 | $1,380 | $1.17 | 45d | 1 | 1.46mi |
Listing history 17 events
-
2026-06-09days on market $169,900 Active 77 DOM
-
2026-06-08days on market $169,900 Active 76 DOM
-
2026-06-07days on market $169,900 Active 75 DOM
-
2026-06-05days on market $169,900 Active 72 DOM
-
2026-06-03days on market $169,900 Active 71 DOM
-
2026-06-02days on market $169,900 Active 70 DOM
-
2026-06-01days on market $169,900 Active 69 DOM
-
2026-05-31days on market $169,900 Active 68 DOM
-
2026-05-30days on market $169,900 Active 67 DOM
-
2026-03-24$169,900 Active 752-char remark
Show marketing remark (752 chars)
Nestled on a spacious lot just minutes from Downtown Tuscaloosa, the University of Alabama, Target, and local parks, this 1945 cottage is full of charm and character. Inside, you’ll find beautiful hardwood floors, a cozy living room with a fireplace, and windows that fill the home with natural light. The dining room connects easily to the kitchen, and the third bedroom is currently being used as a large laundry and utility space, offering versatile options. A newer roof adds peace of mind, complementing the home’s timeless appeal. Enjoy mornings or evenings on the screened-in porch and take in the generous backyard, made for outdoor enjoyment. With its warmth, convenience, and inviting appeal, this cottage is truly a special find.
-
2026-01-06price $169,900
-
2025-10-16price $179,900
-
2025-10-01$189,900 Active
-
2022-07-05soldstatus $155,000
-
2022-06-28soldstatus $155,000 Closed
-
2022-05-24historical
-
2022-05-10$159,000
ⓘ Source: listings_history table (triggers on properties + properties_extension) + one-shot
backfill from property_details.listing_events for pre-trigger history.
Tax reassessment forecast AL · Resets to sale price
- Current annual tax
- $1,082 · $90/mo
- Projected year-2 tax
- $1,082 · $90/mo
- Expected delta
- $0/yr ($0/mo · 0.0%)
ⓘ Screening estimate from a state-policy table — verify with the county assessor before closing.
Climate risk First Street
- Flood 1/10 Low FEMA zone X (unshaded) · 0% chance over 30 yrs
- Wildfire 1/10 Low
- Heat 7/10 Severe 7 d/yr ≥108°F today · 20 d/yr by 30 yrs out
- Wind 6/10 Major 59% chance of damaging wind over 30 yrs
- Air quality 3/10 Moderate 2 unhealthy d/yr today · 3 by 30 yrs out
Nearby sold comps map
Loading sold comps map…
Walkable amenities ~0.75 mi
Loading nearby amenities…
Taxation est. · year 1
- Rental income
- $16,712
- − Mortgage interest
- −$9,517
- − Property taxes
- −$1,082
- − Insurance
- −$850
- − Repairs & maintenance
- −$1,337
- − Management
- −$1,337
- − Depreciation
- −$4,943
- Taxable loss
- −$2,353
- Est. tax savings @ 24.0%
- +$565
- After-tax cash flow
- $1,144/yr
For passive investors: Depreciation is non-cash, so a rental often shows a tax loss while cash-flowing — sheltering income. Rental losses are passive: they offset passive income freely, and up to $25,000/yr can offset ordinary (W-2) income if you actively participate and your MAGI is under $100k (phasing out to $0 by $150k); unused losses carry forward. On sale, claimed depreciation is recaptured at up to 25%, and gains may owe capital-gains tax (a 1031 exchange can defer both). Figures are a year-1 estimate at your 24.0% rate — not tax advice; consult a CPA.
Schools (NCES district)
- District
- Tuscaloosa City
- NCES district ID
- 0103360
- Math proficiency
- 19% ▼ -24.00%
- Reading proficiency
- 40% ▼ -1.00%
- Median HH income
- $37,474
- Composite
- 24.51/100
- National rank
- #7647
- State rank
- #74 of 129 in AL
Livability — Tuscaloosa
- Score
- 77/100
- State rank
- #9
- US rank
- #2909
Category grades
Schools grade is shown separately in the Schools card above.
Census & demographics
- Census place
- Tuscaloosa, AL
- County
- Tuscaloosa County · 206,491 people
- City population
- 134,228
- Metro
- Tuscaloosa, AL
- Population (ZIP)
- 49,420
- Household income
- $62,301
- Rent vs Own
- Severe rent burden
- 1963.0
Population outlook (Tuscaloosa County) Hauer SSP2
- Today (2025)
- 228,293 people
- By 2030
- 240,551 · +5.4%
- By 2040
- 263,856 · +15.6%
- By 2050
- 286,491 · +25.5%
- By 2075
- 335,783 · +47.1%
- By 2100
- 370,520 · +62.3%
Race, ethnicity, and origin ACS 2023
- Neighborhood character
- Diverse neighborhood (Simpson 0.56)
- Race & ethnicity
- Black 56% White 35% Hispanic / Latino 5% Two or more races 3% Asian 2%
- Hispanic origin (detail)
- Mexican 2%
- Common ancestry
- Italian 1% Lithuanian 1% Slovak 1%
- Foreign-born
- 5% · Canada, China
- Languages at home
- 94% English-only · Spanish 4% Other Indo-European 1% Chinese 1%
Political lean MEDSL · Tuscaloosa
- 2024 margin
- Strong R (+20.4) · D 39.4% · R 59.8%
- 2008→2024 swing
- -4.4pp toward R · 2008: -16.0pp · 2024: -20.4pp
- All cycles
- 2024: R+20.4 2020: R+14.8 2016: R+19.5 2012: R+17.4 2008: R+16.0
Not yet ingested
- Civics
- —
Market trends
- HPI YoY
- ▼ -71.25%
- Current HPI
- 193.1929
- Rent YoY
- ▲ 5.42%
- Metro
- Tuscaloosa, AL
- State GDP YoY
- ▲ 2.94%
- F500 in state
- 4
Industry mix (Fortune 500 HQ in AL)
| Industry | F500 HQs | Revenue |
|---|---|---|
| Financial Services | 1 | $8B |
|
||
| Healthcare | 1 | $5B |
|
||
Price history
+6.9% since first listed8 events — show timeline
- 2026-03-24 Listed $169,900 WAMLS
- 2026-01-06 Price Changed $169,900 WAMLS
- 2025-10-16 Price Changed $179,900 WAMLS
- 2025-10-01 Listed $189,900 WAMLS
- 2022-07-05 Sold (Public Records) $155,000 Public Records
- 2022-06-28 Sold (MLS) $155,000 WAMLS
- 2022-05-24 Delisted — WAMLS
- 2022-05-10 Listed $159,000 WAMLS
Property tax history
+1.6%/yrLatest (2022): $1,082 · -2.2% YoY. Source: county tax records.
Cash-flow waterfall
monthlySold comps — $/sqft
last 12 mo · ≤1 miLoading sold comps…