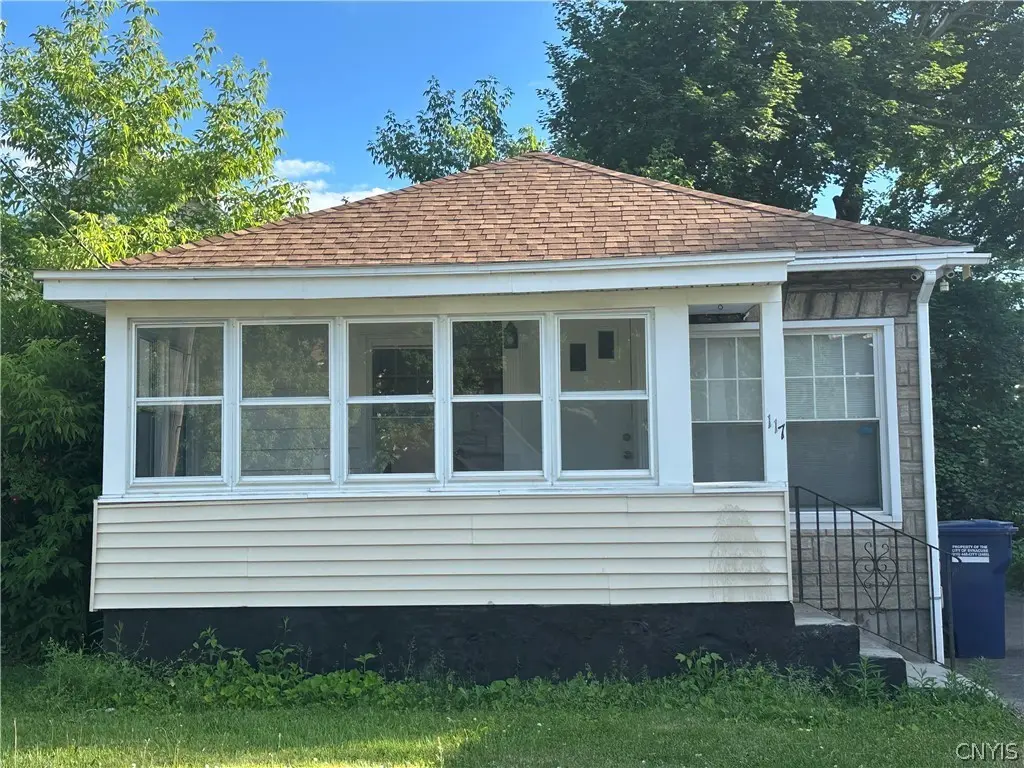
117 Hood Ave · Syracuse, NY
Flood risk 1/10 · Minimal
- FEMA flood zone
- X (unshaded)
- Chance of flooding over 30 yrs
- 0.0%
- Est. flood insurance / yr
- $473 – $860
Fire risk 1/10 · Minimal
- Est. fire insurance / yr
- $691 – $1,283
Heat risk 3/10 · Minor
- Hot days now (above 95°F)
- 7 days/yr
- Hot days in 30 yrs
- 16 days/yr
Wind risk 1/10 · Minimal
- Chance of severe wind over 30 yrs
- 0.0%
Air-quality risk 2/10 · Minimal
- Unhealthy air days now
- 0 days/yr
- Unhealthy air days in 30 yrs
- 1 days/yr
Risk factors via First Street. Map © Google.
Why this score? — see what drove the D grade
The composite is a weighted blend of 9 inputs, each scored 0–100. Each bar is that input's sub-score; the figure is the points it added to the 100-point composite (weight × sub-score).
- Cash flow +10.0/30.0
- Appreciation +10.0/10.0
- ARV discount +7.5/15.0
- Livability +3.9/5.0
- DSCR +2.9/10.0
- Rent growth +2.5/5.0
- Condition / age +2.5/5.0
- 1% rule +2.1/10.0
- Schools +1.8/10.0
$159,900
🖨 Deal sheet (PDF) 📄 Offer letter ✓ Due diligence
Listing remarks MLS
Adorable 2 bedroom Bungalow has been totally remodeled within the last 6 yrs. Cute front sitting porch provides relaxation for 3 seasons. Formal dining room and Breakfast/Dining makes great space to entertain friends and family. Everything nicely packaged in a tidy little bundle.
Key facts
- Totally remodeled
- Newly added patio
- Upgraded
Tags
Property features AI
Exterior
- Parking: No garage
- Utilities: Public water connected; Sewer connected
- Home design: Single-story home; Resale property; Stone and vinyl siding exterior
- Construction: Block foundation; Stone and vinyl siding construction; Existing (previously built)
- Exterior features: Blacktop driveway; Irregular lot; Lot dimensions approximately 32 x 90
Interior
- Kitchen: Gas oven; Gas range; Refrigerator
- Bedrooms: 2 main-level bedrooms
- Flooring: Hardwood; Laminate; Tile; Varies
- Heating & cooling: Gas forced-air heating
- Interior features: Eat-in kitchen; Bedroom on main level; Partially finished basement; 5 total rooms; Basement present (partially finished)
- Laundry & utility: Washer; Dryer; Gas water heater
Neighborhood map
What this means for you Summary
Snapshot
- This is a 2-bed/1.0-bath single-family listed at $160k.
Deal economics
- At list price, monthly cash flow is $-96 ($-1k/yr) — negative.
- To cash-flow at today's rent, offer at most $143k (10.6% below list).
- To meet the 1% rule (rent ≥ 1% of price), the offer needs to be $114k (29.0% below list).
- Recommended offer: $114k (29.0% below list) — sets the bar for 1% rule.
- Cap rate 5.6% vs local median 8.2% in Syracuse — below-typical yield; the buyer is paying a premium for something (appreciation thesis, condition, location) that the cap rate doesn't capture.
Location & tenants
- Location reads 77/100 on livability (#187 in NY, #2,869 nationally) — a middle-class / working-renter tenant base. Strengths: amenities A+, commute A+, cost of living A+; Watch: schools D+, crime F, employment D-.
- Syracuse City School District (urban): math 18% / reading 26% proficiency, ranked #590 of 590 in NY (top 100%) — low school quality limits family demand, transient renter base, plan for 1-2y turnover; 74% free/reduced lunch — lower-income household profile, screen leases tightly.
- Market conditions: 99 active listings in the ZIP; 10 comparable units currently listed for rent nearby; rentals lingering (median 44d on market — plan ~5-8 weeks vacancy on turnover, expect pricing pressure); 50% of comp listings sitting > 30 days — soft ceiling on asking rent; lower-income renter base — watch delinquency; 616 units permitted in Onondaga County in 2024 (256 in 5+ unit buildings).
- This rent runs 30% of the median local income ($45k/yr) — at the standard rent-burdened threshold; future hikes will face affordability resistance.
Forward outlook
- In year one you build about $17k of equity ($1k loan paydown + $16k appreciation (10.0% local appreciation)).
- Onondaga County population projected to shrink 9% by 2050 — rents likely to lag national; underwrite the cash flow, not the appreciation.
- By year 3, paydown + projected appreciation supports a ~$43k cash-out refi (75% LTV) — recoverable capital for the next deal without selling this one.
Negotiation context
- Only 10 days on market — expect competitive offers; lowballing is unlikely to land.
- 2 sale attempts since 13y ago with the ask held roughly flat each time — persistent listings suggest the price (not the market) is what's stuck; bring a comps-based counter.
- Current owner paid $58k; list at $160k implies a 178% gain — meaningful room to come down on a strong offer.
Risks & watch-outs
- Watch-outs: built in 1890 — expect roof / HVAC / electrical / plumbing capex.
Questions for the listing agent
- What do current leases actually rent for vs. the listed asking? Can we see a recent rent roll and the last 12 months of T-12 income?
- Built in 1890 — when were the roof, HVAC, electrical panel, plumbing, and water heater last replaced?
- Is there a deadline driving the sale (1031 exchange, divorce, estate, relocation)? That informs how much negotiation room exists.
- Schools are D-rated, which usually means shorter tenancies and higher turnover. Who's the typical renter profile here, and what's been the actual vacancy rate?
- Crime grade is F in this area — have there been break-ins, vandalism, or insurance claims at this property in the last 3 years? What carrier currently insures it and at what premium?
- The area grade is low — what's the realistic commute time and amenity access for the typical tenant pool here? Any planned neighborhood developments (good or bad) we should know about?
- What's the average days-on-market for RENTAL listings here right now (not sales)? A rising rental-DOM trend means longer vacancies and softer asking-rent achievability than the comps imply.
- What's the recent tenant-quality profile in this submarket — average credit score on applications, eviction rate, late-payment / NSF rate, and stable-employment percentage? A property-management company in the area should have these aggregated.
- How much new for-sale + rental construction is in the pipeline within 1–3 miles? Heavy new supply typically softens prices + rents 12–24 months out; constrained supply supports both.
Investment metrics
- 1% rule
- 0.71% ✗
- Cap rate
- 5.57%
- Cash-on-cash
- -2.58%
- DSCR
- 0.89
- GRM
- 11.7
CMA / ARV
- ARV (on-the-fly)
- $100,912
- Comps found
- 5
Show comp detail 5 sales within ~0.75 mi
| Address | Dist | Beds/Ba | Sqft | Sold | Price | $/sf | Match |
|---|---|---|---|---|---|---|---|
| 148 Culbert St | 0.32mi | 2/1.0 | 770 (+4%) | 2mo | $103,000 | $134 | 78 |
| 2619 Grant Blvd | 0.49mi | 2/1.0 | 720 (-3%) | 6mo | $140,000 | $194 | 68 |
| 173 Ross Park | 0.17mi | 3/1.5 (+1) | 816 (+10%) | 2mo | $111,000 | $136 | 67 |
| 144 Delmar Pl | 0.68mi | 2/1.0 | 799 (+8%) | 12mo | $181,000 | $227 | 46 |
| 926 Highland St | 0.54mi | 3/1.0 (+1) | 784 (+6%) | 20mo | $92,000 | $117 | 44 |
Match score weights: distance 35% · size 25% · config 20% · recency 20%. Top-matched comps best support the ARV.
Projected returns pro-forma
10.0% appreciation · 3.0% rent growth · sell at horizon
- IRR
- 22.4%
- Equity multiple
- 2.81×
- Total profit
- $80,912
- Equity at exit
- $144,051
- IRR
- 20.1%
- Equity multiple
- 6.43×
- Total profit
- $242,985
- Equity at exit
- $310,651
Cash invested: $44,772 (down + closing). Projections, not guarantees.
Landlord ↔ Tenant lean methodology
- Overall (STATE)
- 15 Strongly Tenant-Friendly
- State New York
- 15 Strongly Tenant-Friendly · D+10
- County
- — inherits STATE
- City
- — inherits STATE
ZIP-level market 13208
- Home prices YoY
- 8.4%
- Active inventory
- 99
- Price-to-rent
- 11.7×
Monthly cashflow live
- Estimated rent
- $1,135 high interval (Pro) →
- Mortgage (P&I)
- −$839
- Tax from tax record
- −$88 /mo · $1,055/yr
- Insurance
- −$67
- HOA
- −$0
- Vacancy / Maint / Mgmt
- −$238
- Net cashflow
- $-96
Break-even live
Sensitivity live
| Price | -10% $-6 | -5% $-51 | +0% $-96 | +5% $-141 | +10% $-187 |
|---|---|---|---|---|---|
| Rent | -10% $-186 | -5% $-141 | +0% $-96 | +5% $-51 | +10% $-6 |
| Rate | -1.0pp $-16 | -0.5pp $-55 | base $-96 | +0.5pp $-138 | +1.0pp $-180 |
UW: 25.0% down · 7.5% · 30yr · 1.5% tax · 5.0% vac · 8.0% maint · 8.0% mgmt
Financing live
Cash to close
- Down payment
- $39,975
- Closing costs
- $4,797
- Reserves months
- —
- Total cash needed
- —
Loan-product check · same deal, 3 products live
Conventional
25% down · 7.5% · 30yr
- Down + closing
- —
- Monthly P&I
- —
- Monthly cashflow
- —
- DSCR
- —
- Eligible?
- —
Personal DTI + credit; lowest rate.
DSCR
20% down · 8.5% · 30yr
- Down + closing
- —
- Monthly P&I
- —
- Monthly cashflow
- —
- DSCR
- —
- Eligible?
- —
No personal income docs; deal must DSCR.
Hard money
10% down · 12.0% · 12mo
- Down + closing
- —
- Monthly P&I
- —
- Monthly cashflow
- —
- DSCR
- —
- Eligible?
- —
Short-term bridge; refi at stabilization.
Rent comps 10 comps
| Address | Beds | Baths | Sqft | Rent | $/sqft | DOM | Units | Dist |
|---|---|---|---|---|---|---|---|---|
| 910 Park St Unit 2 Syracuse, NY | 1.0 | 1.0 | 650 | $950 | $1.46 | 44d | 1 | 0.63mi |
| 912 Park St Unit 2 Syracuse, NY | 1.0 | 1.0 | 620 | $900 | $1.45 | 44d | 1 | 0.63mi |
| 1206 Spring St Apt 16 Syracuse, NY | 1.0 | 1.0 | 600 | $1,050 | $1.75 | 21d | 1 | 0.71mi |
| 416 Danforth St Unit 1F Syracuse, NY | 1.0 | 1.0 | 550 | $1,100 | $2.00 | 44d | 1 | 0.85mi |
| 1132 Wolf St Apt 1 Syracuse, NY | 1.0 | 1.0 | 630 | $1,000 | $1.59 | 44d | 1 | 0.88mi |
| 212 Dorchester Ave Syracuse, NY | 1.0–2.0 | 1.0 | 640 | $1,420 | $2.22 | 14d | 15 | 0.95mi |
| 1509 N Salina St Unit 1 Syracuse, NY | 1.0 | 1.0 | 600 | $1,050 | $1.75 | 44d | 1 | 1.04mi |
| 517 N Salina St Unit 4 Syracuse, NY | 2.0 | 1.0 | 700 | $1,050 | $1.50 | 14d | 1 | 1.13mi |
| 600 James St Syracuse, NY | 1.0 | 1.0 | 492 | $1,450 | $2.94 | 14d | 9 | 1.30mi |
| 117 Edtim Rd Syracuse, NY | 1.0–2.0 | 1.0 | 545 | $1,295 | $2.37 | 14d | 1 | 1.42mi |
Listing history 9 events
-
2026-06-18days on market $159,900 Active 10 DOM
-
2026-06-17days on market $159,900 Active 9 DOM
-
2026-06-16days on market $159,900 Active 8 DOM
-
2026-06-15days on market $159,900 Active 7 DOM
-
2026-06-14days on market $159,900 Active 5 DOM
-
2026-06-13days on market $159,900 Active 4 DOM
-
2026-06-10days on market $159,900 Active 2 DOM
-
2026-06-09remarks 494-char remark
-
2026-06-09$159,900 Active 1 DOM
ⓘ Source: listings_history table (triggers on properties + properties_extension) + one-shot
backfill from property_details.listing_events for pre-trigger history.
Tax reassessment forecast NY · Partial reset (capped growth)
- Current annual tax
- $1,055 · $88/mo
- Projected year-2 tax
- $1,879 · $157/mo
- Expected delta
- +$823/yr (+$69/mo · 78.0%)
ⓘ Screening estimate from a state-policy table — verify with the county assessor before closing.
Climate risk First Street
- Flood 1/10 Low FEMA zone X (unshaded) · 0% chance over 30 yrs
- Wildfire 1/10 Low
- Heat 3/10 Moderate 7 d/yr ≥95°F today · 16 d/yr by 30 yrs out
- Wind 1/10 Low 0% chance of damaging wind over 30 yrs
- Air quality 2/10 Low 0 unhealthy d/yr today · 1 by 30 yrs out
Nearby sold comps map
Loading sold comps map…
Walkable amenities ~0.75 mi
Loading nearby amenities…
Taxation est. · year 1
- Rental income
- $13,625
- − Mortgage interest
- −$8,957
- − Property taxes
- −$1,055
- − Insurance
- −$800
- − Repairs & maintenance
- −$1,090
- − Management
- −$1,090
- − Depreciation
- −$4,652
- Taxable loss
- −$4,018
- Est. tax savings @ 24.0%
- +$964
- After-tax cash flow
- $-189/yr
For passive investors: Depreciation is non-cash, so a rental often shows a tax loss while cash-flowing — sheltering income. Rental losses are passive: they offset passive income freely, and up to $25,000/yr can offset ordinary (W-2) income if you actively participate and your MAGI is under $100k (phasing out to $0 by $150k); unused losses carry forward. On sale, claimed depreciation is recaptured at up to 25%, and gains may owe capital-gains tax (a 1031 exchange can defer both). Figures are a year-1 estimate at your 24.0% rate — not tax advice; consult a CPA.
Schools (NCES district)
- District
- Syracuse City School District
- NCES district ID
- 3628590
- Math proficiency
- 18% ▼ -5.00%
- Reading proficiency
- 26% ▬ 0.00%
- Median HH income
- $32,097
- Composite
- 17.83/100
- National rank
- #9007
- State rank
- #590 of 590 in NY
Livability — Syracuse
- Score
- 77/100
- State rank
- #187
- US rank
- #2869
Category grades
Schools grade is shown separately in the Schools card above.
Census & demographics
- Census place
- Syracuse, NY
- County
- Onondaga County · 247,257 people
- City population
- 152,627
- Metro
- Syracuse, NY
- Population (ZIP)
- 22,993
- Household income
- $44,712
- Rent vs Own
- Severe rent burden
- 1437.0
Population outlook (Onondaga County) Hauer SSP2
- Today (2025)
- 467,894 people
- By 2030
- 463,381 · -1.0%
- By 2040
- 447,697 · -4.3%
- By 2050
- 426,399 · -8.9%
- By 2075
- 373,661 · -20.1%
- By 2100
- 307,967 · -34.2%
Race, ethnicity, and origin ACS 2023
- Neighborhood character
- Highly diverse neighborhood (Simpson 0.70)
- Race & ethnicity
- White 46% Black 24% Asian 14% Two or more races 10% Hispanic / Latino 6%
- Hispanic origin (detail)
- Puerto Rican 4% Dominican 1%
- Common ancestry
- Romanian 3% Swedish 3% Italian 1%
- Foreign-born
- 22% · Vietnam, Philippines, Canada
- Languages at home
- 70% English-only · Spanish 6% Other Asian/Pacific 5% Vietnamese 4%
Political lean MEDSL · Onondaga
- 2024 margin
- D (+17.3) · D 58.6% · R 41.4%
- 2008→2024 swing
- -3.0pp toward R · 2008: 20.3pp · 2024: 17.3pp
- All cycles
- 2024: D+17.3 2020: D+20.6 2016: D+12.8 2012: D+21.1 2008: D+20.3
Not yet ingested
- Civics
- —
Market trends
- HPI YoY
- ▲ 30.91%
- Current HPI
- 399.3284
- Rent YoY
- —
- Metro
- Syracuse, NY
- State GDP YoY
- ▲ 2.60%
- F500 in state
- 92
Industry mix (Fortune 500 HQ in NY)
| Industry | F500 HQs | Revenue |
|---|---|---|
| Financial Services | 10 | $950B |
|
||
| Consumer Goods | 9 | $162B |
|
||
| Insurance | 4 | $225B |
|
||
| Telecommunications | 2 | $144B |
|
||
| Pharmaceuticals | 2 | $112B |
|
||
| Media / Entertainment | 2 | $69B |
|
||
Price history
+154.2% since first listed5 events — show timeline
- 2026-06-08 Listed $159,900 CNYIS
- 2013-05-08 Sold (Public Records) $57,500 Public Records
- 2013-05-08 Listing Removed — CNYIS
- 2013-05-07 Sold (MLS) $57,500 CNYIS
- 2013-01-28 Listed $62,900 CNYIS
Property tax history
+0.3%/yrLatest (2025): $1,055 · +0.0% YoY. Source: county tax records.
Cash-flow waterfall
monthlySold comps — $/sqft
last 12 mo · ≤1 miLoading sold comps…