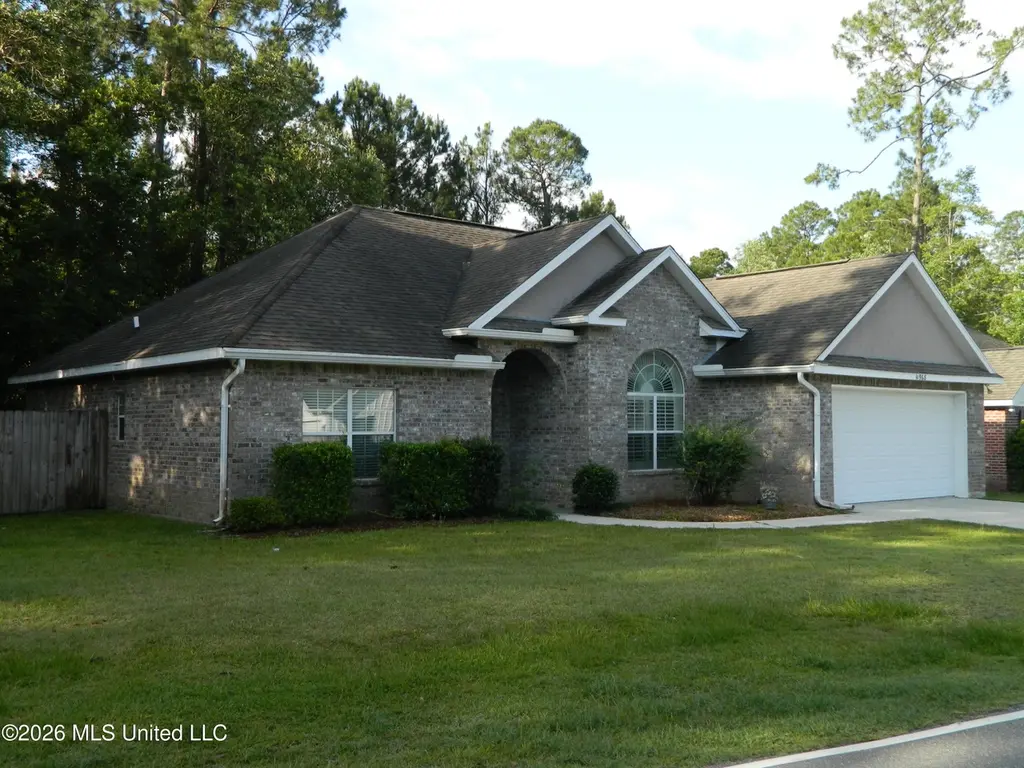
10968 Ala Moana St · Diamondhead, MS
Flood risk 4/10 · Minor
- FEMA flood zone
- X (unshaded)
- Chance of flooding over 30 yrs
- 0.24%
- Est. flood insurance / yr
- $507 – $1,088
Fire risk 6/10 · Moderate
- Est. fire insurance / yr
- $1,241 – $2,305
Heat risk 10/10 · Severe
- Hot days now (above 107°F)
- 7 days/yr
- Hot days in 30 yrs
- 22 days/yr
Wind risk 9/10 · Severe
- Chance of severe wind over 30 yrs
- 99.0%
Air-quality risk 1/10 · Minimal
- Unhealthy air days now
- 0 days/yr
- Unhealthy air days in 30 yrs
- 0 days/yr
Risk factors via First Street. Map © Google.
Why this score? — see what drove the D grade
The composite is a weighted blend of 9 inputs, each scored 0–100. Each bar is that input's sub-score; the figure is the points it added to the 100-point composite (weight × sub-score).
- Cash flow +14.6/30.0
- ARV discount +7.9/15.0
- DSCR +4.5/10.0
- Schools +3.9/10.0
- Livability +3.4/5.0
- 1% rule +3.2/10.0
- Rent growth +2.5/5.0
- Condition / age +2.5/5.0
- Appreciation +0.0/10.0
$275,000
🖨 Deal sheet (PDF) 📄 Offer letter ✓ Due diligence
Listing remarks MLS
QUALITY CONSTRUCTION, 2 x 6 EXTERIOR WALLS, GRANITE, CUSTOM CABINETS, TILE, JACUZZI MBR, WOOD FLOORING W/ CARPET INLAY IN LIVING ROOM, BUILTIN DESK W/ GRANITE, CROWN MOLDING, ROUNDED SHEETROCK CORNERS, STEP CEILINGS IN LIVING AND MASTER, ARCHED DOOR OPENINGS,TWO CAR GARAGE,ALL BRICK.
Key facts
- Eat in kitchen
- Barn door
- Trey ceiling
Tags
Property features AI
Finance
- HOA & community: Homeowners association with $85 monthly fee; Community amenities: boating, clubhouse, golf, hiking/walking trails, playground, pool, RV/boat storage, sports fields, tennis courts
Exterior
- Parking: 2-car garage; Driveway
- Security: Smoke detectors
- Utilities: Public water; Public sewer; Cable available
- Home design: Single-family house; One level
- Construction: Brick and stucco exterior; Architectural shingle roof; Slab foundation; Built information from assessor
- Exterior features: Deck; Patio; Screened porch; Private yard; Wood fencing in back yard
Interior
- Kitchen: Dishwasher; Disposal; Electric range; Microwave; Refrigerator; Granite counters; Kitchen island; Eat-in kitchen; Double vanity
- Bedrooms: Dining room noted as a main room
- Flooring: Ceramic tile
- Bathrooms: 2 full bathrooms
- Heating & cooling: Electric heating; Heat pump; Electric cooling; Heat pump cooling
- Interior features: Ceiling fans; Crown molding; Eat-in kitchen; Granite counters; High ceilings; Kitchen island; Tray ceilings; Double vanity; His and hers closets; Walk-in closets
- Laundry & utility: Washer/Dryer included; Laundry room inside
Neighborhood map
What this means for you Summary
Snapshot
- This is a 3-bed/2.0-bath single-family listed at $275k.
Deal economics
- At list price, monthly cash flow is $66 ($791/yr) — positive.
- The deal already cash-flows at list — no discount required.
- To meet the 1% rule (rent ≥ 1% of price), the offer needs to be $224k (18.4% below list).
- Recommended offer: $224k (18.4% below list) — sets the bar for 1% rule.
- Cap rate 6.6% vs local median 4.9% in Diamondhead — top-decile yield for the area; either an underpriced asset or a hidden risk that comps aren't pricing in. Stress-test before assuming the spread holds.
Location & tenants
- Location reads 68/100 on livability (#59 in MS) — a middle-class / working-renter tenant base. Strengths: crime A+, cost of living A+, housing A+; Watch: amenities F, commute F, health & safety F.
- Hancock County School District (rural): math 47% / reading 44% proficiency, ranked #23 of 130 in MS (top 18%) — families likely to look elsewhere, expect single-tenant / working-renter base with shorter leases.
- Zoned schools: East Hancock Elementary School (math 64% / reading 59%, grade B, #22 of 375 statewide, top 6%, 639 students, 100% FRL); Hancock Middle School (math 48% / reading 44%, grade D+, #39 of 179 statewide, top 22%, 958 students, 100% FRL); Hancock High School (math 42% / reading 43%, grade F, #42 of 197 statewide, top 21%, 1,187 students, 100% FRL) — zoned schools average 100% FRL vs 58% district-wide (41 pts higher); higher-poverty schools than district average — tighter screening recommended.
- Market conditions: 250 active listings in the ZIP; 3 comparable units currently listed for rent nearby; rentals at typical pace (median 23d on market — plan ~3-4 weeks tenant-placement turnaround); solid renter incomes; 248 units permitted in Hancock County in 2024 (0 in 5+ unit buildings).
- This rent runs 31% of the median local income ($87k/yr) — at the standard rent-burdened threshold; future hikes will face affordability resistance.
Forward outlook
- Local home prices are declining (-3.0%/yr); year-one equity from $2k of loan paydown is wiped out by about $8k of value loss. Plan a longer hold.
- Hancock County population projected at +20% by 2050 — long-run rental-demand tailwind backs the buy-and-hold thesis.
Negotiation context
- It's been on market 17 days — a 2% lower offer ($271k) is reasonable based on typical stale-listing flexibility.
- 3 sale attempts since 20y ago with the ask held roughly flat each time — persistent listings suggest the price (not the market) is what's stuck; bring a comps-based counter.
Risks & watch-outs
- Climate carrying-cost: severe wind risk, 99% chance of damaging wind over 30y; major wildfire risk; extreme-heat days projected 7→22/yr by 2055 (HVAC capex compounding) — expect insurance premiums to compound above CPI over the hold.
Questions for the listing agent
- What does the HOA fee cover, when was the last increase, and are there any pending special assessments or reserve-fund shortfalls?
- Is there a deadline driving the sale (1031 exchange, divorce, estate, relocation)? That informs how much negotiation room exists.
- The area grade is low — what's the realistic commute time and amenity access for the typical tenant pool here? Any planned neighborhood developments (good or bad) we should know about?
- What's the average days-on-market for RENTAL listings here right now (not sales)? A rising rental-DOM trend means longer vacancies and softer asking-rent achievability than the comps imply.
- What's the recent tenant-quality profile in this submarket — average credit score on applications, eviction rate, late-payment / NSF rate, and stable-employment percentage? A property-management company in the area should have these aggregated.
- How much new for-sale + rental construction is in the pipeline within 1–3 miles? Heavy new supply typically softens prices + rents 12–24 months out; constrained supply supports both.
Investment metrics
- 1% rule
- 0.82% ✗
- Cap rate
- 6.58%
- Cash-on-cash
- 1.03%
- DSCR
- 1.05
- GRM
- 10.2
CMA / ARV
- ARV (on-the-fly)
- $277,236
- Comps found
- 12
Show comp detail 12 sales within ~0.75 mi
| Address | Dist | Beds/Ba | Sqft | Sold | Price | $/sf | Match |
|---|---|---|---|---|---|---|---|
| 9834 Pokai Way | 0.45mi | 4/2.0 (+1) | 1,848 (+1%) | 0mo | $249,500 | $135 | 72 |
| 9838 Ala Moana St | 0.21mi | 3/2.0 | 1,614 (-12%) | 1mo | $299,900 | $186 | 70 |
| 98167 Golf Club Dr | 0.51mi | 3/2.0 | 1,779 (-3%) | 7mo | $239,900 | $135 | 65 |
| 98177 Golf Club Dr | 0.42mi | 3/2.0 | 1,751 (-5%) | 9mo | $265,000 | $151 | 65 |
| 88154 Golf Club Dr | 0.69mi | 3/2.0 | 1,775 (-3%) | 2mo | $279,000 | $157 | 61 |
| 9912 Honomu Pl | 0.30mi | 4/2.0 (+1) | 2,050 (+12%) | 1mo | $310,000 | $151 | 61 |
| 9958 Kahana St | 0.42mi | 3/2.0 | 1,711 (-7%) | 10mo | $279,000 | $163 | 61 |
| 9941 Hamakua St | 0.48mi | 4/2.0 (+1) | 1,885 (+3%) | 10mo | $260,000 | $138 | 60 |
| 97169 Kapalama Dr | 0.50mi | 3/2.0 | 2,035 (+11%) | 4mo | $210,000 | $103 | 55 |
| 99114 Koloa St | 0.45mi | 3/2.0 | 1,569 (-14%) | 1mo | $109,000 | $69 | 54 |
| 9817 Pokai Way | 0.49mi | 3/2.0 | 1,561 (-15%) | 6mo | $235,000 | $151 | 47 |
| 9920 Honalo Pl | 0.35mi | 4/2.0 (+1) | 2,092 (+14%) | 10mo | $325,000 | $155 | 47 |
Match score weights: distance 35% · size 25% · config 20% · recency 20%. Top-matched comps best support the ARV.
Projected returns pro-forma
-3.0% appreciation · 3.0% rent growth · sell at horizon
- IRR
- -14.7%
- Equity multiple
- 0.47×
- Total profit
- $-40,450
- Equity at exit
- $41,003
- IRR
- -6.1%
- Equity multiple
- 0.61×
- Total profit
- $-30,165
- Equity at exit
- $23,777
Cash invested: $77,000 (down + closing). Projections, not guarantees.
Landlord ↔ Tenant lean methodology
- Overall (STATE)
- 90 Strongly Landlord-Friendly
- State Mississippi
- 90 Strongly Landlord-Friendly · R+11
- County
- — inherits STATE
- City
- — inherits STATE
ZIP-level market 39525
- Home prices YoY
- -19.1%
- Active inventory
- 250
- Price-to-rent
- 10.2×
Monthly cashflow live
- Estimated rent
- $2,244 medium interval (Pro) →
- Mortgage (P&I)
- −$1,442
- Tax from tax record
- −$65 /mo · $781/yr
- Insurance
- −$115
- HOA
- −$85
- Vacancy / Maint / Mgmt
- −$471
- Net cashflow
- $66
Break-even live
Sensitivity live
| Price | -10% $222 | -5% $144 | +0% $66 | +5% $-12 | +10% $-90 |
|---|---|---|---|---|---|
| Rent | -10% $-111 | -5% $-23 | +0% $66 | +5% $155 | +10% $243 |
| Rate | -1.0pp $204 | -0.5pp $136 | base $66 | +0.5pp $-5 | +1.0pp $-78 |
UW: 25.0% down · 7.5% · 30yr · 1.5% tax · 5.0% vac · 8.0% maint · 8.0% mgmt
Financing live
Cash to close
- Down payment
- $68,750
- Closing costs
- $8,250
- Reserves months
- —
- Total cash needed
- —
Loan-product check · same deal, 3 products live
Conventional
25% down · 7.5% · 30yr
- Down + closing
- —
- Monthly P&I
- —
- Monthly cashflow
- —
- DSCR
- —
- Eligible?
- —
Personal DTI + credit; lowest rate.
DSCR
20% down · 8.5% · 30yr
- Down + closing
- —
- Monthly P&I
- —
- Monthly cashflow
- —
- DSCR
- —
- Eligible?
- —
No personal income docs; deal must DSCR.
Hard money
10% down · 12.0% · 12mo
- Down + closing
- —
- Monthly P&I
- —
- Monthly cashflow
- —
- DSCR
- —
- Eligible?
- —
Short-term bridge; refi at stabilization.
Rent comps 3 comps
| Address | Beds | Baths | Sqft | Rent | $/sqft | DOM | Units | Dist |
|---|---|---|---|---|---|---|---|---|
| 289 Highpoint Dr Diamondhead, MS | 2.0 | 2.5 | 1340 | $1,700 | $1.27 | 15d | 1 | 0.94mi |
| 250 Highpoint Dr Unit 250 Diamondhead, MS | 2.0 | 2.5 | 1367 | $2,500 | $1.83 | 23d | 1 | 1.00mi |
| 250 Highpoint Dr Diamondhead, MS | 2.0 | 2.5 | 1367 | $2,500 | $1.83 | 45d | 1 | 1.00mi |
HOA detail
- Monthly dues
- $85 · $1,020/yr
Listing history 13 events
-
2026-06-21days on market $275,000 Active 17 DOM
-
2026-06-18days on market $275,000 Active 14 DOM
-
2026-06-17days on market $275,000 Active 13 DOM
-
2026-06-16days on market $275,000 Active 12 DOM
-
2026-06-15days on market $275,000 Active 11 DOM
-
2026-06-14days on market $275,000 Active 9 DOM
-
2026-06-13days on market $275,000 Active 8 DOM
-
2026-06-10days on market $275,000 Active 6 DOM
-
2026-06-09days on market $275,000 Active 5 DOM
-
2026-06-08days on market $275,000 Active 4 DOM
-
2026-06-07days on market $275,000 Active 3 DOM
-
2026-06-05remarks 344-char remark
-
2026-06-05$275,000 Active 1 DOM
ⓘ Source: listings_history table (triggers on properties + properties_extension) + one-shot
backfill from property_details.listing_events for pre-trigger history.
Tax reassessment forecast MS · Resets to sale price
- Current annual tax
- $781 · $65/mo
- Projected year-2 tax
- $2,172 · $181/mo
- Expected delta
- +$1,391/yr (+$116/mo · 178.1%)
ⓘ Screening estimate from a state-policy table — verify with the county assessor before closing.
Climate risk First Street
- Flood 4/10 Moderate FEMA zone X (unshaded) · 24% chance over 30 yrs
- Wildfire 6/10 Major
- Heat 10/10 Extreme 7 d/yr ≥107°F today · 22 d/yr by 30 yrs out
- Wind 9/10 Extreme 99% chance of damaging wind over 30 yrs
- Air quality 1/10 Low 0 unhealthy d/yr today · 0 by 30 yrs out
Nearby sold comps map
Loading sold comps map…
Walkable amenities ~0.75 mi
Loading nearby amenities…
Taxation est. · year 1
- Rental income
- $26,927
- − Mortgage interest
- −$15,404
- − Property taxes
- −$781
- − Insurance
- −$1,375
- − Repairs & maintenance
- −$2,154
- − Management
- −$2,154
- − HOA
- −$1,020
- − Depreciation
- −$8,000
- Taxable loss
- −$3,962
- Est. tax savings @ 24.0%
- +$951
- After-tax cash flow
- $1,742/yr
For passive investors: Depreciation is non-cash, so a rental often shows a tax loss while cash-flowing — sheltering income. Rental losses are passive: they offset passive income freely, and up to $25,000/yr can offset ordinary (W-2) income if you actively participate and your MAGI is under $100k (phasing out to $0 by $150k); unused losses carry forward. On sale, claimed depreciation is recaptured at up to 25%, and gains may owe capital-gains tax (a 1031 exchange can defer both). Figures are a year-1 estimate at your 24.0% rate — not tax advice; consult a CPA.
Schools (NCES district)
- District
- Hancock County School District
- NCES district ID
- 2801740
- Math proficiency
- 47% ▼ -11.00%
- Reading proficiency
- 44% ▼ -9.00%
- Median HH income
- $47,971
- Composite
- 38.88/100
- National rank
- #4099
- State rank
- #23 of 130 in MS
Livability — Diamondhead
- Score
- 68/100
- State rank
- #59
- US rank
- #9320
Category grades
Schools grade is shown separately in the Schools card above.
Census & demographics
- Census place
- Diamondhead, MS
- County
- Hancock County · 9,338 people
- City population
- 9,338
- Metro
- Gulfport-Biloxi, MS
- Population (ZIP)
- 9,338
- Household income
- $87,407
- Rent vs Own
Population outlook (Hancock County) Hauer SSP2
- Today (2025)
- 52,161 people
- By 2030
- 54,753 · +5.0%
- By 2040
- 59,242 · +13.6%
- By 2050
- 62,417 · +19.7%
- By 2075
- 68,168 · +30.7%
- By 2100
- 69,212 · +32.7%
Race, ethnicity, and origin ACS 2023
- Neighborhood character
- Predominantly White (85%)
- Race & ethnicity
- White 85% Two or more races 9% Hispanic / Latino 8% Black 2%
- Hispanic origin (detail)
- Mexican 5%
- Common ancestry
- Lithuanian 10% Slovak 3% Romanian 2%
- Foreign-born
- 3% · Canada
- Languages at home
- 94% English-only · Spanish 4% French/Haitian/Cajun 1% Other Indo-European 1%
Political lean MEDSL · Hancock
- 2024 margin
- Solid R (+58.7) · D 20.1% · R 78.8% · Other 1.1%
- 2008→2024 swing
- -4.4pp toward R · 2008: -54.2pp · 2024: -58.7pp
- All cycles
- 2024: R+58.7 2020: R+55.5 2016: R+59.4 2012: R+52.8 2008: R+54.2
Not yet ingested
- Civics
- —
Market trends
- HPI YoY
- ▼ -45.77%
- Current HPI
- 193.4883
- Rent YoY
- —
- Metro
- Gulfport-Biloxi, MS
- State GDP YoY
- —
- F500 in state
- 0
Price history
+2015.4% since first listed6 events — show timeline
- 2026-06-04 Listed $275,000 MLSU
- 2007-04-26 Sold (Public Records) — Public Records
- 2007-04-13 Sold (MLS) — MLSU
- 2007-01-26 Listed $249,900 MLSU
- 2006-09-15 Sold (MLS) — MLSU
- 2006-07-29 Listed $13,000 MLSU
Property tax history
+1.2%/yrLatest (2025): $781 · +0.0% YoY. Source: county tax records.
Cash-flow waterfall
monthlySold comps — $/sqft
last 12 mo · ≤1 miLoading sold comps…