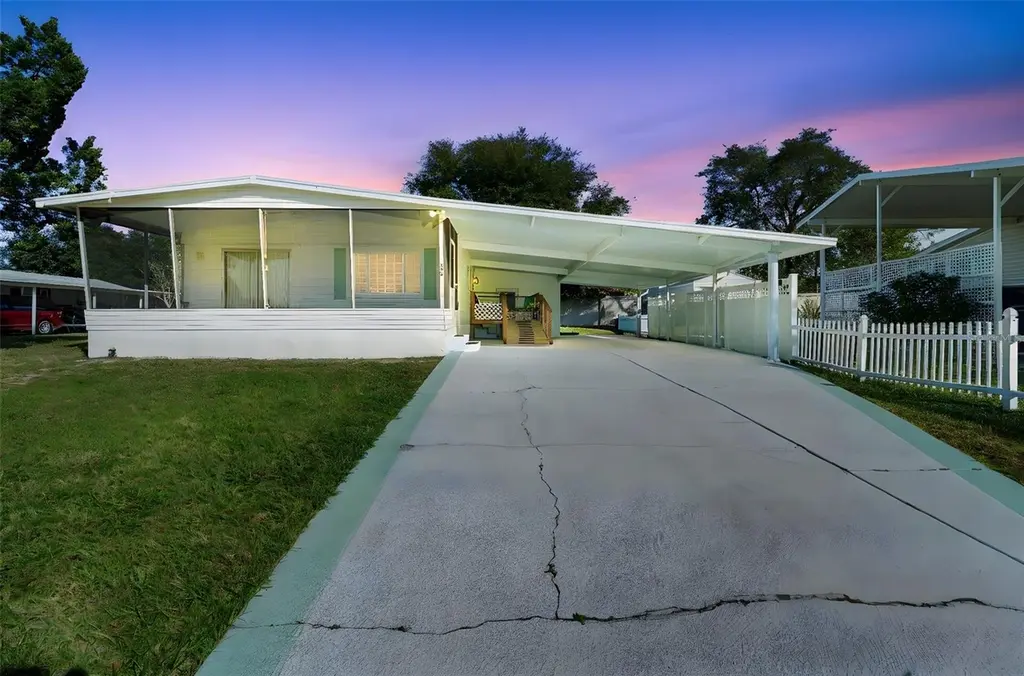
105 Florence Blvd · DeBary, FL
Flood risk 1/10 · Minimal
- FEMA flood zone
- X (unshaded)
- Chance of flooding over 30 yrs
- 0.0%
- Est. flood insurance / yr
- $507 – $1,088
Fire risk 4/10 · Minor
- Est. fire insurance / yr
- $947 – $1,759
Heat risk 9/10 · Severe
- Hot days now (above 108°F)
- 7 days/yr
- Hot days in 30 yrs
- 20 days/yr
Wind risk 9/10 · Severe
- Chance of severe wind over 30 yrs
- 99.0%
Air-quality risk 2/10 · Minimal
- Unhealthy air days now
- 1 days/yr
- Unhealthy air days in 30 yrs
- 1 days/yr
Risk factors via First Street. Map © Google.
Why this score? — see what drove the C- grade
The composite is a weighted blend of 9 inputs, each scored 0–100. Each bar is that input's sub-score; the figure is the points it added to the 100-point composite (weight × sub-score).
- Cash flow +20.6/30.0
- ARV discount +7.5/15.0
- DSCR +6.5/10.0
- 1% rule +4.3/10.0
- Schools +3.9/10.0
- Livability +3.7/5.0
- Rent growth +3.0/5.0
- Condition / age +2.5/5.0
- Appreciation +0.0/10.0
$189,000
🖨 Deal sheet 📄 Offer letter ✓ Due diligence
Listing remarks
Price Adjustment! This well-maintained 2-bedroom, 2-bath home is in the Terra Alta Community of Debary. The home features a spacious living room filled with natural light, ample closet space throughout including a double door pantry in the kitchen, plus additional cabinets and built-in buffet in the dining area, along with a large screen front porch, carport, laundry room and storage shed for added convenience. A few updates include new roof 2025, new Kitchen cabinets, counter tops and appliances, & recently painted throughout. With an optional HOA, you’ll enjoy the flexibility of a minimal fee while still benefiting from a well-kept community. Ideally located near shopping, dini
Key facts
- Built-in buffet
- Laundry room
- Natural light
Tags
Property features AI
Finance
- HOA & community: Has HOA (optional; $225 annually / $18.75 monthly); Community clubhouse; Community pool; Pets allowed; Development: Terra Alta
Exterior
- Parking: Carport (1 space)
- Utilities: Public water; Public sewer; Electricity connected; Broadband/high-speed internet available
- Home design: Residential mobile home (double wide); One story; Faces west; Entry on front
- Construction: Metal siding; Metal roof; Crawlspace foundation; Built as double wide
- Exterior features: Covered front porch; Screened porch; Exterior lighting; Sliding doors; Storage shed; Cleared lot; Asphalt/paved road (public maintained)
Interior
- Kitchen: Dishwasher; Range; Range hood; Microwave; Refrigerator; Electric water heater
- Bedrooms: 2 bedrooms
- Flooring: Tile
- Bathrooms: 2 full bathrooms
- Heating & cooling: Central heating; Central air conditioning
- Interior features: Ceiling fans; Living room/dining room combo; Walk-in closets; Blinds
- Laundry & utility: Laundry room; Washer; Dryer
Neighborhood map
What this means for you Summary
Snapshot
- This is a 2-bed/2.0-bath manufactured listed at $189k.
Deal economics
- At list price, monthly cash flow is $252 ($3k/yr) — positive.
- The deal already cash-flows at list — no discount required.
- To meet the 1% rule (rent ≥ 1% of price), the offer needs to be $176k (6.8% below list).
- Recommended offer: $166k (12.0% below list) — sets the bar for market timing.
- Cap rate 7.9% vs local median 3.8% in DeBary — top-decile yield for the area; either an underpriced asset or a hidden risk that comps aren't pricing in. Stress-test before assuming the spread holds.
Location & tenants
- Location reads 73/100 on livability (#312 in FL) — a middle-class / working-renter tenant base. Strengths: employment A+, housing A+, crime A-; Watch: amenities F, commute F, health & safety D-.
- Volusia (suburban): math 44% / reading 49% proficiency, ranked #47 of 73 in FL (top 64%) — families likely to look elsewhere, expect single-tenant / working-renter base with shorter leases.
- Market conditions: Rents rising (+1.9%/yr); 273 active listings in the ZIP; 3 comparable units currently listed for rent nearby; rentals leasing fast (median 12d on market — plan ~1-2 weeks tenant-placement turnaround); solid renter incomes; 3,402 units permitted in Volusia County in 2024 (681 in 5+ unit buildings).
Forward outlook
- Local home prices are declining (-3.0%/yr); year-one equity from $1k of loan paydown is wiped out by about $6k of value loss. Plan a longer hold.
- Volusia County population projected at +19% by 2050 — long-run rental-demand tailwind backs the buy-and-hold thesis.
Negotiation context
- It's been on market 209 days — a 12% lower offer ($166k) is reasonable based on typical stale-listing flexibility.
- 4 sale attempts since 10y ago; this cycle's ask has dropped $30k (14%) from the opening price — seller is motivated, your offer sets the floor, not the list.
- Current owner paid $80k; list at $189k implies a 136% gain — meaningful room to come down on a strong offer.
Risks & watch-outs
- Climate carrying-cost: severe wind risk, 99% chance of damaging wind over 30y; extreme-heat days projected 7→20/yr by 2055 (HVAC capex compounding) — expect insurance premiums to compound above CPI over the hold.
Questions for the listing agent
- It's been on market 209 days. Have you received any prior offers? Is the seller open to a 12% concession, seller financing, or rate buy-down credit?
- Built in 1973 — when were the roof, HVAC, electrical panel, plumbing, and water heater last replaced?
- What does the HOA fee cover, when was the last increase, and are there any pending special assessments or reserve-fund shortfalls?
- Why hasn't it sold? Are there any deal-killer items the seller is aware of (foundation, flood, title, zoning, code violations)?
- Is there a deadline driving the sale (1031 exchange, divorce, estate, relocation)? That informs how much negotiation room exists.
- Schools are B-rated — typically a magnet for longer-tenancy family renters. What's the average tenant stay here, and is there a school-zone premium baked into asking?
- What's the average days-on-market for RENTAL listings here right now (not sales)? A rising rental-DOM trend means longer vacancies and softer asking-rent achievability than the comps imply.
- What's the recent tenant-quality profile in this submarket — average credit score on applications, eviction rate, late-payment / NSF rate, and stable-employment percentage? A property-management company in the area should have these aggregated.
- How much new for-sale + rental construction is in the pipeline within 1–3 miles? Heavy new supply typically softens prices + rents 12–24 months out; constrained supply supports both.
Investment metrics
- 1% rule
- 0.93% ✗
- Cap rate
- 7.89%
- Cash-on-cash
- 5.72%
- DSCR
- 1.25
- GRM
- 8.9
CMA / ARV
No comps found within radius.
Projected returns pro-forma
-3.0% appreciation · 1.89% rent growth · sell at horizon
- IRR
- -8.6%
- Equity multiple
- 0.69×
- Total profit
- $-16,585
- Equity at exit
- $28,181
- IRR
- -0.5%
- Equity multiple
- 0.96×
- Total profit
- $-1,876
- Equity at exit
- $16,341
Cash invested: $52,920 (down + closing). Projections, not guarantees.
Landlord ↔ Tenant lean methodology
- Overall (STATE)
- 87 Strongly Landlord-Friendly
- State Florida
- 87 Strongly Landlord-Friendly · R+3
- County
- — inherits STATE
- City
- — inherits STATE
ZIP-level market 32713
- Rents YoY
- 1.9%
- Active inventory
- 273
- Price-to-rent
- 8.9×
Monthly cashflow live
- Estimated rent
- $1,762 medium interval (Pro) →
- Mortgage (P&I)
- −$991
- Tax from tax record
- −$52 /mo · $622/yr
- Insurance
- −$79
- HOA
- −$18
- Vacancy / Maint / Mgmt
- −$370
- Net cashflow
- $252
Break-even live
UW: 25.0% down · 7.5% · 30yr · 1.5% tax · 5.0% vac · 8.0% maint · 8.0% mgmt
Financing live
Cash to close
- Down payment
- $47,250
- Closing costs
- $5,670
- Reserves months
- —
- Total cash needed
- —
Loan-product check · same deal, 3 products live
Conventional
25% down · 7.5% · 30yr
- Down + closing
- —
- Monthly P&I
- —
- Monthly cashflow
- —
- DSCR
- —
- Eligible?
- —
Personal DTI + credit; lowest rate.
DSCR
20% down · 8.5% · 30yr
- Down + closing
- —
- Monthly P&I
- —
- Monthly cashflow
- —
- DSCR
- —
- Eligible?
- —
No personal income docs; deal must DSCR.
Hard money
10% down · 12.0% · 12mo
- Down + closing
- —
- Monthly P&I
- —
- Monthly cashflow
- —
- DSCR
- —
- Eligible?
- —
Short-term bridge; refi at stabilization.
Rent comps 3 comps
| Address | Beds | Baths | Sqft | Rent | $/sqft | DOM | Units | Dist |
|---|---|---|---|---|---|---|---|---|
| 741 Saxon Blvd Orange City, FL | 1.0–2.0 | 1.0–2.0 | 1031 | $1,745 | $1.69 | 11d | 20 | 0.31mi |
| 2317 S Volusia Ave Orange City, FL | 1.0–2.0 | 1.0 | 720 | $1,435 | $1.99 | 14d | 5 | 0.79mi |
| 2500 Junior St Orange City, FL | 1.0–2.0 | 1.0–2.0 | 990 | $1,699 | $1.72 | 11d | 10 | 0.85mi |
HOA detail
- Monthly dues
- $18 · $216/yr
Listing history 29 events
-
2026-06-18days on market $189,000 Active 209 DOM
-
2026-06-17days on market $189,000 Active 208 DOM
-
2026-06-16days on market $189,000 Active 207 DOM
-
2026-06-15days on market $189,000 Active 206 DOM
-
2026-06-14days on market $189,000 Active 204 DOM
-
2026-06-10days on market $189,000 Active 201 DOM
-
2026-06-09days on market $189,000 Active 200 DOM
-
2026-06-08days on market $189,000 Active 199 DOM
-
2026-06-07days on market $189,000 Active 198 DOM
-
2026-06-05days on market $189,000 Active 195 DOM
-
2026-06-03days on market $189,000 Active 194 DOM
-
2026-06-03days on market $189,000 Active 193 DOM
-
2026-06-01days on market $189,000 Active 192 DOM
-
2026-05-31days on market $189,000 Active 191 DOM
-
2026-05-31days on market $189,000 Active 190 DOM
-
2026-05-21status Active
-
2026-05-14historical
-
2026-03-05price $189,000
-
2026-01-07price $209,000
-
2025-11-14$219,000 Active
-
2017-09-07soldstatus $80,000
-
2016-10-21status Pending
-
2016-10-17historical
-
2016-09-23price $79,900
-
2016-09-21price $75,000
-
2016-09-07price $79,900
-
2016-08-26status Active
-
2016-08-18status Pending
-
2016-08-10$85,000 Active
ⓘ Source: listings_history table (triggers on properties + properties_extension) + one-shot
backfill from property_details.listing_events for pre-trigger history.
Tax reassessment forecast FL · Resets to sale price
- Current annual tax
- $622 · $52/mo
- Projected year-2 tax
- $1,569 · $131/mo
- Expected delta
- +$946/yr (+$79/mo · 152.1%)
ⓘ Screening estimate from a state-policy table — verify with the county assessor before closing.
Climate risk First Street
- Flood 1/10 Low FEMA zone X (unshaded) · 0% chance over 30 yrs
- Wildfire 4/10 Moderate
- Heat 9/10 Extreme 7 d/yr ≥108°F today · 20 d/yr by 30 yrs out
- Wind 9/10 Extreme 99% chance of damaging wind over 30 yrs
- Air quality 2/10 Low 1 unhealthy d/yr today · 1 by 30 yrs out
Nearby sold comps map
Loading sold comps map…
Walkable amenities ~0.75 mi
Loading nearby amenities…
Taxation est. · year 1
- Rental income
- $21,144
- − Mortgage interest
- −$10,587
- − Property taxes
- −$622
- − Insurance
- −$945
- − Repairs & maintenance
- −$1,691
- − Management
- −$1,691
- − HOA
- −$216
- − Depreciation
- −$5,498
- Taxable loss
- −$108
- Est. tax savings @ 24.0%
- +$26
- After-tax cash flow
- $3,052/yr
For passive investors: Depreciation is non-cash, so a rental often shows a tax loss while cash-flowing — sheltering income. Rental losses are passive: they offset passive income freely, and up to $25,000/yr can offset ordinary (W-2) income if you actively participate and your MAGI is under $100k (phasing out to $0 by $150k); unused losses carry forward. On sale, claimed depreciation is recaptured at up to 25%, and gains may owe capital-gains tax (a 1031 exchange can defer both). Figures are a year-1 estimate at your 24.0% rate — not tax advice; consult a CPA.
Schools (NCES district)
- District
- Volusia
- NCES district ID
- 1201920
- Math proficiency
- 44% ▼ -9.00%
- Reading proficiency
- 49% ▼ -3.00%
- Median HH income
- $42,946
- Composite
- 39.2/100
- National rank
- #4019
- State rank
- #47 of 73 in FL
Livability — DeBary
- Score
- 73/100
- State rank
- #312
- US rank
- #5314
Category grades
Schools grade is shown separately in the Schools card above.
Census & demographics
- Census place
- DeBary, FL
- County
- Volusia County · 556,871 people
- City population
- 22,884
- Metro
- Deltona-Daytona Beach-Ormond Beach, FL
- Population (ZIP)
- 22,884
- Household income
- $88,500
- Rent vs Own
- Severe rent burden
- 265.0
Population outlook (Volusia County) Hauer SSP2
- Today (2025)
- 572,749 people
- By 2030
- 598,695 · +4.5%
- By 2040
- 644,880 · +12.6%
- By 2050
- 681,451 · +19.0%
- By 2075
- 759,957 · +32.7%
- By 2100
- 778,902 · +36.0%
Race, ethnicity, and origin ACS 2023
- Neighborhood character
- Predominantly White (73%)
- Race & ethnicity
- White 73% Hispanic / Latino 17% Two or more races 6% Black 5% Asian 3%
- Hispanic origin (detail)
- Mexican 1% Puerto Rican 10% Cuban 1%
- Common ancestry
- Lithuanian 2% Romanian 2% Serbian 2%
- Foreign-born
- 8% · Canada, Vietnam, South Korea
- Languages at home
- 87% English-only · Spanish 10% Vietnamese 2% Other Indo-European 1%
Political lean MEDSL · Volusia
- 2024 margin
- Strong R (+21.8) · D 38.7% · R 60.5%
- 2008→2024 swing
- -27.4pp toward R · 2008: 5.7pp · 2024: -21.8pp
- All cycles
- 2024: R+21.8 2020: R+14.1 2016: R+13.1 2012: R+1.2 2008: D+5.7
Not yet ingested
- Civics
- —
Market trends
- HPI YoY
- ▼ -247.35%
- Current HPI
- 294.803
- Rent YoY
- ▲ 1.89%
- Metro
- Deltona-Daytona Beach-Ormond Beach, FL
- State GDP YoY
- ▲ 3.28%
- F500 in state
- 36
Industry mix (Fortune 500 HQ in FL)
| Industry | F500 HQs | Revenue |
|---|---|---|
| Industrial Technology | 2 | $29B |
|
||
| Insurance | 2 | $17B |
|
||
| Retail | 1 | $60B |
|
||
| Technology Distribution | 1 | $58B |
|
||
| Homebuilding | 1 | $35B |
|
||
| Technology Manufacturing | 1 | $35B |
|
||
Price history
+122.4% since first listed14 events — show timeline
- 2026-05-21 Relisted — Stellar MLS as Distributed by MLS Grid
- 2026-05-14 Listing Removed — Stellar MLS as Distributed by MLS Grid
- 2026-03-05 Price Changed $189,000 Stellar MLS as Distributed by MLS Grid
- 2026-01-07 Price Changed $209,000 Stellar MLS as Distributed by MLS Grid
- 2025-11-14 Listed $219,000 Stellar MLS as Distributed by MLS Grid
- 2017-09-07 Sold (Public Records) $80,000 Public Records
- 2016-10-21 Pending — Stellar MLS as Distributed by MLS Grid
- 2016-10-17 Listing Removed — Stellar MLS as Distributed by MLS Grid
- 2016-09-23 Price Changed $79,900 Stellar MLS as Distributed by MLS Grid
- 2016-09-21 Price Changed $75,000 Stellar MLS as Distributed by MLS Grid
- 2016-09-07 Price Changed $79,900 Stellar MLS as Distributed by MLS Grid
- 2016-08-26 Relisted — Stellar MLS as Distributed by MLS Grid
- 2016-08-18 Pending — Stellar MLS as Distributed by MLS Grid
- 2016-08-10 Listed $85,000 Stellar MLS as Distributed by MLS Grid
Property tax history
+9.4%/yrLatest (2025): $622 · +10.4% YoY. Source: county tax records.
Cash-flow waterfall
monthlySold comps — $/sqft
last 12 mo · ≤1 miLoading sold comps…