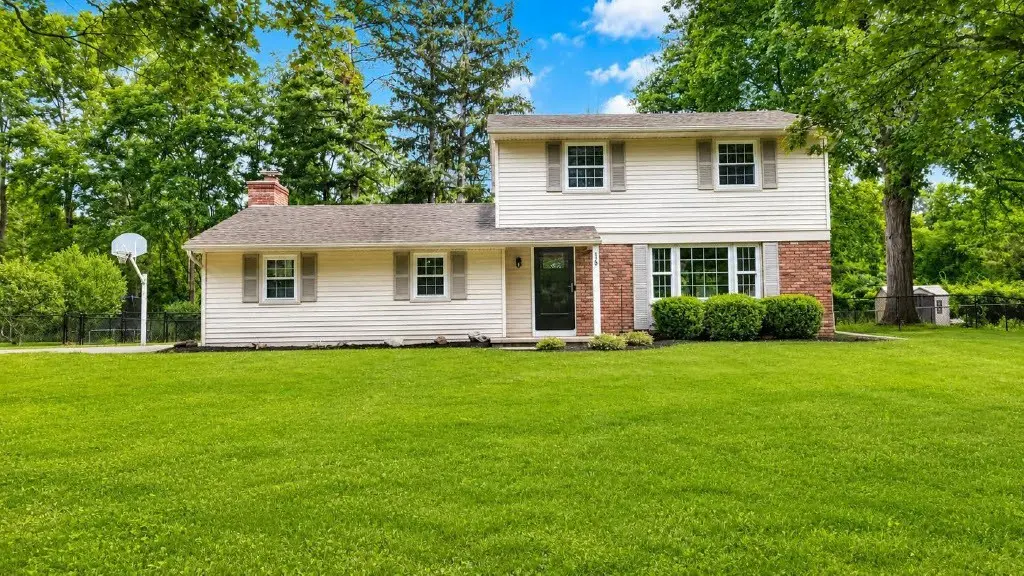
120 Benedict Rd · East Rochester, NY
Flood risk 1/10 · Minimal
- FEMA flood zone
- X (unshaded)
- Chance of flooding over 30 yrs
- 0.0%
- Est. flood insurance / yr
- $473 – $860
Fire risk 3/10 · Minor
- Est. fire insurance / yr
- $691 – $1,283
Heat risk 2/10 · Minimal
- Hot days now (above 96°F)
- 7 days/yr
- Hot days in 30 yrs
- 16 days/yr
Wind risk 1/10 · Minimal
- Chance of severe wind over 30 yrs
- —
Air-quality risk 2/10 · Minimal
- Unhealthy air days now
- 1 days/yr
- Unhealthy air days in 30 yrs
- 2 days/yr
Risk factors via First Street. Map © Google.
Why this score? — see what drove the C grade
The composite is a weighted blend of 9 inputs, each scored 0–100. Each bar is that input's sub-score; the figure is the points it added to the 100-point composite (weight × sub-score).
- Cash flow +16.5/30.0
- ARV discount +15.0/15.0
- Schools +7.5/10.0
- 1% rule +5.6/10.0
- DSCR +5.1/10.0
- Livability +3.9/5.0
- Rent growth +2.5/5.0
- Condition / age +2.5/5.0
- Appreciation +0.0/10.0
$274,900
🖨 Deal sheet 📄 Offer letter ✓ Due diligence
Listing remarks MLS
Beautiful colonial with many upgrades! Gleaming hardwood floors, large living room opens to dining room. Eat in kitchen with Omega cabinetry. Huge family room with fireplace. Sliding glass door to fully fenced back yard with patio. Powder room on main level. Upstairs features 3 bedrooms and an updated main bathroom. New roof 2017. Water heater 2017. Windows replaced in 2015. Upgraded vented glass block windows in basement. Upgraded 200 amp service. Attached one car garage with storage space. So much to offer!!
Key facts
- Eat-in area
- Brick fireplace
- Pittsford schools
Tags
Property features AI
Exterior
- Parking: Attached garage with 1 garage space; Garage with electricity and garage door opener
- Utilities: Electricity connected (circuit breakers); Public water connected; Septic tank; High-speed internet available; Cable available
- Home design: 2-story house; Existing/resale property; Asphalt shingle roof
- Construction: Vinyl siding; Copper plumbing; Block foundation
- Exterior features: Blacktop driveway; Fully fenced yard (full fencing); Rectangular residential lot; 115 x 147 lot dimensions; City street frontage
Interior
- Kitchen: Dishwasher; Disposal; Gas oven; Gas range; Microwave; Refrigerator; Pantry; Eat-in kitchen
- Bedrooms: Total rooms: 7 (includes living spaces and bedrooms)
- Flooring: Carpet; Ceramic tile; Varied flooring
- Bathrooms: 1 full bathroom; 1 half bathroom; One main-level bathroom
- Heating & cooling: Gas forced-air heating; Central air conditioning; Attic fan
- Interior features: Finished basement with sump pump; Separate/formal dining room; Eat-in kitchen; Separate/formal living room; Combined living/dining room; Pantry; Programmable thermostat; Thermal windows; Fireplace (1)
- Laundry & utility: Washer; Dryer; Laundry located in basement; Humidifier; Generator
Neighborhood map
What this means for you Summary
Snapshot
- This is a 3-bed/1.5-bath single-family listed at $275k.
Deal economics
- At list price, monthly cash flow is $162 ($2k/yr) — positive.
- The deal already cash-flows at list — no discount required.
- Meets the 1% rule at list price ($3k rent vs $275k).
- Cap rate 7.0% vs local median 4.5% in East Rochester — top-decile yield for the area; either an underpriced asset or a hidden risk that comps aren't pricing in. Stress-test before assuming the spread holds.
Location & tenants
- Location reads 78/100 on livability (#155 in NY, #2,400 nationally) — a middle-class / working-renter tenant base. Strengths: amenities A+, cost of living A+, housing A+; Watch: employment D+, crime D.
- Pittsford Central School District (suburban): math 80% / reading 84% proficiency, ranked #34 of 590 in NY (top 6%) — strong family-tenant draw, lease renewals of 3-5y typical; only 2% free/reduced lunch — higher-income household profile.
- Market conditions: 186 active listings in the ZIP; 3 comparable units currently listed for rent nearby; rentals at typical pace (median 19d on market — plan ~3-4 weeks tenant-placement turnaround); high-income renter base; 1,169 units permitted in Monroe County in 2024 (591 in 5+ unit buildings).
Forward outlook
- Local home prices are declining (-3.0%/yr); year-one equity from $2k of loan paydown is wiped out by about $8k of value loss. Plan a longer hold.
- Monroe County population projected to shrink 6% by 2050 — rents likely to lag national; underwrite the cash flow, not the appreciation.
Negotiation context
- Only 5 days on market — expect competitive offers; lowballing is unlikely to land.
- 5 sale attempts since 14y ago with the ask held roughly flat each time — persistent listings suggest the price (not the market) is what's stuck; bring a comps-based counter.
- Current owner paid $219k; 26% above their basis — modest negotiation headroom, anchor on the comps not their cost.
Risks & watch-outs
- Watch-outs: property tax is 2.6% of price.
Questions for the listing agent
- Built in 1964 — when were the roof, HVAC, electrical panel, plumbing, and water heater last replaced?
- Property tax is high relative to price — has the assessment been appealed recently, and will the sale trigger a re-assessment?
- Is there a deadline driving the sale (1031 exchange, divorce, estate, relocation)? That informs how much negotiation room exists.
- Schools are A-rated — typically a magnet for longer-tenancy family renters. What's the average tenant stay here, and is there a school-zone premium baked into asking?
- Crime grade is D in this area — have there been break-ins, vandalism, or insurance claims at this property in the last 3 years? What carrier currently insures it and at what premium?
- What's the average days-on-market for RENTAL listings here right now (not sales)? A rising rental-DOM trend means longer vacancies and softer asking-rent achievability than the comps imply.
- What's the recent tenant-quality profile in this submarket — average credit score on applications, eviction rate, late-payment / NSF rate, and stable-employment percentage? A property-management company in the area should have these aggregated.
- How much new for-sale + rental construction is in the pipeline within 1–3 miles? Heavy new supply typically softens prices + rents 12–24 months out; constrained supply supports both.
Investment metrics
- 1% rule
- 1.06% ✓
- Cap rate
- 7.00%
- Cash-on-cash
- 2.53%
- DSCR
- 1.11
- GRM
- 7.9
CMA / ARV
- ARV (on-the-fly)
- $412,190
- Comps found
- 12
Show comp detail 12 sales within ~0.75 mi
| Address | Dist | Beds/Ba | Sqft | Sold | Price | $/sf | Match |
|---|---|---|---|---|---|---|---|
| 9 Rollingwood Dr | 0.27mi | 4/3.0 (+1) | 1,782 (+2%) | 15mo | $335,000 | $188 | 61 |
| 28 Little Brook Dr | 0.28mi | 3/2.0 | 1,582 (-10%) | 10mo | $315,000 | $199 | 60 |
| 6 Springwood Ln | 0.17mi | 3/1.5 | 1,975 (+13%) | 15mo | $465,000 | $235 | 59 |
| 213 Ayrault Rd | 0.70mi | 2/2.0 (-1) | 1,768 (+1%) | 3mo | $490,213 | $277 | 56 |
| 16 Oakwood Ln | 0.37mi | 4/2.5 (+1) | 1,864 (+6%) | 10mo | $488,000 | $262 | 55 |
| 44 Cullens Run | 0.44mi | 4/2.0 (+1) | 1,622 (-8%) | 6mo | $330,000 | $203 | 55 |
| 9 Springwood Ln | 0.15mi | 4/2.0 (+1) | 2,007 (+14%) | 9mo | $290,000 | $144 | 54 |
| 40 Smallwood Dr | 0.48mi | 4/1.5 (+1) | 1,954 (+11%) | 1mo | $475,000 | $243 | 53 |
| 6 Peachtree Ln | 0.64mi | 3/1.5 | 1,808 (+3%) | 15mo | $390,250 | $216 | 53 |
| 17 Butternut Dr | 0.74mi | 3/1.5 | 1,575 (-10%) | 1mo | $400,000 | $254 | 48 |
| 21 Little Brook Dr | 0.38mi | 2/2.5 (-1) | 1,492 (-15%) | 14mo | $386,200 | $259 | 37 |
| 16 Cullens Run | 0.67mi | 4/2.0 (+1) | 1,492 (-15%) | 2mo | $349,900 | $235 | 35 |
Match score weights: distance 35% · size 25% · config 20% · recency 20%. Top-matched comps best support the ARV.
Projected returns pro-forma
-3.0% appreciation · 3.0% rent growth · sell at horizon
- IRR
- -12.2%
- Equity multiple
- 0.56×
- Total profit
- $-34,006
- Equity at exit
- $40,988
- IRR
- -3.0%
- Equity multiple
- 0.80×
- Total profit
- $-15,507
- Equity at exit
- $23,768
Cash invested: $76,972 (down + closing). Projections, not guarantees.
Landlord ↔ Tenant lean methodology
- Overall (STATE)
- 15 Strongly Tenant-Friendly
- State New York
- 15 Strongly Tenant-Friendly · D+10
- County
- — inherits STATE
- City
- — inherits STATE
ZIP-level market 14534
- Active inventory
- 186
- Price-to-rent
- 7.9×
Monthly cashflow live
- Estimated rent
- $2,915 medium interval (Pro) →
- Mortgage (P&I)
- −$1,442
- Tax from tax record
- −$584 /mo · $7,010/yr
- Insurance
- −$115
- HOA
- −$0
- Vacancy / Maint / Mgmt
- −$612
- Net cashflow
- $162
Break-even live
UW: 25.0% down · 7.5% · 30yr · 1.5% tax · 5.0% vac · 8.0% maint · 8.0% mgmt
Financing live
Cash to close
- Down payment
- $68,725
- Closing costs
- $8,247
- Reserves months
- —
- Total cash needed
- —
Loan-product check · same deal, 3 products live
Conventional
25% down · 7.5% · 30yr
- Down + closing
- —
- Monthly P&I
- —
- Monthly cashflow
- —
- DSCR
- —
- Eligible?
- —
Personal DTI + credit; lowest rate.
DSCR
20% down · 8.5% · 30yr
- Down + closing
- —
- Monthly P&I
- —
- Monthly cashflow
- —
- DSCR
- —
- Eligible?
- —
No personal income docs; deal must DSCR.
Hard money
10% down · 12.0% · 12mo
- Down + closing
- —
- Monthly P&I
- —
- Monthly cashflow
- —
- DSCR
- —
- Eligible?
- —
Short-term bridge; refi at stabilization.
Rent comps 3 comps
| Address | Beds | Baths | Sqft | Rent | $/sqft | DOM | Units | Dist |
|---|---|---|---|---|---|---|---|---|
| 6 Cullens Run Pittsford, NY | 4.0 | 2.0 | 1300 | $3,000 | $2.31 | 44d | 1 | 0.78mi |
| 1474 Marsh Rd Pittsford, NY | 2.0 | 1.5 | 1450 | $2,995 | $2.07 | 19d | 1 | 0.78mi |
| 437 Ayrault Rd Fairport, NY | 2.0 | 2.5 | 1424 | $2,750 | $1.93 | 14d | 1 | 1.18mi |
Listing history 6 events
-
2026-06-17status $274,900 Pending 5 DOM
-
2026-06-17days on market $274,900 Active 5 DOM
-
2026-06-16days on market $274,900 Active 4 DOM
-
2026-06-15days on market $274,900 Active 3 DOM
-
2026-06-13remarks 681-char remark
-
2026-06-13$274,900 Active 1 DOM
ⓘ Source: listings_history table (triggers on properties + properties_extension) + one-shot
backfill from property_details.listing_events for pre-trigger history.
Tax reassessment forecast NY · Partial reset (capped growth)
- Current annual tax
- $7,010 · $584/mo
- Projected year-2 tax
- $7,010 · $584/mo
- Expected delta
- $0/yr ($0/mo · 0.0%)
ⓘ Screening estimate from a state-policy table — verify with the county assessor before closing.
Climate risk First Street
- Flood 1/10 Low FEMA zone X (unshaded) · 0% chance over 30 yrs
- Wildfire 3/10 Moderate
- Heat 2/10 Low 7 d/yr ≥96°F today · 16 d/yr by 30 yrs out
- Wind 1/10 Low
- Air quality 2/10 Low 1 unhealthy d/yr today · 2 by 30 yrs out
Nearby sold comps map
Loading sold comps map…
Walkable amenities ~0.75 mi
Loading nearby amenities…
Taxation est. · year 1
- Rental income
- $34,980
- − Mortgage interest
- −$15,399
- − Property taxes
- −$7,010
- − Insurance
- −$1,374
- − Repairs & maintenance
- −$2,798
- − Management
- −$2,798
- − Depreciation
- −$7,997
- Taxable loss
- −$2,398
- Est. tax savings @ 24.0%
- +$575
- After-tax cash flow
- $2,525/yr
For passive investors: Depreciation is non-cash, so a rental often shows a tax loss while cash-flowing — sheltering income. Rental losses are passive: they offset passive income freely, and up to $25,000/yr can offset ordinary (W-2) income if you actively participate and your MAGI is under $100k (phasing out to $0 by $150k); unused losses carry forward. On sale, claimed depreciation is recaptured at up to 25%, and gains may owe capital-gains tax (a 1031 exchange can defer both). Figures are a year-1 estimate at your 24.0% rate — not tax advice; consult a CPA.
Schools (NCES district)
- District
- Pittsford Central School District
- NCES district ID
- 3623160
- Math proficiency
- 80% ▼ -4.00%
- Reading proficiency
- 84% ▲ 7.00%
- Median HH income
- $106,940
- Composite
- 74.75/100
- National rank
- #151
- State rank
- #34 of 590 in NY
Livability — East Rochester
- Score
- 78/100
- State rank
- #155
- US rank
- #2400
Category grades
Schools grade is shown separately in the Schools card above.
Census & demographics
- County
- Monroe County · 674,131 people
- City population
- 7,529
- Metro
- Rochester, NY
- Population (ZIP)
- 33,230
- Household income
- $143,694
- Rent vs Own
- Severe rent burden
- 398.0
Population outlook (Monroe County) Hauer SSP2
- Today (2025)
- 759,460 people
- By 2030
- 757,154 · -0.3%
- By 2040
- 740,644 · -2.5%
- By 2050
- 714,443 · -5.9%
- By 2075
- 645,883 · -15.0%
- By 2100
- 547,084 · -28.0%
Race, ethnicity, and origin ACS 2023
- Neighborhood character
- Predominantly White (81%)
- Race & ethnicity
- White 81% Asian 8% Two or more races 6% Hispanic / Latino 4% Black 2%
- Common ancestry
- Romanian 5% Italian 4% Lithuanian 3%
- Foreign-born
- 12% · Canada, China, South Korea
- Languages at home
- 87% English-only · Other Indo-European 3% Chinese 2% Spanish 2%
Political lean MEDSL · Monroe
- 2024 margin
- D (+19.1) · D 59.5% · R 40.5%
- 2008→2024 swing
- +1.4pp toward D · 2008: 17.7pp · 2024: 19.1pp
- All cycles
- 2024: D+19.1 2020: D+21.0 2016: D+14.1 2012: D+17.4 2008: D+17.7
Not yet ingested
- Civics
- —
Market trends
- HPI YoY
- ▼ -232.40%
- Current HPI
- 258.0726
- Rent YoY
- —
- Metro
- Rochester, NY
- State GDP YoY
- ▲ 2.60%
- F500 in state
- 92
Industry mix (Fortune 500 HQ in NY)
| Industry | F500 HQs | Revenue |
|---|---|---|
| Financial Services | 10 | $950B |
|
||
| Consumer Goods | 9 | $162B |
|
||
| Insurance | 4 | $225B |
|
||
| Telecommunications | 2 | $144B |
|
||
| Pharmaceuticals | 2 | $112B |
|
||
| Media / Entertainment | 2 | $69B |
|
||
Price history
+92.2% since first listed13 events — show timeline
- 2026-06-12 Listed $274,900 UNYREIS
- 2020-07-29 Sold (Public Records) $219,000 Public Records
- 2020-07-24 Sold (MLS) $219,000 UNYREIS
- 2020-05-25 Pending — UNYREIS
- 2020-05-20 Relisted — UNYREIS
- 2020-05-19 Pending — UNYREIS
- 2020-05-15 Listed $200,000 UNYREIS
- 2020-05-15 Listing Removed — UNYREIS
- 2020-05-07 Listed $225,000 UNYREIS
- 2012-10-05 Sold (MLS) $156,000 UNYREIS
- 2012-10-04 Sold (Public Records) $156,000 Public Records
- 2012-08-20 Listed $154,900 UNYREIS
- 2009-10-30 Sold (Public Records) $143,000 Public Records
Property tax history
+3.2%/yrLatest (2025): $7,010 · -1.0% YoY. Source: county tax records.
Cash-flow waterfall
monthlySold comps — $/sqft
last 12 mo · ≤1 miLoading sold comps…