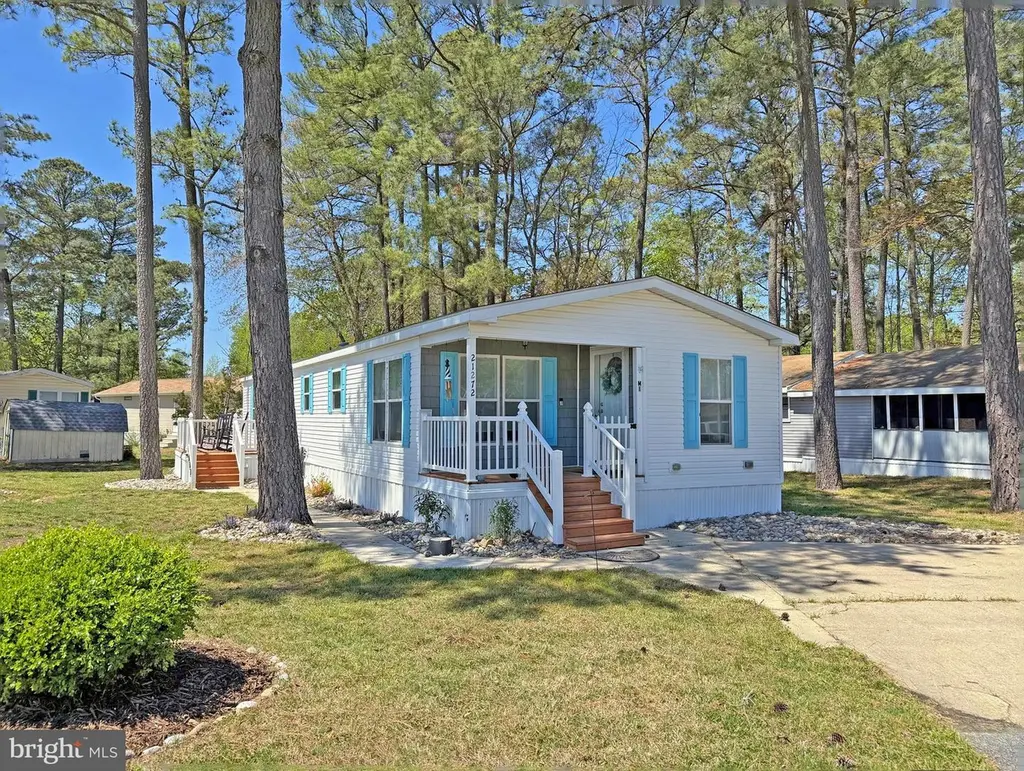
21272 M St Unit M-1 · Rehoboth Beach, DE
Flood risk 7/10 · Major
- FEMA flood zone
- AE
- Chance of flooding over 30 yrs
- 0.96%
- Est. flood insurance / yr
- $2,026 – $9,024
Fire risk 1/10 · Minimal
- Est. fire insurance / yr
- $476 – $884
Heat risk 8/10 · Major
- Hot days now (above 100°F)
- 7 days/yr
- Hot days in 30 yrs
- 18 days/yr
Wind risk 8/10 · Major
- Chance of severe wind over 30 yrs
- 80.0%
Air-quality risk 2/10 · Minimal
- Unhealthy air days now
- 1 days/yr
- Unhealthy air days in 30 yrs
- 1 days/yr
Risk factors via First Street. Map © Google.
Why this score? — see what drove the C+ grade
The composite is a weighted blend of 9 inputs, each scored 0–100. Each bar is that input's sub-score; the figure is the points it added to the 100-point composite (weight × sub-score).
- Cash flow +30.0/30.0
- 1% rule +10.0/10.0
- DSCR +10.0/10.0
- Schools +4.2/10.0
- Livability +3.6/5.0
- Rent growth +2.5/5.0
- Condition / age +2.2/5.0
- ARV discount +0.0/15.0
- Appreciation +0.0/10.0
$175,000
🖨 Deal sheet (PDF) 📄 Offer letter ✓ Due diligence
Listing remarks MLS
Entered for "comp" purposes only. Lot Rent $689.86/mt. includes water service.
Key facts
- Boat slips for rent
- Community boat ramp
- Small sandy beach
Tags
Property features AI
Finance
- Other: Property is in a Federal Flood Zone (AE); Ground rent amount and remaining term are associated with the land lease
- Financial info: Land lease (ground rent) applies: monthly land lease payment; Annual ground rent noted in income/expense list
- HOA & community: Association amenities include boat slip, boat ramp, pier/dock, common grounds, picnic area, outdoor pool, tennis courts, playground, and water/lake privileges; Association fees cover common area maintenance, pier/dock maintenance, pool(s), road maintenance, snow removal, trash, water, and other services; Located in the Hometown America park with ground rent and park rules
Exterior
- Parking: Driveway parking (asphalt and concrete); Four total garage/parking spaces with four driveway spaces
- Security: Insulated windows and doors
- Utilities: Community water; Public sewer; Municipal trash service; Cable and satellite internet available
- Home design: Manufactured home (double wide, Pine Grove); Single-story living with main-level bedrooms; Entry on a corner-facing unit in a private, black-top road community
- Construction: Vinyl siding; Shingle roof; Crawl space foundation with pillar/post/pier supports; Built as a double-wide manufactured home (20' x 60')
- Exterior features: Corner lot/unit; Porch(es) and deck(s); Shed; Community pool (fenced, in-ground); Water view of Rehoboth Bay; Boat/pier access amenities in the community
Interior
- Kitchen: Built-in microwave; Electric oven/range; Dishwasher; Refrigerator
- Bedrooms: Three bedrooms on the main level
- Flooring: Luxury vinyl plank
- Bathrooms: Two full bathrooms (both on the main level)
- Heating & cooling: Forced air heating (electric); Central air conditioning; Ceiling fans; 200+ amp electrical service with 220 volts
- Interior features: Open floor plan with combination dining/living and combination kitchen/dining or kitchen/living layout; Crown molding; Ceiling fan(s); Master bath; Walk-in closet(s); Tub with shower and walk-in shower; Insulated storm doors
- Laundry & utility: Washer and dryer in unit (front-loading washer and electric dryer); Water heater
Neighborhood map
What this means for you Summary
Snapshot
- This is a 3-bed/2.0-bath single-family listed at $175k. Condition is rated fair.
Deal economics
- At list price, monthly cash flow is $601 ($7k/yr) — positive.
- The deal already cash-flows at list — no discount required.
- Meets the 1% rule at list price ($3k rent vs $175k).
- Cap rate 13.6% vs local median 1.1% in Rehoboth Beach — top-decile yield for the area; either an underpriced asset or a hidden risk that comps aren't pricing in. Stress-test before assuming the spread holds.
Location & tenants
- Location reads 71/100 on livability (#20 in DE) — a middle-class / working-renter tenant base. Strengths: schools A+, amenities A+, employment A+; Watch: crime F, commute F, cost of living F.
- Cape Henlopen School District (town): math 42% / reading 55% proficiency, ranked #5 of 26 in DE (top 19%) — families likely to look elsewhere, expect single-tenant / working-renter base with shorter leases.
- Market conditions: 331 active listings in the ZIP; 1 comparable units currently listed for rent nearby; solid renter incomes; 4,354 units permitted in Sussex County in 2024 (344 in 5+ unit buildings).
- This rent runs 34% of the median local income ($102k/yr) — at the standard rent-burdened threshold; future hikes will face affordability resistance.
Forward outlook
- Local home prices are declining (-3.0%/yr); year-one equity from $1k of loan paydown is wiped out by about $5k of value loss. Plan a longer hold.
- Sussex County population projected at +25% by 2050 — long-run rental-demand tailwind backs the buy-and-hold thesis.
- At projected returns (-3.0% appreciation + 3.0% rent growth), your $49k cash investment doubles in ~8 years — after that, you're playing with house money.
Negotiation context
- Only 11 days on market — expect competitive offers; lowballing is unlikely to land.
- 2 sale attempts since 3y ago with the ask held roughly flat each time — persistent listings suggest the price (not the market) is what's stuck; bring a comps-based counter.
Risks & watch-outs
- Watch-outs: flood insurance adds $460/mo.
- Climate carrying-cost: in FEMA flood zone AE (mandatory federal flood insurance); severe wind risk, 80% chance of damaging wind over 30y; extreme-heat days projected 7→18/yr by 2055 (HVAC capex compounding) — expect insurance premiums to compound above CPI over the hold.
Questions for the listing agent
- Have any recent inspections been done? Can we get a copy of the seller's disclosures and any deferred-maintenance estimates?
- What's the actual annual flood-insurance premium (NFIP or private), and is the property in a SFHA with mandatory coverage?
- Is there a deadline driving the sale (1031 exchange, divorce, estate, relocation)? That informs how much negotiation room exists.
- Schools are A-rated — typically a magnet for longer-tenancy family renters. What's the average tenant stay here, and is there a school-zone premium baked into asking?
- Crime grade is F in this area — have there been break-ins, vandalism, or insurance claims at this property in the last 3 years? What carrier currently insures it and at what premium?
- What's the average days-on-market for RENTAL listings here right now (not sales)? A rising rental-DOM trend means longer vacancies and softer asking-rent achievability than the comps imply.
- What's the recent tenant-quality profile in this submarket — average credit score on applications, eviction rate, late-payment / NSF rate, and stable-employment percentage? A property-management company in the area should have these aggregated.
- How much new for-sale + rental construction is in the pipeline within 1–3 miles? Heavy new supply typically softens prices + rents 12–24 months out; constrained supply supports both.
Investment metrics
- 1% rule
- 1.64% ✓
- Cap rate
- 13.57%
- Cash-on-cash
- 26.00%
- DSCR
- 2.16
- GRM
- 5.1
CMA / ARV
- ARV (median comp)
- $129,957
- List price
- $175,000
- Delta
- 34.66%
- Verdict
- OVERPRICED
- Comps
- 20 within 1.0 mi
Show comp detail 12 sales within ~0.75 mi
| Address | Dist | Beds/Ba | Sqft | Sold | Price | $/sf | Match |
|---|---|---|---|---|---|---|---|
| 21272 M St Unit M-1 | 0.00mi | 3/2.0 | 1,200 (0%) | 0mo | $168,000 | $140 | 100 |
| 21229 N Street | 0.10mi | 2/2.0 (-1) | 1,188 (-1%) | 1mo | $175,000 | $147 | 87 |
| 21251 K St #38492 | 0.03mi | 2/2.0 (-1) | 1,152 (-4%) | 4mo | $115,000 | $100 | 84 |
| 21715 A St | 0.45mi | 3/2.0 | 1,200 (0%) | 3mo | $155,000 | $129 | 77 |
| 21326 Point Circle Cir #42251 | 0.08mi | 3/2.0 | 1,100 (-8%) | 10mo | $131,000 | $119 | 74 |
| 35971 Jake Dr | 0.10mi | 3/2.0 | 1,040 (-13%) | 1mo | $148,000 | $142 | 73 |
| 21223 N St Unit N-20 | 0.11mi | 2/2.0 (-1) | 1,100 (-8%) | 5mo | $90,000 | $82 | 72 |
| 35988 Jake Dr | 0.14mi | 3/2.0 | 1,344 (+12%) | 9mo | $188,900 | $141 | 66 |
| 21730 B St | 0.21mi | 3/2.0 | 1,350 (+12%) | 5mo | $230,000 | $170 | 65 |
| 21749 E St | 0.44mi | 3/2.0 | 1,272 (+6%) | 7mo | $237,000 | $186 | 64 |
| 21730 E St Unit E-29 | 0.42mi | 3/2.0 | 1,030 (-14%) | 2mo | $128,000 | $124 | 55 |
| 37 Branchwood Dr #13034 | 0.74mi | 3/2.0 | 1,076 (-10%) | 9mo | $147,500 | $137 | 41 |
Match score weights: distance 35% · size 25% · config 20% · recency 20%. Top-matched comps best support the ARV.
Projected returns pro-forma
-3.0% appreciation · 3.0% rent growth · sell at horizon
- IRR
- 5.4%
- Equity multiple
- 1.21×
- Total profit
- $10,267
- Equity at exit
- $26,093
- IRR
- 14.9%
- Equity multiple
- 2.22×
- Total profit
- $59,582
- Equity at exit
- $15,131
Cash invested: $49,000 (down + closing). Projections, not guarantees.
Landlord ↔ Tenant lean methodology
- Overall (STATE)
- 70 Landlord-Friendly
- State Delaware
- 70 Landlord-Friendly · D+7
- County
- — inherits STATE
- City
- — inherits STATE
ZIP-level market 19971
- Active inventory
- 331
- Price-to-rent
- 5.1×
Monthly cashflow live
- Estimated rent
- $2,875 medium interval (Pro) →
- Mortgage (P&I)
- −$918
- Tax est. 1.5%
- −$219 /mo · $2,625/yr
- Insurance
- −$73
- Flood insurance flood zone
- −$460 /mo · $5,525/yr
- HOA
- −$0
- Vacancy / Maint / Mgmt
- −$604
- Net cashflow
- $601
Break-even live
Sensitivity live
| Price | -10% $722 | -5% $662 | +0% $601 | +5% $541 | +10% $480 |
|---|---|---|---|---|---|
| Rent | -10% $374 | -5% $488 | +0% $601 | +5% $715 | +10% $828 |
| Rate | -1.0pp $689 | -0.5pp $646 | base $601 | +0.5pp $556 | +1.0pp $510 |
UW: 25.0% down · 7.5% · 30yr · 1.5% tax · 5.0% vac · 8.0% maint · 8.0% mgmt
Financing live
Cash to close
- Down payment
- $43,750
- Closing costs
- $5,250
- Reserves months
- —
- Total cash needed
- —
Loan-product check · same deal, 3 products live
Conventional
25% down · 7.5% · 30yr
- Down + closing
- —
- Monthly P&I
- —
- Monthly cashflow
- —
- DSCR
- —
- Eligible?
- —
Personal DTI + credit; lowest rate.
DSCR
20% down · 8.5% · 30yr
- Down + closing
- —
- Monthly P&I
- —
- Monthly cashflow
- —
- DSCR
- —
- Eligible?
- —
No personal income docs; deal must DSCR.
Hard money
10% down · 12.0% · 12mo
- Down + closing
- —
- Monthly P&I
- —
- Monthly cashflow
- —
- DSCR
- —
- Eligible?
- —
Short-term bridge; refi at stabilization.
Rent comps 1 comps
| Address | Beds | Baths | Sqft | Rent | $/sqft | DOM | Units | Dist |
|---|---|---|---|---|---|---|---|---|
| 36400 Warwick Dr Rehoboth Beach, DE | 3.0 | 2.5 | 792 | $3,500 | $4.42 | 44d | 1 | 0.63mi |
Listing history 4 events
-
2026-05-05historical Active Under Contract 2497-char remark
-
2026-04-24$175,000 Active 2497-char remark
-
2023-07-29$140,000 88-char remark
Show marketing remark (88 chars)
Entered for "comp" purposes only. Lot Rent $689.86/mt. includes water service.
-
2023-07-28soldstatus $136,600 88-char remark
Show marketing remark (88 chars)
Entered for "comp" purposes only. Lot Rent $689.86/mt. includes water service.
ⓘ Source: listings_history table (triggers on properties + properties_extension) + one-shot
backfill from property_details.listing_events for pre-trigger history.
Climate risk First Street
- Flood 7/10 Severe FEMA zone AE · 96% chance over 30 yrs
- Wildfire 1/10 Low
- Heat 8/10 Severe 7 d/yr ≥100°F today · 18 d/yr by 30 yrs out
- Wind 8/10 Severe 80% chance of damaging wind over 30 yrs
- Air quality 2/10 Low 1 unhealthy d/yr today · 1 by 30 yrs out
Nearby sold comps map
Loading sold comps map…
Walkable amenities ~0.75 mi
Loading nearby amenities…
Taxation est. · year 1
- Rental income
- $34,498
- − Mortgage interest
- −$9,803
- − Property taxes
- −$2,625
- − Insurance
- −$6,400
- − Repairs & maintenance
- −$2,760
- − Management
- −$2,760
- − Depreciation
- −$5,091
- Taxable income
- $5,060
- Est. tax owed @ 24.0%
- −$1,214
- After-tax cash flow
- $6,002/yr
For passive investors: Depreciation is non-cash, so a rental often shows a tax loss while cash-flowing — sheltering income. Rental losses are passive: they offset passive income freely, and up to $25,000/yr can offset ordinary (W-2) income if you actively participate and your MAGI is under $100k (phasing out to $0 by $150k); unused losses carry forward. On sale, claimed depreciation is recaptured at up to 25%, and gains may owe capital-gains tax (a 1031 exchange can defer both). Figures are a year-1 estimate at your 24.0% rate — not tax advice; consult a CPA.
Condition & rehab AI · 1 photo
This home requires moderate repairs and maintenance to improve its condition and value. Upgrades to the exterior, kitchen, and bathrooms, along with landscaping improvements, can significantly enhance its appeal and marketability.
Repairs flagged
- Minor Kitchen cabinets — Slight wear and tear visible.
- Minor Bathroom fixtures — Signs of wear and need for cleaning.
- Moderate Exterior siding — Weathered appearance and potential need for repainting.
- Minor Paint — Faded paint in some areas, especially in the kitchen and bathrooms.
Value-add opportunities
- Both Paint exterior siding and trim — Fresh paint can significantly improve curb appeal and home value.
- Both Replace kitchen cabinets and countertops — New cabinets and countertops can enhance the kitchen's functionality and aesthetics.
- Both Upgrade bathroom fixtures and paint — Fresh paint and updated fixtures can make bathrooms more inviting and functional.
- Both Landscaping and curb appeal improvements — A well-maintained yard can increase both resale and rental value.
- Both Service and possibly replace HVAC system — A functional HVAC system is crucial for comfort and energy efficiency, impacting both resale and rental value.
Renovation cost estimate screening
| Repair item | Severity | Est. cost |
|---|---|---|
| Kitchen cabinets · Slight wear and tear visible. | Minor | $500–3,000 |
| Bathroom fixtures · Signs of wear and need for cleaning. | Minor | $500–3,000 |
| Exterior siding · Weathered appearance and potential need for repainting. | Moderate | $3,000–15,000 |
| Paint · Faded paint in some areas, especially in the kitchen and bathrooms. | Minor | $500–3,000 |
| Total estimated repair cost · 4 items | $4,500–24,000 |
Value-add ROI direction
- Both Paint exterior siding and trim — Fresh paint can significantly improve curb appeal and home value. ↑
- Both Replace kitchen cabinets and countertops — New cabinets and countertops can enhance the kitchen's functionality and aesthetics. ↑
- Both Upgrade bathroom fixtures and paint — Fresh paint and updated fixtures can make bathrooms more inviting and functional. ↑
- Both Landscaping and curb appeal improvements — A well-maintained yard can increase both resale and rental value. ↑
- Both Service and possibly replace HVAC system — A functional HVAC system is crucial for comfort and energy efficiency, impacting both resale and rental value. ↑
ⓘ Cost ranges are severity-bucket heuristics (US national rule-of-thumb). Get contractor quotes + a written scope before underwriting a rehab budget.
Schools (NCES district)
- District
- Cape Henlopen School District
- NCES district ID
- 1000170
- Math proficiency
- 42% ▼ -14.00%
- Reading proficiency
- 55% ▼ -10.00%
- Median HH income
- $60,196
- Composite
- 42.47/100
- National rank
- #3214
- State rank
- #5 of 26 in DE
Livability — Rehoboth Beach
- Score
- 71/100
- State rank
- #20
- US rank
- #6520
Category grades
Schools grade is shown separately in the Schools card above.
Census & demographics
- County
- Sussex County · 82,708 people
- City population
- 14,886
- Metro
- Salisbury, MD-DE
- Population (ZIP)
- 14,886
- Household income
- $102,146
- Rent vs Own
- Severe rent burden
- 317.0
Population outlook (Sussex County) Hauer SSP2
- Today (2025)
- 248,853 people
- By 2030
- 264,464 · +6.3%
- By 2040
- 290,980 · +16.9%
- By 2050
- 311,259 · +25.1%
- By 2075
- 352,488 · +41.6%
- By 2100
- 367,406 · +47.6%
Race, ethnicity, and origin ACS 2023
- Neighborhood character
- Predominantly White (88%)
- Race & ethnicity
- White 88% Black 4% Two or more races 4% Hispanic / Latino 3% Asian 2%
- Common ancestry
- Romanian 5% Slovak 3% Italian 3%
- Foreign-born
- 6% · Canada, China
- Languages at home
- 95% English-only · Spanish 2% Russian/Polish/Slavic 1% French/Haitian/Cajun 1%
Political lean MEDSL · Sussex
- 2024 margin
- R (+11.0) · D 43.9% · R 54.9% · Other 1.2%
- 2008→2024 swing
- -2.4pp toward R · 2008: -8.6pp · 2024: -11.0pp
- All cycles
- 2024: R+11.0 2020: R+11.2 2016: R+22.0 2012: R+13.0 2008: R+8.6
Not yet ingested
- Civics
- —
Market trends
- HPI YoY
- ▼ -220.39%
- Current HPI
- 353.3977
- Rent YoY
- —
- Metro
- Salisbury, MD-DE
- State GDP YoY
- —
- F500 in state
- 0
Price history
+23.0% since first listed6 events — show timeline
- 2026-06-10 Sold (MLS) $168,000 BRIGHT MLS
- 2026-05-26 Pending — BRIGHT MLS
- 2026-05-05 Contingent — BRIGHT MLS
- 2026-04-24 Listed $175,000 BRIGHT MLS
- 2023-07-29 Listed $140,000 BRIGHT MLS
- 2023-07-28 Sold (MLS) $136,600 BRIGHT MLS
Cash-flow waterfall
monthlySold comps — $/sqft
last 12 mo · ≤1 miLoading sold comps…