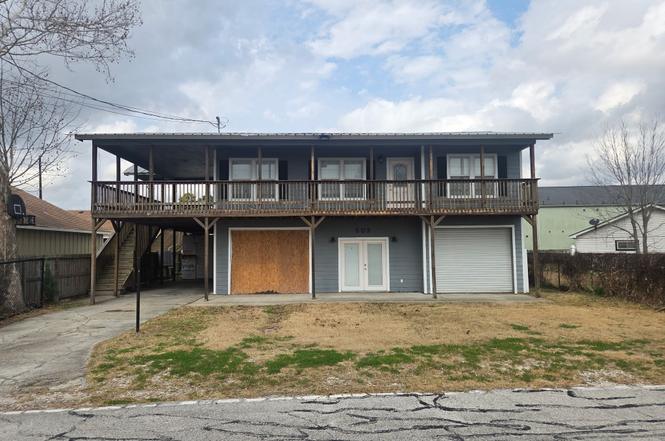
503 Pine Ln · Crosby, TX
Flood risk No data
- FEMA flood zone
- —
- Chance of flooding over 30 yrs
- —
- Est. flood insurance / yr
- —
Fire risk No data
- Est. fire insurance / yr
- —
Heat risk No data
- Hot days now (above threshold)
- —
- Hot days in 30 yrs
- —
Wind risk No data
- Chance of severe wind over 30 yrs
- —
Air-quality risk No data
- Unhealthy air days now
- —
- Unhealthy air days in 30 yrs
- —
Risk factors via First Street. Map © Google.
Why this score? — see what drove the C- grade
The composite is a weighted blend of 9 inputs, each scored 0–100. Each bar is that input's sub-score; the figure is the points it added to the 100-point composite (weight × sub-score).
- Cash flow +15.8/30.0
- ARV discount +15.0/15.0
- 1% rule +5.7/10.0
- DSCR +4.9/10.0
- Schools +3.5/10.0
- Livability +3.0/5.0
- Rent growth +2.9/5.0
- Condition / age +2.5/5.0
- Appreciation +0.0/10.0
$155,000
🖨 Deal sheet 📄 Offer letter ✓ Due diligence
Listing remarks
Prime location for your home business! Off Highway 90 and Krenek. Whether you need a home with a large garage or want a business with office and living quarters above. Gas and compressor lines are already set up, so possibilities are endless! Large shop, office/living space, with a bathroom downstairs. Upstairs, you will find a wraparound porch leading into the home. Beautiful kitchen with granite countertops and custom cabinets, open to the living and dining areas. Primary bedroom with a walk-in closet and a full bathroom. Secondary bedroom and bath above, too!
Key facts
- Business with office
- Large garage
- Wraparound porch
Tags
Neighborhood map
What this means for you Summary
Snapshot
- This is a 2-bed/1.0-bath single-family listed at $155k.
Deal economics
- At list price, monthly cash flow is $72 ($862/yr) — positive.
- The deal already cash-flows at list — no discount required.
- Meets the 1% rule at list price ($2k rent vs $155k).
- Recommended offer: $153k (1.5% below list) — sets the bar for market timing.
- Cap rate 6.8% vs local median 4.8% in Crosby — top-decile yield for the area; either an underpriced asset or a hidden risk that comps aren't pricing in. Stress-test before assuming the spread holds.
Location & tenants
- Location reads 59/100 on livability (#1,121 in TX) — a working-class tenant base; expect higher turnover. Strengths: cost of living A+, crime A, housing A; Watch: amenities F, commute F, employment F.
- Crosby ISD (rural): math 39% / reading 40% proficiency, ranked #369 of 826 in TX (top 45%) — families likely to look elsewhere, expect single-tenant / working-renter base with shorter leases.
- Zoned schools: Crosby Middle (math 36% / reading 37%, grade F, #786 of 1,662 statewide, top 48%, 1,549 students, 60% FRL); Highpoint School East (Crosby) (20 students, 80% FRL) — zoned schools average 70% FRL vs 50% district-wide (20 pts higher); higher-poverty schools than district average — tighter screening recommended.
- Market conditions: Rents rising (+1.5%/yr); 1172 active listings in the ZIP; solid renter incomes; 29,883 units permitted in Harris County in 2024 (8,621 in 5+ unit buildings).
Forward outlook
- Local home prices are declining (-3.0%/yr); year-one equity from $1k of loan paydown is wiped out by about $5k of value loss. Plan a longer hold.
- Harris County population projected at +47% by 2050 — long-run rental-demand tailwind backs the buy-and-hold thesis.
Negotiation context
- It's been on market 24 days — a 2% lower offer ($153k) is reasonable based on typical stale-listing flexibility.
- 10 sale attempts since 4y ago with the ask held roughly flat each time — persistent listings suggest the price (not the market) is what's stuck; bring a comps-based counter.
Risks & watch-outs
- Watch-outs: property tax is 2.8% of price; built in 1950 — expect roof / HVAC / electrical / plumbing capex.
Questions for the listing agent
- Built in 1950 — when were the roof, HVAC, electrical panel, plumbing, and water heater last replaced?
- Property tax is high relative to price — has the assessment been appealed recently, and will the sale trigger a re-assessment?
- Is there a deadline driving the sale (1031 exchange, divorce, estate, relocation)? That informs how much negotiation room exists.
- Schools are D-rated, which usually means shorter tenancies and higher turnover. Who's the typical renter profile here, and what's been the actual vacancy rate?
- What's the average days-on-market for RENTAL listings here right now (not sales)? A rising rental-DOM trend means longer vacancies and softer asking-rent achievability than the comps imply.
- What's the recent tenant-quality profile in this submarket — average credit score on applications, eviction rate, late-payment / NSF rate, and stable-employment percentage? A property-management company in the area should have these aggregated.
- How much new for-sale + rental construction is in the pipeline within 1–3 miles? Heavy new supply typically softens prices + rents 12–24 months out; constrained supply supports both.
Investment metrics
- 1% rule
- 1.07% ✓
- Cap rate
- 6.85%
- Cash-on-cash
- 1.99%
- DSCR
- 1.09
- GRM
- 7.8
CMA / ARV
- ARV (on-the-fly)
- $256,000
- Comps found
- 12
Show comp detail 12 sales within ~0.75 mi
| Address | Dist | Beds/Ba | Sqft | Sold | Price | $/sf | Match |
|---|---|---|---|---|---|---|---|
| 2547 Cactus Ranch Ln | 0.60mi | 3/2.0 (+1) | 1,562 (-2%) | 5mo | $249,840 | $160 | 55 |
| 2411 Serrano Plains Trl | 0.60mi | 3/2.0 (+1) | 1,688 (+6%) | 7mo | $265,390 | $157 | 48 |
| 2519 Serrano Plains Trl | 0.64mi | 3/2.0 (+1) | 1,688 (+6%) | 7mo | $262,640 | $156 | 46 |
| 2511 Covered Wagon Dr | 0.60mi | 3/2.0 (+1) | 1,688 (+6%) | 9mo | $268,640 | $159 | 46 |
| 2511 Serrano Plains Trl | 0.61mi | 3/2.0 (+1) | 1,688 (+6%) | 10mo | $291,140 | $172 | 45 |
| 2611 Cactus Ranch Ln | 0.60mi | 3/2.0 (+1) | 1,449 (-9%) | 7mo | $208,790 | $144 | 41 |
| 2614 Cactus Ranch Ln | 0.60mi | 3/2.0 (+1) | 1,414 (-12%) | 6mo | $212,740 | $150 | 39 |
| 2650 Cactus Ranch Ln | 0.60mi | 3/2.0 (+1) | 1,449 (-9%) | 12mo | $247,490 | $171 | 37 |
| 2554 Cactus Ranch Ln | 0.63mi | 3/2.0 (+1) | 1,414 (-12%) | 7mo | $239,540 | $169 | 37 |
| 2630 Cactus Ranch Ln | 0.62mi | 3/2.0 (+1) | 1,414 (-12%) | 10mo | $239,990 | $170 | 34 |
| 2635 Cactus Ranch Ln | 0.61mi | 3/2.0 (+1) | 1,414 (-12%) | 11mo | $251,540 | $178 | 34 |
| 2519 Elliot Canyon Ln | 0.60mi | 3/2.0 (+1) | 1,831 (+14%) | 11mo | $279,340 | $153 | 30 |
Match score weights: distance 35% · size 25% · config 20% · recency 20%. Top-matched comps best support the ARV.
Projected returns pro-forma
-3.0% appreciation · 1.48% rent growth · sell at horizon
- IRR
- -15.0%
- Equity multiple
- 0.47×
- Total profit
- $-22,922
- Equity at exit
- $23,111
- IRR
- -9.5%
- Equity multiple
- 0.46×
- Total profit
- $-23,527
- Equity at exit
- $13,402
Cash invested: $43,400 (down + closing). Projections, not guarantees.
Landlord ↔ Tenant lean methodology
- Overall (STATE)
- 87 Strongly Landlord-Friendly
- State Texas
- 87 Strongly Landlord-Friendly · R+5
- County
- — inherits STATE
- City
- — inherits STATE
ZIP-level market 77532
- Home prices YoY
- -28.6%
- Rents YoY
- 1.5%
- Active inventory
- 1172
- Price-to-rent
- 7.8×
Monthly cashflow live
- Estimated rent
- $1,666 medium interval (Pro) →
- Mortgage (P&I)
- −$813
- Tax from tax record
- −$367 /mo · $4,405/yr
- Insurance
- −$65
- HOA
- −$0
- Vacancy / Maint / Mgmt
- −$350
- Net cashflow
- $72
Break-even live
UW: 25.0% down · 7.5% · 30yr · 1.5% tax · 5.0% vac · 8.0% maint · 8.0% mgmt
Financing live
Cash to close
- Down payment
- $38,750
- Closing costs
- $4,650
- Reserves months
- —
- Total cash needed
- —
Loan-product check · same deal, 3 products live
Conventional
25% down · 7.5% · 30yr
- Down + closing
- —
- Monthly P&I
- —
- Monthly cashflow
- —
- DSCR
- —
- Eligible?
- —
Personal DTI + credit; lowest rate.
DSCR
20% down · 8.5% · 30yr
- Down + closing
- —
- Monthly P&I
- —
- Monthly cashflow
- —
- DSCR
- —
- Eligible?
- —
No personal income docs; deal must DSCR.
Hard money
10% down · 12.0% · 12mo
- Down + closing
- —
- Monthly P&I
- —
- Monthly cashflow
- —
- DSCR
- —
- Eligible?
- —
Short-term bridge; refi at stabilization.
Listing history 41 events
-
2026-03-08status Pending
-
2026-02-27status Pending
-
2026-02-11$155,000 Active
-
2025-12-10historical
-
2025-10-03$250,000 Active
-
2025-10-03historical
-
2025-09-03price $250,000
-
2025-08-25price $260,000
-
2025-08-12price $270,000
-
2025-07-29price $294,000
-
2025-07-05$299,000 Active
-
2024-09-25historical $1,200
-
2024-09-22historical $1,200
-
2024-09-21historical
-
2024-09-21historical
-
2024-09-18$1,200
-
2024-08-30price $250,000
-
2024-08-30price $250,000
-
2024-07-31$2,650
-
2024-06-22price $300,000
-
2024-06-22price $300,000
-
2024-06-16price $399,000
-
2024-05-26price $399,000
-
2024-05-21price $444,990
-
2024-05-21price $444,990
-
2024-04-30$449,990 Active
-
2024-04-18price $449,990
-
2024-04-05$475,000 Active
-
2023-10-20soldstatus
-
2023-10-13soldstatus Sold
-
2023-08-18status Pending
-
2023-08-12historical
-
2023-08-02status Active
-
2023-08-02status Option Pending
-
2023-07-14$235,000 Active
-
2022-05-06soldstatus
-
2022-05-05soldstatus Sold
-
2022-04-04status Pending
-
2022-03-26status Option Pending
-
2022-03-20$199,900 Active
-
1988-01-02soldstatus
ⓘ Source: listings_history table (triggers on properties + properties_extension) + one-shot
backfill from property_details.listing_events for pre-trigger history.
Tax reassessment forecast TX · Resets to sale price
- Current annual tax
- $4,405 · $367/mo
- Projected year-2 tax
- $4,405 · $367/mo
- Expected delta
- $0/yr ($0/mo · 0.0%)
ⓘ Screening estimate from a state-policy table — verify with the county assessor before closing.
Nearby sold comps map
Loading sold comps map…
Walkable amenities ~0.75 mi
Loading nearby amenities…
Taxation est. · year 1
- Rental income
- $19,994
- − Mortgage interest
- −$8,682
- − Property taxes
- −$4,405
- − Insurance
- −$775
- − Repairs & maintenance
- −$1,600
- − Management
- −$1,600
- − Depreciation
- −$4,509
- Taxable loss
- −$1,576
- Est. tax savings @ 24.0%
- +$378
- After-tax cash flow
- $1,240/yr
For passive investors: Depreciation is non-cash, so a rental often shows a tax loss while cash-flowing — sheltering income. Rental losses are passive: they offset passive income freely, and up to $25,000/yr can offset ordinary (W-2) income if you actively participate and your MAGI is under $100k (phasing out to $0 by $150k); unused losses carry forward. On sale, claimed depreciation is recaptured at up to 25%, and gains may owe capital-gains tax (a 1031 exchange can defer both). Figures are a year-1 estimate at your 24.0% rate — not tax advice; consult a CPA.
Schools (NCES district)
- District
- Crosby ISD
- NCES district ID
- 4815750
- Math proficiency
- 39% ▼ -13.00%
- Reading proficiency
- 40% ▼ -5.00%
- Median HH income
- $61,079
- Composite
- 35.14/100
- National rank
- #5012
- State rank
- #369 of 826 in TX
Livability — Crosby
- Score
- 59/100
- State rank
- #1121
- US rank
- #19783
Category grades
Schools grade is shown separately in the Schools card above.
Census & demographics
- County
- Harris County · 4,702,590 people
- City population
- 33,780
- Metro
- Houston-The Woodlands-Sugar Land, TX
- Population (ZIP)
- 33,780
- Household income
- $92,201
- Rent vs Own
- Severe rent burden
- 382.0
Population outlook (Harris County) Hauer SSP2
- Today (2025)
- 5,571,493 people
- By 2030
- 6,089,821 · +9.3%
- By 2040
- 7,142,806 · +28.2%
- By 2050
- 8,185,864 · +46.9%
- By 2075
- 10,574,329 · +89.8%
- By 2100
- 12,109,958 · +117.4%
Race, ethnicity, and origin ACS 2023
- Neighborhood character
- Diverse neighborhood (Simpson 0.60)
- Race & ethnicity
- White 54% Hispanic / Latino 31% Two or more races 16% Black 9%
- Hispanic origin (detail)
- Mexican 24%
- Common ancestry
- Lithuanian 4% Romanian 3% Italian 2%
- Foreign-born
- 10% · Canada
- Languages at home
- 78% English-only · Spanish 21%
Political lean MEDSL · Harris
- 2024 margin
- Lean D (+5.5) · D 52.0% · R 46.4% · Other 1.6%
- 2008→2024 swing
- +3.9pp toward D · 2008: 1.6pp · 2024: 5.5pp
- All cycles
- 2024: D+5.5 2020: D+13.3 2016: D+12.4 2012: D+0.1 2008: D+1.6
Not yet ingested
- Civics
- —
Market trends
- HPI YoY
- ▼ -105.63%
- Current HPI
- 264.0126
- Rent YoY
- ▲ 1.48%
- Metro
- Houston-The Woodlands-Sugar Land, TX
- State GDP YoY
- ▲ 3.95%
- F500 in state
- 110
Industry mix (Fortune 500 HQ in TX)
| Industry | F500 HQs | Revenue |
|---|---|---|
| Energy | 16 | $1,198B |
|
||
| Technology | 5 | $198B |
|
||
| Engineering / Construction | 4 | $72B |
|
||
| Energy Services | 3 | $60B |
|
||
| Utilities | 3 | $41B |
|
||
| Healthcare | 2 | $330B |
|
||
Price history
-22.5% since first listed41 events — show timeline
- 2026-03-08 Pending — HARMLS
- 2026-02-27 Pending — HARMLS
- 2026-02-11 Listed $155,000 HARMLS
- 2025-12-10 Listing Removed — HARMLS
- 2025-10-03 Listing Removed — HARMLS
- 2025-10-03 Listed $250,000 HARMLS
- 2025-09-03 Price Changed $250,000 HARMLS
- 2025-08-25 Price Changed $260,000 HARMLS
- 2025-08-12 Price Changed $270,000 HARMLS
- 2025-07-29 Price Changed $294,000 HARMLS
- 2025-07-05 Listed $299,000 HARMLS
- 2024-09-25 Rental Removed $1,200 HARMLS
- 2024-09-22 Rental Removed $1,200 HARMLS
- 2024-09-21 Listing Removed — HARMLS
- 2024-09-21 Listing Removed — HARMLS
- 2024-09-18 Listed for Rent $1,200 HARMLS
- 2024-08-30 Price Changed $250,000 HARMLS
- 2024-08-30 Price Changed $250,000 HARMLS
- 2024-07-31 Listed for Rent $2,650 HARMLS
- 2024-06-22 Price Changed $300,000 HARMLS
- 2024-06-22 Price Changed $300,000 HARMLS
- 2024-06-16 Price Changed $399,000 HARMLS
- 2024-05-26 Price Changed $399,000 HARMLS
- 2024-05-21 Price Changed $444,990 HARMLS
- 2024-05-21 Price Changed $444,990 HARMLS
- 2024-04-30 Listed $449,990 HARMLS
- 2024-04-18 Price Changed $449,990 HARMLS
- 2024-04-05 Listed $475,000 HARMLS
- 2023-10-20 Sold (Public Records) — Public Records
- 2023-10-13 Sold (MLS) — HARMLS
- 2023-08-18 Pending — HARMLS
- 2023-08-12 Listing Removed — HARMLS
- 2023-08-02 Relisted — HARMLS
- 2023-08-02 Pending — HARMLS
- 2023-07-14 Listed $235,000 HARMLS
- 2022-05-06 Sold (Public Records) — Public Records
- 2022-05-05 Sold (MLS) — HARMLS
- 2022-04-04 Pending — HARMLS
- 2022-03-26 Pending — HARMLS
- 2022-03-20 Listed $199,900 HARMLS
- 1988-01-02 Sold (Public Records) — Public Records
Property tax history
+10.0%/yrLatest (2025): $4,405 · -1.1% YoY. Source: county tax records.
Cash-flow waterfall
monthlySold comps — $/sqft
last 12 mo · ≤1 miLoading sold comps…