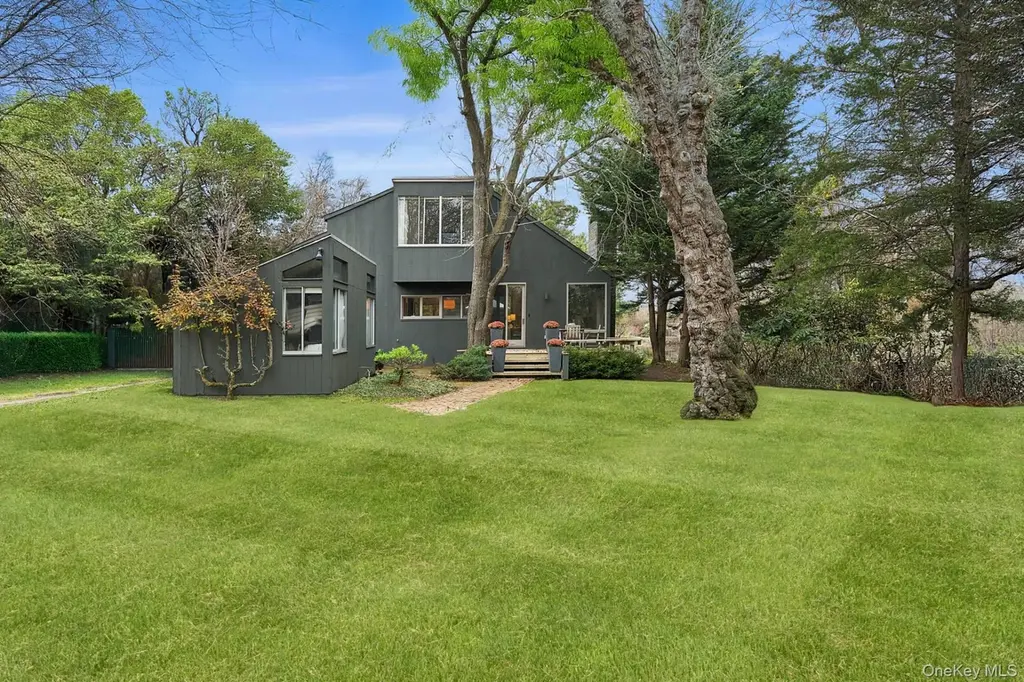
212 Upper Seven Ponds Rd · Water Mill, NY
Flood risk 6/10 · Moderate
- FEMA flood zone
- AE
- Chance of flooding over 30 yrs
- 0.73%
- Est. flood insurance / yr
- $1,737 – $8,500
Fire risk 1/10 · Minimal
- Est. fire insurance / yr
- $691 – $1,283
Heat risk 4/10 · Minor
- Hot days now (above 90°F)
- 7 days/yr
- Hot days in 30 yrs
- 20 days/yr
Wind risk 8/10 · Major
- Chance of severe wind over 30 yrs
- 80.0%
Air-quality risk 3/10 · Minor
- Unhealthy air days now
- 3 days/yr
- Unhealthy air days in 30 yrs
- 4 days/yr
Risk factors via First Street. Map © Google.
Why this score? — see what drove the A+ grade
The composite is a weighted blend of 9 inputs, each scored 0–100. Each bar is that input's sub-score; the figure is the points it added to the 100-point composite (weight × sub-score).
- Cash flow +30.0/30.0
- ARV discount +15.0/15.0
- 1% rule +10.0/10.0
- DSCR +10.0/10.0
- Appreciation +9.3/10.0
- Rent growth +5.0/5.0
- Schools +4.8/10.0
- Livability +3.6/5.0
- Condition / age +2.5/5.0
$1,625,000
🖨 Deal sheet 📄 Offer letter ✓ Due diligence
Listing remarks MLS
Beautiful designer renovated home set on an idyllic pond in Water Mill North with water views from every room. Luxurious furnishings decorate this modern house with open plan living and two bedrooms in the main house. There is also a 300 sq. ft. air conditioned studio. Simple and perfect summer living, entertaining and relaxing. An outdoor shower awaits your return from the ocean beach, which is just a short drive away. Close to Southampton and Water Mill towns offering all you need for your practical, culinary and cultural needs.
Key facts
- Water views
- Open plan living
- Idyllic pond
Tags
Neighborhood map
What this means for you Summary
Snapshot
- This is a 2-bed/2.0-bath single-family listed at $1.62M.
Deal economics
- At list price, monthly cash flow is $16k ($194k/yr) — positive.
- The deal already cash-flows at list — no discount required.
- Meets the 1% rule at list price ($35k rent vs $1.62M).
- Recommended offer: $1.43M (12.0% below list) — sets the bar for market timing.
- Cap rate 18.5% vs local median 10.6% in Water Mill — top-decile yield for the area; either an underpriced asset or a hidden risk that comps aren't pricing in. Stress-test before assuming the spread holds.
Location & tenants
- Location reads 71/100 on livability (#410 in NY) — a middle-class / working-renter tenant base. Strengths: crime A+, employment A+, commute A-; Watch: amenities F, cost of living F, housing F.
- Southampton Union Free School District (suburban): math 53% / reading 51% proficiency, ranked #293 of 590 in NY (top 50%) — acceptable for families but not a draw, mixed tenant base, ~2y average lease.
- Market conditions: Rents rising fast (+30.1%/yr); 52 active listings in the ZIP; 4 comparable units currently listed for rent nearby; rentals lingering (median 44d on market — plan ~5-8 weeks vacancy on turnover, expect pricing pressure); 50% of comp listings sitting > 30 days — soft ceiling on asking rent; high-income renter base; 1,366 units permitted in Suffolk County in 2024 (216 in 5+ unit buildings).
- At $35,196/mo this rent would consume 234% of the median local household income ($180k/yr) — very limited rent-growth headroom before tenants either downsize or default.
Forward outlook
- In year one you build about $151k of equity ($11k loan paydown + $140k appreciation (8.6% local appreciation)).
- Suffolk County population projected to shrink 5% by 2050 — rents likely to lag national; underwrite the cash flow, not the appreciation.
- At projected returns (8.6% appreciation + 8.0% rent growth), your $455k cash investment doubles in ~2 years — after that, you're playing with house money.
- By year 2, paydown + projected appreciation supports a ~$243k cash-out refi (75% LTV) — recoverable capital for the next deal without selling this one.
Negotiation context
- It's been on market 186 days — a 12% lower offer ($1.43M) is reasonable based on typical stale-listing flexibility.
- Current owner paid $620k; list at $1.62M implies a 162% gain — meaningful room to come down on a strong offer.
Risks & watch-outs
- Watch-outs: flood insurance adds $427/mo.
- Climate carrying-cost: in FEMA flood zone AE (mandatory federal flood insurance); severe wind risk, 80% chance of damaging wind over 30y — expect insurance premiums to compound above CPI over the hold.
Questions for the listing agent
- It's been on market 186 days. Have you received any prior offers? Is the seller open to a 12% concession, seller financing, or rate buy-down credit?
- Built in 1970 — when were the roof, HVAC, electrical panel, plumbing, and water heater last replaced?
- What's the actual annual flood-insurance premium (NFIP or private), and is the property in a SFHA with mandatory coverage?
- Why hasn't it sold? Are there any deal-killer items the seller is aware of (foundation, flood, title, zoning, code violations)?
- Is there a deadline driving the sale (1031 exchange, divorce, estate, relocation)? That informs how much negotiation room exists.
- What's the average days-on-market for RENTAL listings here right now (not sales)? A rising rental-DOM trend means longer vacancies and softer asking-rent achievability than the comps imply.
- What's the recent tenant-quality profile in this submarket — average credit score on applications, eviction rate, late-payment / NSF rate, and stable-employment percentage? A property-management company in the area should have these aggregated.
- How much new for-sale + rental construction is in the pipeline within 1–3 miles? Heavy new supply typically softens prices + rents 12–24 months out; constrained supply supports both.
Investment metrics
- 1% rule
- 2.17% ✓
- Cap rate
- 18.53%
- Cash-on-cash
- 43.71%
- DSCR
- 2.95
- GRM
- 3.8
CMA / ARV
- ARV (median comp)
- $2,539,996
- List price
- $1,625,000
- Delta
- -36.02%
- Verdict
- UNDERPRICED
- Comps
- 4 within 1.0 mi
Projected returns pro-forma
8.63% appreciation · 8.0% rent growth · sell at horizon
- IRR
- 59.4%
- Equity multiple
- 5.29×
- Total profit
- $1,950,875
- Equity at exit
- $1,304,965
- IRR
- 56.1%
- Equity multiple
- 12.81×
- Total profit
- $5,371,930
- Equity at exit
- $2,660,544
Cash invested: $455,000 (down + closing). Projections, not guarantees.
Landlord ↔ Tenant lean methodology
- Overall (STATE)
- 15 Strongly Tenant-Friendly
- State New York
- 15 Strongly Tenant-Friendly · D+10
- County
- — inherits STATE
- City
- — inherits STATE
ZIP-level market 11976
- Home prices YoY
- 1.6%
- Rents YoY
- 30.1%
- Active inventory
- 52
- Price-to-rent
- 3.8×
Monthly cashflow live
- Estimated rent
- $35,196 medium interval (Pro) →
- Mortgage (P&I)
- −$8,522
- Tax est. 1.5%
- −$2,031 /mo · $24,375/yr
- Insurance
- −$677
- Flood insurance flood zone
- −$427 /mo · $5,118/yr
- HOA
- −$0
- Vacancy / Maint / Mgmt
- −$7,391
- Net cashflow
- $16,148
Break-even live
UW: 25.0% down · 7.5% · 30yr · 1.5% tax · 5.0% vac · 8.0% maint · 8.0% mgmt
Financing live
Cash to close
- Down payment
- $406,250
- Closing costs
- $48,750
- Reserves months
- —
- Total cash needed
- —
Loan-product check · same deal, 3 products live
Conventional
25% down · 7.5% · 30yr
- Down + closing
- —
- Monthly P&I
- —
- Monthly cashflow
- —
- DSCR
- —
- Eligible?
- —
Personal DTI + credit; lowest rate.
DSCR
20% down · 8.5% · 30yr
- Down + closing
- —
- Monthly P&I
- —
- Monthly cashflow
- —
- DSCR
- —
- Eligible?
- —
No personal income docs; deal must DSCR.
Hard money
10% down · 12.0% · 12mo
- Down + closing
- —
- Monthly P&I
- —
- Monthly cashflow
- —
- DSCR
- —
- Eligible?
- —
Short-term bridge; refi at stabilization.
Rent comps 4 comps
| Address | Beds | Baths | Sqft | Rent | $/sqft | DOM | Units | Dist |
|---|---|---|---|---|---|---|---|---|
| 570 Hampton Rd #28 Southampton, NY | 2.0 | 2.0 | 1400 | $55,000 | $39.29 | 22d | 1 | 1.07mi |
| 3 Meadowgrass Ln Southampton, NY | 3.0 | 2.0 | 1434 | $84,000 | $58.58 | 43d | 1 | 1.11mi |
| 10 Leland Ln #35 Southampton, NY | 2.0 | 2.0 | 1092 | $29,000 | $26.56 | 18d | 1 | 1.39mi |
| 10 Leland Ln #19 Southampton, NY | 3.0 | 3.0 | 1400 | $30,000 | $21.43 | 43d | 1 | 1.39mi |
Listing history 6 events
-
2026-06-02days on market $1,625,000 Active 186 DOM
-
2026-06-01days on market $1,625,000 Active 185 DOM
-
2026-05-31days on market $1,625,000 Active 184 DOM
-
2026-03-17price $1,625,000 536-char remark
Show marketing remark (536 chars)
Beautiful designer renovated home set on an idyllic pond in Water Mill North with water views from every room. Luxurious furnishings decorate this modern house with open plan living and two bedrooms in the main house. There is also a 300 sq. ft. air conditioned studio. Simple and perfect summer living, entertaining and relaxing. An outdoor shower awaits your return from the ocean beach, which is just a short drive away. Close to Southampton and Water Mill towns offering all you need for your practical, culinary and cultural needs.
-
2025-11-28$1,795,000 Active 536-char remark
Show marketing remark (536 chars)
Beautiful designer renovated home set on an idyllic pond in Water Mill North with water views from every room. Luxurious furnishings decorate this modern house with open plan living and two bedrooms in the main house. There is also a 300 sq. ft. air conditioned studio. Simple and perfect summer living, entertaining and relaxing. An outdoor shower awaits your return from the ocean beach, which is just a short drive away. Close to Southampton and Water Mill towns offering all you need for your practical, culinary and cultural needs.
-
2011-02-16soldstatus $620,000
ⓘ Source: listings_history table (triggers on properties + properties_extension) + one-shot
backfill from property_details.listing_events for pre-trigger history.
Climate risk First Street
- Flood 6/10 Major FEMA zone AE · 73% chance over 30 yrs
- Wildfire 1/10 Low
- Heat 4/10 Moderate 7 d/yr ≥90°F today · 20 d/yr by 30 yrs out
- Wind 8/10 Severe 80% chance of damaging wind over 30 yrs
- Air quality 3/10 Moderate 3 unhealthy d/yr today · 4 by 30 yrs out
Nearby sold comps map
Loading sold comps map…
Walkable amenities ~0.75 mi
Loading nearby amenities…
Taxation est. · year 1
- Rental income
- $422,351
- − Mortgage interest
- −$91,025
- − Property taxes
- −$24,375
- − Insurance
- −$13,244
- − Repairs & maintenance
- −$33,788
- − Management
- −$33,788
- − Depreciation
- −$47,273
- Taxable income
- $178,858
- Est. tax owed @ 24.0%
- −$42,926
- After-tax cash flow
- $150,852/yr
For passive investors: Depreciation is non-cash, so a rental often shows a tax loss while cash-flowing — sheltering income. Rental losses are passive: they offset passive income freely, and up to $25,000/yr can offset ordinary (W-2) income if you actively participate and your MAGI is under $100k (phasing out to $0 by $150k); unused losses carry forward. On sale, claimed depreciation is recaptured at up to 25%, and gains may owe capital-gains tax (a 1031 exchange can defer both). Figures are a year-1 estimate at your 24.0% rate — not tax advice; consult a CPA.
Schools (NCES district)
- District
- Southampton Union Free School District
- NCES district ID
- 3627540
- Math proficiency
- 53% ▬ 0.00%
- Reading proficiency
- 51% ▲ 4.00%
- Median HH income
- $85,977
- Composite
- 47.9/100
- National rank
- #2213
- State rank
- #293 of 590 in NY
Livability — Water Mill
- Score
- 71/100
- State rank
- #410
- US rank
- #7088
Category grades
Schools grade is shown separately in the Schools card above.
Census & demographics
- Census place
- Water Mill, NY
- County
- Suffolk County · 679,920 people
- City population
- 2,952
- Metro
- New York-Newark-Jersey City, NY-NJ-PA
- Population (ZIP)
- 2,952
- Household income
- $180,250
- Rent vs Own
Population outlook (Suffolk County) Hauer SSP2
- Today (2025)
- 1,505,262 people
- By 2030
- 1,498,318 · -0.5%
- By 2040
- 1,471,101 · -2.3%
- By 2050
- 1,424,848 · -5.3%
- By 2075
- 1,337,157 · -11.2%
- By 2100
- 1,217,720 · -19.1%
Race, ethnicity, and origin ACS 2023
- Neighborhood character
- Predominantly White (87%)
- Race & ethnicity
- White 87% Hispanic / Latino 9% Two or more races 9% Asian 2%
- Hispanic origin (detail)
- Mexican 1% Salvadoran 2%
- Common ancestry
- Romanian 16% Scotch-Irish 7% Italian 3%
- Foreign-born
- 11% · Canada, China
- Languages at home
- 86% English-only · Spanish 7% Other Indo-European 4% German/W. Germanic 1%
Political lean MEDSL · Suffolk
- 2024 margin
- Lean R (+10.0) · D 45.0% · R 55.0%
- 2008→2024 swing
- -16.0pp toward R · 2008: 6.0pp · 2024: -10.0pp
- All cycles
- 2024: R+10.0 2020: R+0.0 2016: R+8.2 2012: D+2.9 2008: D+6.0
Not yet ingested
- Civics
- —
Market trends
- HPI YoY
- ▲ 8.63%
- Current HPI
- 540.0967
- Rent YoY
- ▲ 30.05%
- Metro
- New York-Newark-Jersey City, NY-NJ-PA
- State GDP YoY
- ▲ 2.60%
- F500 in state
- 92
Industry mix (Fortune 500 HQ in NY)
| Industry | F500 HQs | Revenue |
|---|---|---|
| Financial Services | 10 | $950B |
|
||
| Consumer Goods | 9 | $162B |
|
||
| Insurance | 4 | $225B |
|
||
| Telecommunications | 2 | $144B |
|
||
| Pharmaceuticals | 2 | $112B |
|
||
| Media / Entertainment | 2 | $69B |
|
||
Price history
+162.1% since first listed3 events — show timeline
- 2026-03-17 Price Changed $1,625,000 OneKey® MLS as Distributed by MLS Grid
- 2025-11-28 Listed $1,795,000 OneKey® MLS as Distributed by MLS Grid
- 2011-02-16 Sold (Public Records) $620,000 Public Records
Property tax history
-1.7%/yrLatest (2024): $3,195 · +0.0% YoY. Source: county tax records.
Cash-flow waterfall
monthlySold comps — $/sqft
last 12 mo · ≤1 miLoading sold comps…