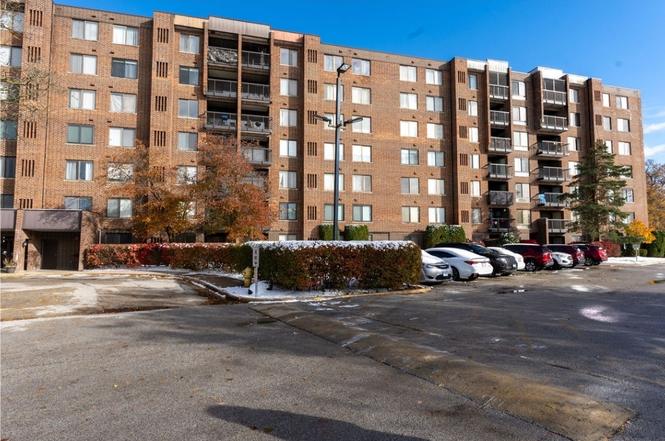
400 Park Ave #703 · Calumet City, IL
Flood risk 4/10 · Minor
- FEMA flood zone
- X (shaded)
- Chance of flooding over 30 yrs
- 0.21%
- Est. flood insurance / yr
- $507 – $1,088
Fire risk 1/10 · Minimal
- Est. fire insurance / yr
- $804 – $1,492
Heat risk 3/10 · Minor
- Hot days now (above 103°F)
- 7 days/yr
- Hot days in 30 yrs
- 15 days/yr
Wind risk 2/10 · Minimal
- Chance of severe wind over 30 yrs
- —
Air-quality risk 4/10 · Minor
- Unhealthy air days now
- 4 days/yr
- Unhealthy air days in 30 yrs
- 5 days/yr
Risk factors via First Street. Map © Google.
Why this score? — see what drove the C+ grade
The composite is a weighted blend of 9 inputs, each scored 0–100. Each bar is that input's sub-score; the figure is the points it added to the 100-point composite (weight × sub-score).
- Cash flow +25.9/30.0
- 1% rule +10.0/10.0
- DSCR +8.7/10.0
- ARV discount +7.5/15.0
- Rent growth +4.0/5.0
- Livability +3.6/5.0
- Condition / age +2.5/5.0
- Schools +0.7/10.0
- Appreciation +0.0/10.0
$60,000
🖨 Deal sheet 📄 Offer letter ✓ Due diligence
Listing remarks
LOOK AT THIS BEAUTY!!! THIS TOP FLOOR PENTHOUSE UNIT HAS SO MUCH TO OFFER. A LARGE BEDROOM WITH A WALK-IN CLOSET & A 2ND CLOSET, LOTS OF STORAGE SPACE IN UNIT, WITH ADDITIONAL STORAGE UNIT ON THE SAME FLOOR AS THE UNIT, A PRIVATE BALCONY FOR YOU TO RELAX AND UNWIRED, PLENTY OF PARKING, WASHER AND DRYER IN UNIT, ELEVATORS, ACCESS TO THE POOL, PARK, GOLF COURSE, TENNIS COURTS, RESTUARANTS, SHOPPING STORES, NEWER APPLIANCES (STOVE, FRIG AND WASHER & DRYER), GAS FIREPLACE, HEATING GAS INNCLUDED IN HOA FEE, AIR COMPRESSOR 1 YR OLD, CLOSE TO I94, 24 HOURS SECURITY. BEAUTIFUL SCENERY JUST PEACEFUL & QUIETNESS. COME SEE AND BUY!!!
Key facts
- Private balcony
- Large bedroom
- Storage space
Tags
Property features AI
Finance
- Other: No pets allowed
- Financial info:
- HOA & community: Monthly association fee of $410; Master association fee of $110 monthly; Association covers heat, water, insurance, lawn care, and snow removal; Community amenities include storage, golf course access, pool, tennis courts, elevators
Exterior
- Parking:
- Security: Private entry road with security booth (complex access)
- Utilities: Water from Lake Michigan and public supply; Public sewer
- Home design: Attached single condo; Entry located on level 7; Part of a multi-unit building (133 units)
- Construction: Brick construction; Built approximately 41–50 years ago
- Exterior features: Balcony; In-ground pool; Condo setting with shared amenities (private entry road and security booth for the complex)
Interior
- Kitchen: Kitchen on main level (10 x 14)
- Bedrooms: Master bedroom on main level (14 x 14) with carpet; Additional bedrooms; Bedroom 2; Bedroom 3; Bedroom 4
- Flooring: Carpet in living room and master bedroom
- Bathrooms: One full bath with soaking tub
- Heating & cooling: Natural gas heating; Central air conditioning
- Interior features: Three total rooms; Window screens; Living room fireplace with gas starter
- Laundry & utility: In-unit laundry on main level (6 x 6); Gas dryer hookup
Neighborhood map
What this means for you Summary
Snapshot
- This is a 1-bed/1.0-bath condo listed at $60k.
Deal economics
- At list price, monthly cash flow is $147 ($2k/yr) — positive.
- The deal already cash-flows at list — no discount required.
- Meets the 1% rule at list price ($1k rent vs $60k).
- Recommended offer: $56k (6.0% below list) — sets the bar for market timing.
Location & tenants
- Location reads 71/100 on livability (#330 in IL) — a middle-class / working-renter tenant base. Strengths: commute A+, cost of living A+, housing A+; Watch: employment C-, schools F, crime D-.
- Thornton Twp Hsd 205 (suburban): math 7% / reading 8% proficiency, ranked #594 of 620 in IL (top 96%) — low school quality limits family demand, transient renter base, plan for 1-2y turnover.
- Market conditions: Rents rising fast (+6.2%/yr); 198 active listings in the ZIP; 1 comparable units currently listed for rent nearby; 6,272 units permitted in Cook County in 2024 (4,658 in 5+ unit buildings).
Forward outlook
- Local home prices are declining (-3.0%/yr); year-one equity from $415 of loan paydown is wiped out by about $2k of value loss. Plan a longer hold.
- At projected returns (-3.0% appreciation + 6.2% rent growth), your $17k cash investment doubles in ~7 years — after that, you're playing with house money.
Negotiation context
- It's been on market 90 days — a 6% lower offer ($56k) is reasonable based on typical stale-listing flexibility.
Risks & watch-outs
- Watch-outs: HOA is 38% of rent.
Questions for the listing agent
- It's been on market 90 days. Have you received any prior offers? Is the seller open to a 6% concession, seller financing, or rate buy-down credit?
- Built in 1978 — when were the roof, HVAC, electrical panel, plumbing, and water heater last replaced?
- What does the HOA fee cover, when was the last increase, and are there any pending special assessments or reserve-fund shortfalls?
- Any open or pending special assessments — roof, HVAC, plumbing, elevator, façade? What's the per-unit balance and payoff schedule, and is the seller paying it off at close or rolling it to the buyer?
- Why hasn't it sold? Are there any deal-killer items the seller is aware of (foundation, flood, title, zoning, code violations)?
- Is there a deadline driving the sale (1031 exchange, divorce, estate, relocation)? That informs how much negotiation room exists.
- Schools are F-rated, which usually means shorter tenancies and higher turnover. Who's the typical renter profile here, and what's been the actual vacancy rate?
- Crime grade is D in this area — have there been break-ins, vandalism, or insurance claims at this property in the last 3 years? What carrier currently insures it and at what premium?
- What's the average days-on-market for RENTAL listings here right now (not sales)? A rising rental-DOM trend means longer vacancies and softer asking-rent achievability than the comps imply.
- What's the recent tenant-quality profile in this submarket — average credit score on applications, eviction rate, late-payment / NSF rate, and stable-employment percentage? A property-management company in the area should have these aggregated.
- How much new apartment / multifamily construction is in the pipeline within 1–3 miles? Heavy new supply (>2% of stock underway) typically softens rents 12–24 months out; light construction supports rent growth.
Investment metrics
- 1% rule
- 2.28% ✓
- Cap rate
- 9.24%
- Cash-on-cash
- 10.52%
- DSCR
- 1.47
- GRM
- 3.7
CMA / ARV
No comps found within radius.
Projected returns pro-forma
-3.0% appreciation · 6.17% rent growth · sell at horizon
- IRR
- 6.4%
- Equity multiple
- 1.27×
- Total profit
- $4,506
- Equity at exit
- $8,946
- IRR
- 20.4%
- Equity multiple
- 3.21×
- Total profit
- $37,125
- Equity at exit
- $5,188
Cash invested: $16,800 (down + closing). Projections, not guarantees.
Landlord ↔ Tenant lean methodology
- Overall (STATE)
- 43 Moderately Tenant-Leaning
- State Illinois
- 43 Moderately Tenant-Leaning · D+7
- County
- — inherits STATE
- City
- — inherits STATE
ZIP-level market 60409
- Home prices YoY
- -27.6%
- Rents YoY
- 6.2%
- Active inventory
- 198
- Price-to-rent
- 3.7×
Monthly cashflow live
- Estimated rent
- $1,370 medium interval (Pro) →
- Mortgage (P&I)
- −$315
- Tax est. 1.5%
- −$75 /mo · $900/yr
- Insurance
- −$25
- HOA
- −$520
- Vacancy / Maint / Mgmt
- −$288
- Net cashflow
- $147
Break-even live
UW: 25.0% down · 7.5% · 30yr · 1.5% tax · 5.0% vac · 8.0% maint · 8.0% mgmt
Financing live
Cash to close
- Down payment
- $15,000
- Closing costs
- $1,800
- Reserves months
- —
- Total cash needed
- —
Loan-product check · same deal, 3 products live
Conventional
25% down · 7.5% · 30yr
- Down + closing
- —
- Monthly P&I
- —
- Monthly cashflow
- —
- DSCR
- —
- Eligible?
- —
Personal DTI + credit; lowest rate.
DSCR
20% down · 8.5% · 30yr
- Down + closing
- —
- Monthly P&I
- —
- Monthly cashflow
- —
- DSCR
- —
- Eligible?
- —
No personal income docs; deal must DSCR.
Hard money
10% down · 12.0% · 12mo
- Down + closing
- —
- Monthly P&I
- —
- Monthly cashflow
- —
- DSCR
- —
- Eligible?
- —
Short-term bridge; refi at stabilization.
Rent comps 1 comps
| Address | Beds | Baths | Sqft | Rent | $/sqft | DOM | Units | Dist |
|---|---|---|---|---|---|---|---|---|
| 1450 E 154th Pl Dolton, IL | 1.0 | 1.0 | 800 | $1,250 | $1.56 | 24d | 1 | 1.31mi |
HOA detail condo
- Monthly dues
- $520 · $6,240/yr
- Likely covers
- gaspoolsecurity
- Assessments
- None detected in remarks — confirm with the listing agent.
Listing history 15 events
-
2026-06-18days on market $60,000 Active 90 DOM
-
2026-06-17days on market $60,000 Active 89 DOM
-
2026-06-16days on market $60,000 Active 88 DOM
-
2026-06-15days on market $60,000 Active 87 DOM
-
2026-06-13days on market $60,000 Active 85 DOM
-
2026-06-13days on market $60,000 Active 84 DOM
-
2026-06-09days on market $60,000 Active 81 DOM
-
2026-06-08days on market $60,000 Active 80 DOM
-
2026-06-07days on market $60,000 Active 79 DOM
-
2026-06-04days on market $60,000 Active 76 DOM
-
2026-06-03days on market $60,000 Active 75 DOM
-
2026-06-02days on market $60,000 Active 74 DOM
-
2026-06-01days on market $60,000 Active 73 DOM
-
2026-05-31days on market $60,000 Active 72 DOM
-
2026-04-09historical
ⓘ Source: listings_history table (triggers on properties + properties_extension) + one-shot
backfill from property_details.listing_events for pre-trigger history.
Climate risk First Street
- Flood 4/10 Moderate FEMA zone X (shaded) · 21% chance over 30 yrs
- Wildfire 1/10 Low
- Heat 3/10 Moderate 7 d/yr ≥103°F today · 15 d/yr by 30 yrs out
- Wind 2/10 Low
- Air quality 4/10 Moderate 4 unhealthy d/yr today · 5 by 30 yrs out
Nearby sold comps map
Loading sold comps map…
Walkable amenities ~0.75 mi
Loading nearby amenities…
Taxation est. · year 1
- Rental income
- $16,435
- − Mortgage interest
- −$3,361
- − Property taxes
- −$900
- − Insurance
- −$300
- − Repairs & maintenance
- −$1,315
- − Management
- −$1,315
- − HOA
- −$6,240
- − Depreciation
- −$1,745
- Taxable income
- $1,259
- Est. tax owed @ 24.0%
- −$302
- After-tax cash flow
- $1,465/yr
For passive investors: Depreciation is non-cash, so a rental often shows a tax loss while cash-flowing — sheltering income. Rental losses are passive: they offset passive income freely, and up to $25,000/yr can offset ordinary (W-2) income if you actively participate and your MAGI is under $100k (phasing out to $0 by $150k); unused losses carry forward. On sale, claimed depreciation is recaptured at up to 25%, and gains may owe capital-gains tax (a 1031 exchange can defer both). Figures are a year-1 estimate at your 24.0% rate — not tax advice; consult a CPA.
Schools (NCES district)
- District
- Thornton Twp Hsd 205
- NCES district ID
- 1738970
- Math proficiency
- 7% ▬ 0.00%
- Reading proficiency
- 8% ▼ -2.00%
- Median HH income
- $43,392
- Composite
- 6.92/100
- National rank
- #9976
- State rank
- #594 of 620 in IL
Livability — Calumet City
- Score
- 71/100
- State rank
- #330
- US rank
- #6552
Category grades
Schools grade is shown separately in the Schools card above.
Census & demographics
- Census place
- Calumet City, IL
- County
- Cook County · 4,486,803 people
- City population
- 35,100
- Metro
- Chicago-Naperville-Elgin, IL-IN-WI
- Population (ZIP)
- 35,100
- Household income
- $55,369
- Rent vs Own
- Severe rent burden
- 2415.0
Population outlook (Cook County) Hauer SSP2
- Today (2025)
- 5,347,519 people
- By 2030
- 5,357,703 · +0.2%
- By 2040
- 5,324,924 · -0.4%
- By 2050
- 5,230,762 · -2.2%
- By 2075
- 4,785,735 · -10.5%
- By 2100
- 4,188,836 · -21.7%
Race, ethnicity, and origin ACS 2023
- Neighborhood character
- Predominantly Black (74%)
- Race & ethnicity
- Black 74% Hispanic / Latino 15% White 7% Two or more races 4%
- Hispanic origin (detail)
- Mexican 14%
- Common ancestry
- Romanian 2%
- Foreign-born
- 9% · Canada
- Languages at home
- 83% English-only · Spanish 14%
Political lean MEDSL · Cook
- 2024 margin
- Solid D (+42.0) · D 70.4% · R 28.4% · Other 1.2%
- 2008→2024 swing
- -11.4pp toward R · 2008: 53.4pp · 2024: 42.0pp
- All cycles
- 2024: D+42.0 2020: D+50.3 2016: D+53.0 2012: D+49.4 2008: D+53.4
Not yet ingested
- Civics
- —
Market trends
- HPI YoY
- ▼ -75.01%
- Current HPI
- 197.2137
- Rent YoY
- ▲ 6.17%
- Metro
- Chicago-Naperville-Elgin, IL-IN-WI
- State GDP YoY
- ▲ 1.59%
- F500 in state
- 60
Industry mix (Fortune 500 HQ in IL)
| Industry | F500 HQs | Revenue |
|---|---|---|
| Insurance | 4 | $201B |
|
||
| Consumer Goods | 4 | $87B |
|
||
| Industrial Machinery | 3 | $64B |
|
||
| Healthcare | 2 | $55B |
|
||
| Retail / Pharmacy | 1 | $148B |
|
||
| Agriculture / Food | 1 | $86B |
|
||
Cash-flow waterfall
monthlySold comps — $/sqft
last 12 mo · ≤1 miLoading sold comps…