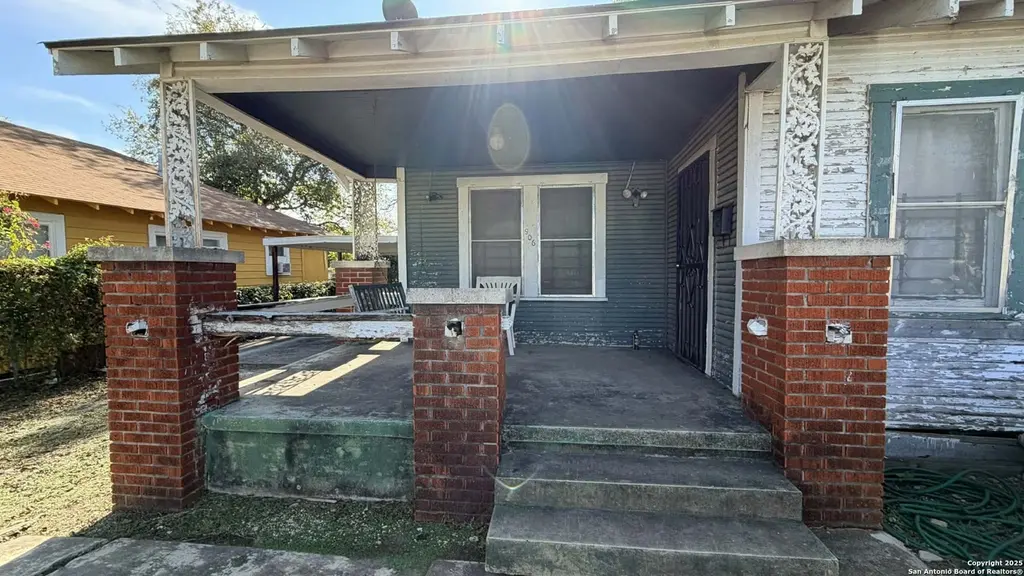
906 Canton · San Antonio, TX
Flood risk 1/10 · Minimal
- FEMA flood zone
- X (unshaded)
- Chance of flooding over 30 yrs
- 0.0%
- Est. flood insurance / yr
- $507 – $1,088
Fire risk 1/10 · Minimal
- Est. fire insurance / yr
- $1,222 – $2,270
Heat risk 8/10 · Major
- Hot days now (above 108°F)
- 7 days/yr
- Hot days in 30 yrs
- 22 days/yr
Wind risk 8/10 · Major
- Chance of severe wind over 30 yrs
- 80.0%
Air-quality risk 2/10 · Minimal
- Unhealthy air days now
- 0 days/yr
- Unhealthy air days in 30 yrs
- 2 days/yr
Risk factors via First Street. Map © Google.
Why this score? — see what drove the B grade
The composite is a weighted blend of 9 inputs, each scored 0–100. Each bar is that input's sub-score; the figure is the points it added to the 100-point composite (weight × sub-score).
- Cash flow +21.4/30.0
- ARV discount +15.0/15.0
- Appreciation +10.0/10.0
- DSCR +6.8/10.0
- 1% rule +6.5/10.0
- Rent growth +4.5/5.0
- Livability +4.0/5.0
- Condition / age +2.5/5.0
- Schools +1.4/10.0
$125,000
🖨 Deal sheet 📄 Offer letter ✓ Due diligence
Listing remarks MLS
Positioned on a large lot in one of San Antonio's fastest-revitalizing areas, this 3-bed, 2-bath property presents a strong opportunity for investors seeking meaningful upside. Located just minutes from Downtown, The Pearl, the Alamodome, Frost Bank Center, and major highway access, the demand in this corridor continues to grow from both renters and future buyers. The lot size offers the flexibility to reimagine the footprint, expand the layout, or pursue a design that aligns with neighborhood trends and long-term value. For those looking to secure a high-potential property in a market with clear forward momentum, this one stands out.
Key facts
- Large lot
- 6,403 sq ft lot
- Built 1929
Tags
Neighborhood map
What this means for you Summary
Snapshot
- This is a 3-bed/1.0-bath single-family listed at $125k.
Deal economics
- At list price, monthly cash flow is $185 ($2k/yr) — positive.
- The deal already cash-flows at list — no discount required.
- Meets the 1% rule at list price ($1k rent vs $125k).
- Recommended offer: $110k (12.0% below list) — sets the bar for market timing.
- Cap rate 8.1% vs local median 3.8% in San Antonio — top-decile yield for the area; either an underpriced asset or a hidden risk that comps aren't pricing in. Stress-test before assuming the spread holds.
Location & tenants
- Location reads 80/100 on livability (#31 in TX, #1,616 nationally) — a professional / high-income tenant draw. Strengths: amenities A+, commute A+, cost of living A+; Watch: schools C-, crime F.
- San Antonio ISD (urban): math 12% / reading 22% proficiency, ranked #805 of 826 in TX (top 98%) — low school quality limits family demand, transient renter base, plan for 1-2y turnover; 80% free/reduced lunch — lower-income household profile, screen leases tightly.
- Market conditions: Rents rising fast (+8.2%/yr); 196 active listings in the ZIP; 40 comparable units currently listed for rent nearby; rentals at typical pace (median 24d on market — plan ~3-4 weeks tenant-placement turnaround); 8,308 units permitted in Bexar County in 2024 (2,506 in 5+ unit buildings).
- This rent runs 36% of the median local income ($47k/yr) — at the standard rent-burdened threshold; future hikes will face affordability resistance.
Forward outlook
- In year one you build about $13k of equity ($864 loan paydown + $12k appreciation (10.0% local appreciation)).
- Bexar County population projected at +50% by 2050 — long-run rental-demand tailwind backs the buy-and-hold thesis.
- At projected returns (10.0% appreciation + 8.0% rent growth), your $35k cash investment doubles in ~3 years — after that, you're playing with house money.
- By year 3, paydown + projected appreciation supports a ~$34k cash-out refi (75% LTV) — recoverable capital for the next deal without selling this one.
Negotiation context
- It's been on market 197 days — a 12% lower offer ($110k) is reasonable based on typical stale-listing flexibility.
Risks & watch-outs
- Watch-outs: built in 1929 — expect roof / HVAC / electrical / plumbing capex.
- Climate carrying-cost: severe wind risk, 80% chance of damaging wind over 30y; extreme-heat days projected 7→22/yr by 2055 (HVAC capex compounding) — expect insurance premiums to compound above CPI over the hold.
Questions for the listing agent
- It's been on market 197 days. Have you received any prior offers? Is the seller open to a 12% concession, seller financing, or rate buy-down credit?
- Built in 1929 — when were the roof, HVAC, electrical panel, plumbing, and water heater last replaced?
- Why hasn't it sold? Are there any deal-killer items the seller is aware of (foundation, flood, title, zoning, code violations)?
- Is there a deadline driving the sale (1031 exchange, divorce, estate, relocation)? That informs how much negotiation room exists.
- Crime grade is F in this area — have there been break-ins, vandalism, or insurance claims at this property in the last 3 years? What carrier currently insures it and at what premium?
- What's the average days-on-market for RENTAL listings here right now (not sales)? A rising rental-DOM trend means longer vacancies and softer asking-rent achievability than the comps imply.
- What's the recent tenant-quality profile in this submarket — average credit score on applications, eviction rate, late-payment / NSF rate, and stable-employment percentage? A property-management company in the area should have these aggregated.
- How much new for-sale + rental construction is in the pipeline within 1–3 miles? Heavy new supply typically softens prices + rents 12–24 months out; constrained supply supports both.
Investment metrics
- 1% rule
- 1.15% ✓
- Cap rate
- 8.07%
- Cash-on-cash
- 6.33%
- DSCR
- 1.28
- GRM
- 7.2
CMA / ARV
- ARV (median comp)
- $168,423
- List price
- $125,000
- Delta
- -25.78%
- Verdict
- UNDERPRICED
- Comps
- 20 within 1.0 mi
Show comp detail 12 sales within ~0.75 mi
| Address | Dist | Beds/Ba | Sqft | Sold | Price | $/sf | Match |
|---|---|---|---|---|---|---|---|
| 2055 E Crockett St | 0.18mi | 3/1.0 | 1,054 (-4%) | 5mo | $120,000 | $114 | 81 |
| 2710 E Houston St | 0.15mi | 3/1.0 | 1,017 (-7%) | 2mo | $185,000 | $182 | 80 |
| 2118 Burnet | 0.42mi | 3/2.5 | 1,088 (-0%) | 3mo | $130,000 | $119 | 71 |
| 1102 Onslow | 0.35mi | 3/2.0 | 995 (-9%) | 6mo | $119,950 | $121 | 60 |
| 1341 Paso Hondo | 0.39mi | 3/2.0 | 1,008 (-8%) | 7mo | $239,900 | $238 | 59 |
| 822 Potomac | 0.54mi | 3/1.0 | 1,012 (-7%) | 5mo | $79,900 | $79 | 59 |
| 1410 Paso Hondo | 0.35mi | 3/2.0 | 1,219 (+12%) | 4mo | $159,000 | $130 | 56 |
| 515 South Grimes | 0.65mi | 3/2.0 | 1,155 (+6%) | 3mo | $239,000 | $207 | 54 |
| 2111 Lamar | 0.49mi | 3/1.0 | 1,238 (+13%) | 5mo | $62,500 | $50 | 51 |
| 2846 Wyoming St | 0.45mi | 3/2.0 | 1,255 (+15%) | 1mo | $185,000 | $147 | 49 |
| 1719 Dawson St | 0.64mi | 3/2.0 | 1,210 (+11%) | 4mo | $210,000 | $174 | 45 |
| 342 Canton | 0.74mi | 2/1.0 (-1) | 990 (-9%) | 5mo | $130,000 | $131 | 41 |
Match score weights: distance 35% · size 25% · config 20% · recency 20%. Top-matched comps best support the ARV.
Projected returns pro-forma
10.0% appreciation · 8.0% rent growth · sell at horizon
- IRR
- 31.1%
- Equity multiple
- 3.50×
- Total profit
- $87,528
- Equity at exit
- $112,610
- IRR
- 28.7%
- Equity multiple
- 8.64×
- Total profit
- $267,507
- Equity at exit
- $242,848
Cash invested: $35,000 (down + closing). Projections, not guarantees.
Landlord ↔ Tenant lean methodology
- Overall (STATE)
- 87 Strongly Landlord-Friendly
- State Texas
- 87 Strongly Landlord-Friendly · R+5
- County
- — inherits STATE
- City
- — inherits STATE
ZIP-level market 78202
- Home prices YoY
- 27.0%
- Rents YoY
- 8.2%
- Active inventory
- 196
- Price-to-rent
- 7.2×
Monthly cashflow live
- Estimated rent
- $1,440 high interval (Pro) →
- Mortgage (P&I)
- −$656
- Tax from tax record
- −$245 /mo · $2,942/yr
- Insurance
- −$52
- HOA
- −$0
- Vacancy / Maint / Mgmt
- −$302
- Net cashflow
- $185
Break-even live
UW: 25.0% down · 7.5% · 30yr · 1.5% tax · 5.0% vac · 8.0% maint · 8.0% mgmt
Financing live
Cash to close
- Down payment
- $31,250
- Closing costs
- $3,750
- Reserves months
- —
- Total cash needed
- —
Loan-product check · same deal, 3 products live
Conventional
25% down · 7.5% · 30yr
- Down + closing
- —
- Monthly P&I
- —
- Monthly cashflow
- —
- DSCR
- —
- Eligible?
- —
Personal DTI + credit; lowest rate.
DSCR
20% down · 8.5% · 30yr
- Down + closing
- —
- Monthly P&I
- —
- Monthly cashflow
- —
- DSCR
- —
- Eligible?
- —
No personal income docs; deal must DSCR.
Hard money
10% down · 12.0% · 12mo
- Down + closing
- —
- Monthly P&I
- —
- Monthly cashflow
- —
- DSCR
- —
- Eligible?
- —
Short-term bridge; refi at stabilization.
Rent comps 40 comps
| Address | Beds | Baths | Sqft | Rent | $/sqft | DOM | Units | Dist |
|---|---|---|---|---|---|---|---|---|
| 2818 E Houston St San Antonio, TX | 3.0 | 1.0 | 1184 | $1,495 | $1.26 | 14d | 1 | 0.06mi |
| 906 Gulf St Unit 102 San Antonio, TX | 3.0 | 2.0 | 1300 | $1,750 | $1.35 | 4d | 1 | 0.12mi |
| 1650 Gorman San Antonio, TX | 2.0 | 1.0 | 950 | $1,111 | $1.17 | 23d | 1 | 0.20mi |
| 1622 Gorman San Antonio, TX | 3.0 | 2.0 | 1189 | $1,325 | $1.11 | 17d | 1 | 0.23mi |
| 746 Gulf San Antonio, TX | 2.0 | 1.0 | 744 | $975 | $1.31 | 14d | 1 | 0.23mi |
| 742 Gulf St Unit 746 San Antonio, TX | 2.0 | 1.0 | 744 | $975 | $1.31 | 12d | 1 | 0.25mi |
| 1435 Gibbs San Antonio, TX | 3.0 | 1.0 | 975 | $1,435 | $1.47 | 23d | 1 | 0.27mi |
| 932 Poinsettia St San Antonio, TX | 2.0 | 1.0 | 800 | $945 | $1.18 | 43d | 1 | 0.28mi |
| 706 Canton San Antonio, TX | 2.0 | 1.0 | 994 | $1,545 | $1.55 | 23d | 1 | 0.30mi |
| 610 Belmont San Antonio, TX | 2.0 | 1.0 | 1050 | $1,195 | $1.14 | 43d | 1 | 0.30mi |
| 1510 Gorman San Antonio, TX | 2.0 | 1.0 | 996 | $1,300 | $1.31 | 17d | 1 | 0.30mi |
| 1414 Gorman San Antonio, TX | 2.0 | 1.0 | 900 | $1,175 | $1.31 | 43d | 1 | 0.34mi |
| 639 Canton San Antonio, TX | 2.0 | 1.0 | 1008 | $1,295 | $1.28 | 43d | 1 | 0.36mi |
| 2239 Burnet St San Antonio, TX | 3.0 | 2.0 | 1097 | $1,450 | $1.32 | 43d | 1 | 0.37mi |
| 710 Poinsettia San Antonio, TX | 2.0 | 1.0 | 708 | $1,195 | $1.69 | 43d | 1 | 0.40mi |
| 2118 Burnet St San Antonio, TX | 3.0 | 2.0 | 1008 | $1,650 | $1.64 | 3d | 1 | 0.43mi |
| 607 Gulf San Antonio, TX | 3.0 | 2.0 | 1482 | $1,395 | $0.94 | 23d | 1 | 0.46mi |
| 2142 Lamar St San Antonio, TX | 2.0 | 1.0 | 900 | $1,100 | $1.22 | 43d | 1 | 0.48mi |
| 227 S Grimes St Unit 202 San Antonio, TX | 3.0 | 2.5 | 1089 | $1,550 | $1.42 | 43d | 1 | 0.49mi |
| 2006 Hays St San Antonio, TX | 3.0 | 2.0 | 1176 | $1,750 | $1.49 | 19d | 1 | 0.50mi |
| 1223 N Walters St Unit 710 San Antonio, TX | 2.0 | 2.0 | 970 | $1,047 | $1.08 | 3d | 1 | 0.57mi |
| 314 Maryland St Unit 102 San Antonio, TX | 2.0 | 2.5 | 1055 | $1,295 | $1.23 | 43d | 1 | 0.59mi |
| 452 Gulf San Antonio, TX | 3.0 | 1.0 | 1244 | $1,899 | $1.53 | 21d | 1 | 0.61mi |
| 311 Spriggsdale Ave Unit 710 San Antonio, TX | 2.0 | 2.0 | 890 | $981 | $1.10 | 3d | 1 | 0.63mi |
| 518 Rotary San Antonio, TX | 3.0 | 1.0 | 1080 | $1,225 | $1.13 | 14d | 1 | 0.64mi |
| 438 Gulf St San Antonio, TX | 2.0 | 1.0 | 799 | $975 | $1.22 | 14d | 1 | 0.65mi |
| 1104 N Gevers St San Antonio, TX | 3.0 | 2.5 | 1276 | $1,725 | $1.35 | 43d | 1 | 0.67mi |
| 215 Edna Ave San Antonio, TX | 2.0 | 1.0 | 968 | $1,260 | $1.30 | 43d | 1 | 0.70mi |
| 1111 Gibbs San Antonio, TX | 3.0 | 2.0 | 1476 | $1,595 | $1.08 | 23d | 1 | 0.71mi |
| 1101 Gibbs San Antonio, TX | 3.0 | 1.0 | 1100 | $1,345 | $1.22 | 23d | 1 | 0.73mi |
| 1101 Gibbs San Antonio, TX | 3.0 | 1.0 | 1100 | $1,345 | $1.22 | 14d | 1 | 0.73mi |
| 406 Como St San Antonio, TX | 3.0 | 1.5 | 1278 | $1,350 | $1.06 | 43d | 1 | 0.77mi |
| 143 Ranger Unit 101 San Antonio, TX | 3.0 | 2.0 | 876 | $1,099 | $1.25 | 1d | 1 | 0.78mi |
| 418 Lockhart San Antonio, TX | 4.0 | 2.0 | 1479 | $1,799 | $1.22 | 21d | 1 | 0.82mi |
| 418 Lockhart St Unit 1 San Antonio, TX | 4.0 | 2.0 | 1479 | $1,590 | $1.08 | 43d | 1 | 0.82mi |
| 323 Gabriel Unit 1 101 San Antonio, TX | 3.0 | 2.5 | 1400 | $1,950 | $1.39 | 23d | 1 | 0.84mi |
| 323 Gabriel San Antonio, TX | 3.0 | 2.0 | 1400 | $1,950 | $1.39 | 21d | 1 | 0.84mi |
| 323 Gabriel San Antonio, TX | 2.0 | 2.0 | 1000 | $1,375 | $1.38 | 23d | 1 | 0.84mi |
| 323 Gabriel Unit 1 201 San Antonio, TX | 2.0 | 2.5 | 1000 | $1,375 | $1.38 | 43d | 1 | 0.84mi |
| 1615 Nolan St Unit A San Antonio, TX | 2.0 | 1.0 | 1066 | $1,400 | $1.31 | 10d | 1 | 0.85mi |
Listing history 18 events
-
2026-06-18days on market $125,000 Active 197 DOM
-
2026-06-17days on market $125,000 Active 196 DOM
-
2026-06-16days on market $125,000 Active 195 DOM
-
2026-06-15days on market $125,000 Active 194 DOM
-
2026-06-13statusdays on market $125,000 Active 192 DOM
-
2026-06-09days on market $125,000 Price Change 188 DOM
-
2026-06-08days on market $125,000 Price Change 187 DOM
-
2026-06-07days on market $125,000 Price Change 186 DOM
-
2026-06-04days on market $125,000 Price Change 183 DOM
-
2026-06-03days on market $125,000 Price Change 182 DOM
-
2026-06-02days on market $125,000 Price Change 181 DOM
-
2026-06-02pricestatus $125,000 Price Change 180 DOM
-
2026-06-01days on market $135,000 Active 180 DOM
-
2026-05-31days on market $135,000 Active 179 DOM
-
2026-05-07price $135,000 645-char remark
Show marketing remark (645 chars)
Positioned on a large lot in one of San Antonio's fastest-revitalizing areas, this 3-bed, 2-bath property presents a strong opportunity for investors seeking meaningful upside. Located just minutes from Downtown, The Pearl, the Alamodome, Frost Bank Center, and major highway access, the demand in this corridor continues to grow from both renters and future buyers. The lot size offers the flexibility to reimagine the footprint, expand the layout, or pursue a design that aligns with neighborhood trends and long-term value. For those looking to secure a high-potential property in a market with clear forward momentum, this one stands out.
-
2026-04-09price $145,000 645-char remark
Show marketing remark (645 chars)
Positioned on a large lot in one of San Antonio's fastest-revitalizing areas, this 3-bed, 2-bath property presents a strong opportunity for investors seeking meaningful upside. Located just minutes from Downtown, The Pearl, the Alamodome, Frost Bank Center, and major highway access, the demand in this corridor continues to grow from both renters and future buyers. The lot size offers the flexibility to reimagine the footprint, expand the layout, or pursue a design that aligns with neighborhood trends and long-term value. For those looking to secure a high-potential property in a market with clear forward momentum, this one stands out.
-
2026-03-04price $155,000 645-char remark
Show marketing remark (645 chars)
Positioned on a large lot in one of San Antonio's fastest-revitalizing areas, this 3-bed, 2-bath property presents a strong opportunity for investors seeking meaningful upside. Located just minutes from Downtown, The Pearl, the Alamodome, Frost Bank Center, and major highway access, the demand in this corridor continues to grow from both renters and future buyers. The lot size offers the flexibility to reimagine the footprint, expand the layout, or pursue a design that aligns with neighborhood trends and long-term value. For those looking to secure a high-potential property in a market with clear forward momentum, this one stands out.
-
2025-12-03$165,000 New 645-char remark
Show marketing remark (645 chars)
Positioned on a large lot in one of San Antonio's fastest-revitalizing areas, this 3-bed, 2-bath property presents a strong opportunity for investors seeking meaningful upside. Located just minutes from Downtown, The Pearl, the Alamodome, Frost Bank Center, and major highway access, the demand in this corridor continues to grow from both renters and future buyers. The lot size offers the flexibility to reimagine the footprint, expand the layout, or pursue a design that aligns with neighborhood trends and long-term value. For those looking to secure a high-potential property in a market with clear forward momentum, this one stands out.
ⓘ Source: listings_history table (triggers on properties + properties_extension) + one-shot
backfill from property_details.listing_events for pre-trigger history.
Tax reassessment forecast TX · Resets to sale price
- Current annual tax
- $2,942 · $245/mo
- Projected year-2 tax
- $2,942 · $245/mo
- Expected delta
- $0/yr ($0/mo · 0.0%)
ⓘ Screening estimate from a state-policy table — verify with the county assessor before closing.
Climate risk First Street
- Flood 1/10 Low FEMA zone X (unshaded) · 0% chance over 30 yrs
- Wildfire 1/10 Low
- Heat 8/10 Severe 7 d/yr ≥108°F today · 22 d/yr by 30 yrs out
- Wind 8/10 Severe 80% chance of damaging wind over 30 yrs
- Air quality 2/10 Low 0 unhealthy d/yr today · 2 by 30 yrs out
Nearby sold comps map
Loading sold comps map…
Walkable amenities ~0.75 mi
Loading nearby amenities…
Taxation est. · year 1
- Rental income
- $17,278
- − Mortgage interest
- −$7,002
- − Property taxes
- −$2,942
- − Insurance
- −$625
- − Repairs & maintenance
- −$1,382
- − Management
- −$1,382
- − Depreciation
- −$3,636
- Taxable income
- $308
- Est. tax owed @ 24.0%
- −$74
- After-tax cash flow
- $2,143/yr
For passive investors: Depreciation is non-cash, so a rental often shows a tax loss while cash-flowing — sheltering income. Rental losses are passive: they offset passive income freely, and up to $25,000/yr can offset ordinary (W-2) income if you actively participate and your MAGI is under $100k (phasing out to $0 by $150k); unused losses carry forward. On sale, claimed depreciation is recaptured at up to 25%, and gains may owe capital-gains tax (a 1031 exchange can defer both). Figures are a year-1 estimate at your 24.0% rate — not tax advice; consult a CPA.
Schools (NCES district)
- District
- San Antonio ISD
- NCES district ID
- 4838730
- Math proficiency
- 12% ▼ -21.00%
- Reading proficiency
- 22% ▼ -7.00%
- Median HH income
- $30,952
- Composite
- 13.57/100
- National rank
- #9512
- State rank
- #805 of 826 in TX
Livability — San Antonio
- Score
- 80/100
- State rank
- #31
- US rank
- #1616
Category grades
Schools grade is shown separately in the Schools card above.
Census & demographics
- Census place
- San Antonio, TX
- County
- Bexar County · 1,990,555 people
- City population
- 1,806,925
- Metro
- San Antonio-New Braunfels, TX
- Population (ZIP)
- 10,224
- Household income
- $47,478
- Rent vs Own
- Severe rent burden
- 543.0
Population outlook (Bexar County) Hauer SSP2
- Today (2025)
- 2,336,851 people
- By 2030
- 2,560,728 · +9.6%
- By 2040
- 3,020,569 · +29.3%
- By 2050
- 3,493,522 · +49.5%
- By 2075
- 4,668,459 · +99.8%
- By 2100
- 5,533,242 · +136.8%
Race, ethnicity, and origin ACS 2023
- Neighborhood character
- Predominantly Hispanic (66%)
- Race & ethnicity
- Hispanic / Latino 66% Two or more races 28% White 17% Black 16% Native American 1%
- Hispanic origin (detail)
- Mexican 57% Puerto Rican 1% Cuban 1%
- Common ancestry
- Italian 2% Slovak 1%
- Foreign-born
- 14% · Canada
- Languages at home
- 59% English-only · Spanish 41%
Political lean MEDSL · Bexar
- 2024 margin
- Lean D (+9.8) · D 54.3% · R 44.6% · Other 1.1%
- 2008→2024 swing
- +4.2pp toward D · 2008: 5.6pp · 2024: 9.8pp
- All cycles
- 2024: D+9.8 2020: D+18.2 2016: D+13.5 2012: D+4.6 2008: D+5.6
Not yet ingested
- Civics
- —
Market trends
- HPI YoY
- ▲ 53.82%
- Current HPI
- 253.3196
- Rent YoY
- ▲ 8.20%
- Metro
- San Antonio-New Braunfels, TX
- State GDP YoY
- ▲ 3.95%
- F500 in state
- 110
Industry mix (Fortune 500 HQ in TX)
| Industry | F500 HQs | Revenue |
|---|---|---|
| Energy | 16 | $1,198B |
|
||
| Technology | 5 | $198B |
|
||
| Engineering / Construction | 4 | $72B |
|
||
| Energy Services | 3 | $60B |
|
||
| Utilities | 3 | $41B |
|
||
| Healthcare | 2 | $330B |
|
||
Price history
-18.2% since first listed4 events — show timeline
- 2026-05-07 Price Changed $135,000 LERA
- 2026-04-09 Price Changed $145,000 LERA
- 2026-03-04 Price Changed $155,000 LERA
- 2025-12-03 Listed $165,000 LERA
Property tax history
+8.5%/yrLatest (2025): $2,942 · +10.0% YoY. Source: county tax records.
Cash-flow waterfall
monthlySold comps — $/sqft
last 12 mo · ≤1 miLoading sold comps…