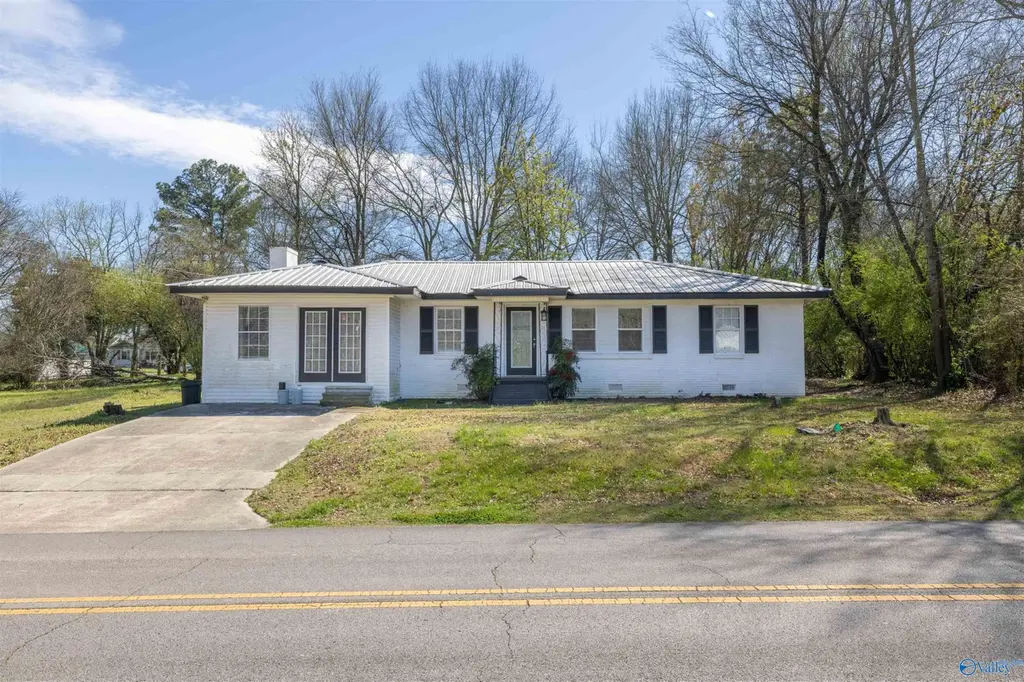
1406 Pike Ave · Phil Campbell, AL
Flood risk 1/10 · Minimal
- FEMA flood zone
- X (unshaded)
- Chance of flooding over 30 yrs
- 0.0%
- Est. flood insurance / yr
- $507 – $1,088
Fire risk 4/10 · Minor
- Est. fire insurance / yr
- $916 – $1,700
Heat risk 5/10 · Moderate
- Hot days now (above 105°F)
- 7 days/yr
- Hot days in 30 yrs
- 20 days/yr
Wind risk 5/10 · Moderate
- Chance of severe wind over 30 yrs
- 26.0%
Air-quality risk 2/10 · Minimal
- Unhealthy air days now
- 1 days/yr
- Unhealthy air days in 30 yrs
- 1 days/yr
Risk factors via First Street. Map © Google.
Why this score? — see what drove the C- grade
The composite is a weighted blend of 9 inputs, each scored 0–100. Each bar is that input's sub-score; the figure is the points it added to the 100-point composite (weight × sub-score).
- Cash flow +16.0/30.0
- ARV discount +14.6/15.0
- Appreciation +5.2/10.0
- DSCR +5.0/10.0
- 1% rule +3.1/10.0
- Livability +2.9/5.0
- Rent growth +2.5/5.0
- Condition / age +2.5/5.0
- Schools +2.2/10.0
$135,000
🖨 Deal sheet 📄 Offer letter ✓ Due diligence
Listing remarks
This 3 bedroom, 2 bath home is full of potential and ready for your personal touch! Sitting on approximately 0.6 of an acre, this property features a durable metal roof, spacious yard, and plenty of opportunity to make it your own. Whether you’re looking for an investment property, starter home, or your next project, this one offers endless possibilities. Home is being sold as is.
Key facts
- Spacious yard
- Metal roof
- Investment property
Tags
Property features AI
Finance
- Other: Directions listed as: 1406 Pike Ave Phil Campbell
- HOA & community: No homeowners association; Subdivision: Metes And Bounds
Exterior
- Parking: Concrete driveway
- Utilities: Public sewer
- Home design: Single-family residence; One level; Residential property; Not new construction
- Construction: 1,570 living area (square feet)
- Exterior features: 0.6-acre lot; Public water
Interior
- Bathrooms: 2 full bathrooms
- Heating & cooling: Natural gas heating; Wall furnace; Window cooling units (2+)
- Interior features: Crawl space; One fireplace
Neighborhood map
What this means for you Summary
Snapshot
- This is a 3-bed/1.0-bath single-family listed at $135k.
Deal economics
- At list price, monthly cash flow is $68 ($810/yr) — positive.
- The deal already cash-flows at list — no discount required.
- To meet the 1% rule (rent ≥ 1% of price), the offer needs to be $110k (18.7% below list).
- Recommended offer: $110k (18.7% below list) — sets the bar for 1% rule.
Location & tenants
- Location reads 58/100 on livability (#361 in AL) — a working-class tenant base; expect higher turnover. Strengths: cost of living A+, housing A+; Watch: crime F, amenities F, commute F.
- Franklin County (rural): math 17% / reading 36% proficiency, ranked #84 of 129 in AL (top 65%) — low school quality limits family demand, transient renter base, plan for 1-2y turnover.
- Zoned schools: Phil Campbell Elementary School (math 24% / reading 42%, grade F, #323 of 627 statewide, top 52%, 424 students, 72% FRL); Phil Campbell High School (math 6% / reading 27%, grade F, #209 of 305 statewide, top 69%, 448 students, 69% FRL) — zoned schools average 71% FRL vs 52% district-wide (19 pts higher); higher-poverty schools than district average — tighter screening recommended.
- Market conditions: 32 active listings in the ZIP; 15 units permitted in Franklin County in 2024 (0 in 5+ unit buildings).
Forward outlook
- In year one you build about $1k of equity ($933 loan paydown + $432 appreciation (0.3% local appreciation)).
- At projected returns (0.3% appreciation + 3.0% rent growth), your $38k cash investment doubles in ~10 years — after that, you're playing with house money.
Negotiation context
- It's been on market 39 days — a 3% lower offer ($131k) is reasonable based on typical stale-listing flexibility.
Risks & watch-outs
- Climate carrying-cost: moderate wind risk, 26% chance of damaging wind over 30y; extreme-heat days projected 7→20/yr by 2055 (HVAC capex compounding) — expect insurance premiums to compound above CPI over the hold.
Questions for the listing agent
- It's been on market 39 days. Have you received any prior offers? Is the seller open to a 19% concession, seller financing, or rate buy-down credit?
- Built in 1965 — when were the roof, HVAC, electrical panel, plumbing, and water heater last replaced?
- Is there a deadline driving the sale (1031 exchange, divorce, estate, relocation)? That informs how much negotiation room exists.
- Schools are F-rated, which usually means shorter tenancies and higher turnover. Who's the typical renter profile here, and what's been the actual vacancy rate?
- Crime grade is F in this area — have there been break-ins, vandalism, or insurance claims at this property in the last 3 years? What carrier currently insures it and at what premium?
- What's the average days-on-market for RENTAL listings here right now (not sales)? A rising rental-DOM trend means longer vacancies and softer asking-rent achievability than the comps imply.
- What's the recent tenant-quality profile in this submarket — average credit score on applications, eviction rate, late-payment / NSF rate, and stable-employment percentage? A property-management company in the area should have these aggregated.
- How much new for-sale + rental construction is in the pipeline within 1–3 miles? Heavy new supply typically softens prices + rents 12–24 months out; constrained supply supports both.
Investment metrics
- 1% rule
- 0.81% ✗
- Cap rate
- 6.89%
- Cash-on-cash
- 2.14%
- DSCR
- 1.10
- GRM
- 10.3
CMA / ARV
- ARV (median comp)
- $160,344
- List price
- $135,000
- Delta
- -15.81%
- Verdict
- UNDERPRICED
- Comps
- 20 within 1.0 mi
Show comp detail 6 sales within ~0.75 mi
| Address | Dist | Beds/Ba | Sqft | Sold | Price | $/sf | Match |
|---|---|---|---|---|---|---|---|
| 1440 Pike Ave | 0.03mi | 4/1.5 (+1) | 1,416 (-12%) | 2mo | $134,000 | $95 | 70 |
| 1185 Pike Ave | 0.22mi | 3/1.5 | 1,694 (+5%) | 11mo | $170,000 | $100 | 69 |
| 1247 Pike Ave | 0.16mi | 3/2.0 | 1,512 (-6%) | 15mo | $137,800 | $91 | 66 |
| 87 Jackson St | 0.42mi | 4/2.0 (+1) | 1,508 (-6%) | 2mo | $174,900 | $116 | 60 |
| 9 Steele St | 0.28mi | 3/2.0 | 1,710 (+6%) | 23mo | $169,900 | $99 | 54 |
| 3793 Broad St | 0.35mi | 4/2.0 (+1) | 1,849 (+15%) | 13mo | $260,000 | $141 | 39 |
Match score weights: distance 35% · size 25% · config 20% · recency 20%. Top-matched comps best support the ARV.
Projected returns pro-forma
0.32% appreciation · 3.0% rent growth · sell at horizon
- IRR
- 1.3%
- Equity multiple
- 1.06×
- Total profit
- $2,331
- Equity at exit
- $41,376
- IRR
- 6.4%
- Equity multiple
- 1.72×
- Total profit
- $27,353
- Equity at exit
- $51,507
Cash invested: $37,800 (down + closing). Projections, not guarantees.
Landlord ↔ Tenant lean methodology
- Overall (STATE)
- 90 Strongly Landlord-Friendly
- State Alabama
- 90 Strongly Landlord-Friendly · R+15
- County
- — inherits STATE
- City
- — inherits STATE
ZIP-level market 35581
- Home prices YoY
- 0.2%
- Active inventory
- 32
- Price-to-rent
- 10.3×
Monthly cashflow live
- Estimated rent
- $1,097 medium interval (Pro) →
- Mortgage (P&I)
- −$708
- Tax from tax record
- −$35 /mo · $421/yr
- Insurance
- −$56
- HOA
- −$0
- Vacancy / Maint / Mgmt
- −$230
- Net cashflow
- $68
Break-even live
UW: 25.0% down · 7.5% · 30yr · 1.5% tax · 5.0% vac · 8.0% maint · 8.0% mgmt
Financing live
Cash to close
- Down payment
- $33,750
- Closing costs
- $4,050
- Reserves months
- —
- Total cash needed
- —
Loan-product check · same deal, 3 products live
Conventional
25% down · 7.5% · 30yr
- Down + closing
- —
- Monthly P&I
- —
- Monthly cashflow
- —
- DSCR
- —
- Eligible?
- —
Personal DTI + credit; lowest rate.
DSCR
20% down · 8.5% · 30yr
- Down + closing
- —
- Monthly P&I
- —
- Monthly cashflow
- —
- DSCR
- —
- Eligible?
- —
No personal income docs; deal must DSCR.
Hard money
10% down · 12.0% · 12mo
- Down + closing
- —
- Monthly P&I
- —
- Monthly cashflow
- —
- DSCR
- —
- Eligible?
- —
Short-term bridge; refi at stabilization.
Listing history 21 events
-
2026-06-19days on market $135,000 Active 39 DOM
-
2026-06-18days on market $135,000 Active 38 DOM
-
2026-06-17days on market $135,000 Active 37 DOM
-
2026-06-16days on market $135,000 Active 36 DOM
-
2026-06-15days on market $135,000 Active 35 DOM
-
2026-06-14days on market $135,000 Active 33 DOM
-
2026-06-13days on market $135,000 Active 32 DOM
-
2026-06-10days on market $135,000 Active 30 DOM
-
2026-06-09days on market $135,000 Active 29 DOM
-
2026-06-08days on market $135,000 Active 28 DOM
-
2026-06-07days on market $135,000 Active 27 DOM
-
2026-06-05days on market $135,000 Active 24 DOM
-
2026-06-03days on market $135,000 Active 23 DOM
-
2026-06-02days on market $135,000 Active 22 DOM
-
2026-06-01days on market $135,000 Active 21 DOM
-
2026-05-31days on market $135,000 Active 20 DOM
-
2026-05-30days on market $135,000 Active 19 DOM
-
2026-05-11$135,000 Active 389-char remark
-
2025-12-30soldstatus $471,100
-
2020-07-27soldstatus $74,600
-
2017-02-23soldstatus $35,000
ⓘ Source: listings_history table (triggers on properties + properties_extension) + one-shot
backfill from property_details.listing_events for pre-trigger history.
Tax reassessment forecast AL · Resets to sale price
- Current annual tax
- $421 · $35/mo
- Projected year-2 tax
- $554 · $46/mo
- Expected delta
- +$132/yr (+$11/mo · 31.5%)
ⓘ Screening estimate from a state-policy table — verify with the county assessor before closing.
Climate risk First Street
- Flood 1/10 Low FEMA zone X (unshaded) · 0% chance over 30 yrs
- Wildfire 4/10 Moderate
- Heat 5/10 Major 7 d/yr ≥105°F today · 20 d/yr by 30 yrs out
- Wind 5/10 Major 26% chance of damaging wind over 30 yrs
- Air quality 2/10 Low 1 unhealthy d/yr today · 1 by 30 yrs out
Nearby sold comps map
Loading sold comps map…
Walkable amenities ~0.75 mi
Loading nearby amenities…
Taxation est. · year 1
- Rental income
- $13,167
- − Mortgage interest
- −$7,562
- − Property taxes
- −$421
- − Insurance
- −$675
- − Repairs & maintenance
- −$1,053
- − Management
- −$1,053
- − Depreciation
- −$3,927
- Taxable loss
- −$1,525
- Est. tax savings @ 24.0%
- +$366
- After-tax cash flow
- $1,176/yr
For passive investors: Depreciation is non-cash, so a rental often shows a tax loss while cash-flowing — sheltering income. Rental losses are passive: they offset passive income freely, and up to $25,000/yr can offset ordinary (W-2) income if you actively participate and your MAGI is under $100k (phasing out to $0 by $150k); unused losses carry forward. On sale, claimed depreciation is recaptured at up to 25%, and gains may owe capital-gains tax (a 1031 exchange can defer both). Figures are a year-1 estimate at your 24.0% rate — not tax advice; consult a CPA.
Schools (NCES district)
- District
- Franklin County
- NCES district ID
- 0101590
- Math proficiency
- 17% ▼ -21.00%
- Reading proficiency
- 36% ▼ -1.00%
- Median HH income
- $37,979
- Composite
- 22.08/100
- National rank
- #8187
- State rank
- #84 of 129 in AL
Livability — Phil Campbell
- Score
- 58/100
- State rank
- #361
- US rank
- #21096
Category grades
Schools grade is shown separately in the Schools card above.
Census & demographics
- Census place
- Phil Campbell, AL
- City population
- 6,271
- Population (ZIP)
- 6,271
Population outlook (Franklin County) Hauer SSP2
- Today (2025)
- 31,545 people
- By 2030
- 31,335 · -0.7%
- By 2040
- 30,983 · -1.8%
- By 2050
- 30,744 · -2.5%
- By 2075
- 30,173 · -4.3%
- By 2100
- 29,478 · -6.6%
Race, ethnicity, and origin ACS 2023
- Neighborhood character
- Predominantly White (87%)
- Race & ethnicity
- White 87% Hispanic / Latino 8% Two or more races 5% Native American 3%
- Hispanic origin (detail)
- Mexican 8%
- Common ancestry
- Italian 2% Lithuanian 2% Slovak 1%
- Foreign-born
- 3% · Canada
- Languages at home
- 95% English-only · Spanish 5%
Political lean MEDSL · Franklin
- 2024 margin
- Solid R (+73.3) · D 13.0% · R 86.2%
- 2008→2024 swing
- -34.1pp toward R · 2008: -39.2pp · 2024: -73.3pp
- All cycles
- 2024: R+73.3 2020: R+65.9 2016: R+60.8 2012: R+40.5 2008: R+39.2
Not yet ingested
- Civics
- —
Market trends
- HPI YoY
- ▲ 0.32%
- Current HPI
- 171.0186
- Rent YoY
- —
- Metro
- —
- State GDP YoY
- ▲ 2.94%
- F500 in state
- 4
Industry mix (Fortune 500 HQ in AL)
| Industry | F500 HQs | Revenue |
|---|---|---|
| Financial Services | 1 | $8B |
|
||
| Healthcare | 1 | $5B |
|
||
Price history
+285.7% since first listed4 events — show timeline
- 2026-05-11 Listed $135,000 VMLS
- 2025-12-30 Sold (Public Records) $471,100 Public Records
- 2020-07-27 Sold (Public Records) $74,600 Public Records
- 2017-02-23 Sold (Public Records) $35,000 Public Records
Property tax history
+65.5%/yrLatest (2025): $421 · +5.4% YoY. Source: county tax records.
Cash-flow waterfall
monthlySold comps — $/sqft
last 12 mo · ≤1 miLoading sold comps…