51578 Golden Eagle Dr · Indio, CA
Flood risk 1/10 · Minimal
- FEMA flood zone
- X (unshaded)
- Chance of flooding over 30 yrs
- 0.0%
- Est. flood insurance / yr
- $507 – $1,088
Fire risk 6/10 · Moderate
- Est. fire insurance / yr
- $659 – $1,223
Heat risk 10/10 · Severe
- Hot days now (above 115°F)
- 7 days/yr
- Hot days in 30 yrs
- 20 days/yr
Wind risk 1/10 · Minimal
- Chance of severe wind over 30 yrs
- —
Air-quality risk 3/10 · Minor
- Unhealthy air days now
- 3 days/yr
- Unhealthy air days in 30 yrs
- 5 days/yr
Risk factors via First Street. Map © Google.
Why this score? — see what drove the D+ grade
The composite is a weighted blend of 9 inputs, each scored 0–100. Each bar is that input's sub-score; the figure is the points it added to the 100-point composite (weight × sub-score).
- ARV discount +15.0/15.0
- Cash flow +13.6/30.0
- 1% rule +4.5/10.0
- DSCR +4.1/10.0
- Rent growth +3.3/5.0
- Livability +2.7/5.0
- Condition / age +2.5/5.0
- Schools +1.5/10.0
- Appreciation +0.0/10.0
$399,000
🖨 Deal sheet 📄 Offer letter ✓ Due diligence
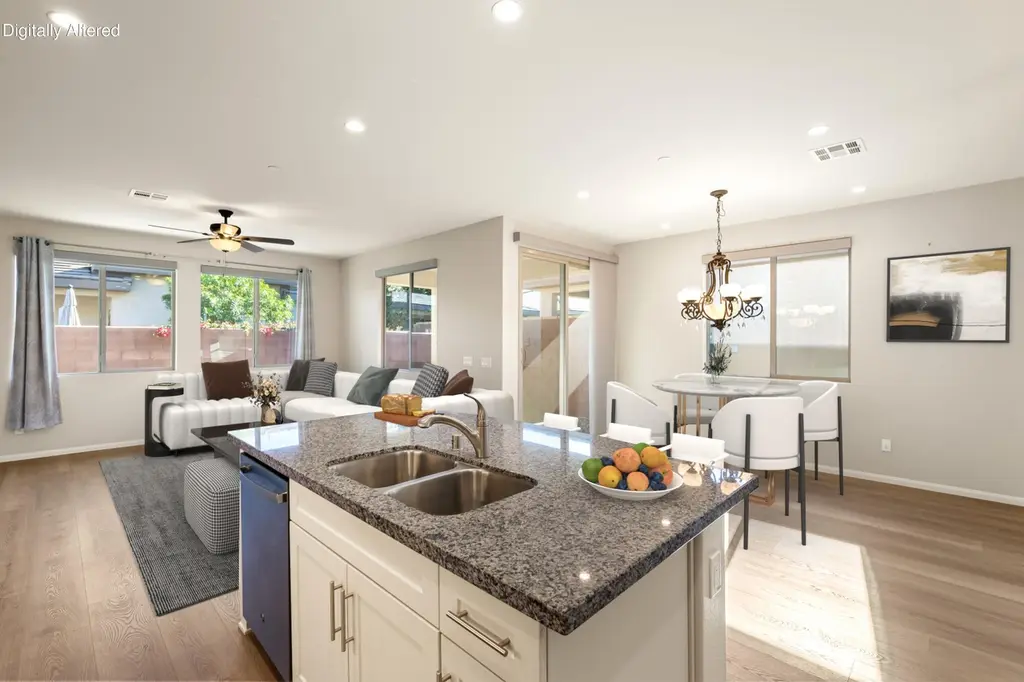
Listing remarks
Nestled behind the prestigious gates of Trilogy Polo Club, this elevated Muros Resort Collection residence blends modern luxury with effortless desert living, showcasing plank tile flooring, upgraded white soft-close cabinetry, custom interior doors, and designer touches throughout its open-concept layout. The entertainer's kitchen shines with stainless steel appliances, a 5-burner gas range, prep island with bar seating, granite slab surfaces, a Frigidaire refrigerator/freezer, custom subway tile backsplash, and a sleek single-basin sink. The spa-inspired primary suite features an oversized shower with bench seating, dual undermount sinks, and upgraded fixtures, while the open office area
Key facts
- 3,049 sq ft lot
- 2 garage spots
- Built 2021
Property features AI
Finance
- Other: CC&R and homeowners association disclosures available; Short-term rentals not allowed; Will not consider lease
- Financial info: Rental restrictions apply
- HOA & community: Monthly association fee of $245; Association covers clubhouse, security, concierge; Community amenities include clubhouse, fitness center, banquet facilities, billiard room, card room, meeting room, guest parking, tennis courts, sport court, elevators, pickleball courts, community mailbox; Senior community
Exterior
- Parking: Attached garage; 2 garage spaces (side-by-side); Garage door opener; Direct garage entrance
- Security: 24-hour security; Gated community
- Utilities: Water: Indio Water Authority (water district); Sewer: connected and paid; PUD: Yes
- Home design: Single family residence; One story; Attached property; Built by Shea Homes
- Construction: Stucco exterior; Tile roof; Slab foundation; Year built (per assessor)
- Exterior features: Covered patio with rock/stone finish; Block fencing; Sprinkler system; Close to clubhouse; Underground utilities; 24-hour security; Gated community
Interior
- Kitchen: Island; Granite slab counters; Dishwasher; Gas range; Microwave; Exhaust fan; Water line to refrigerator; Garbage disposal
- Bedrooms: Master retreat; Walk-in closet
- Flooring: Carpet; Tile
- Bathrooms: 2 full bathrooms; Double vanities; Shower stall; Shower over tub
- Heating & cooling: Central heating (natural gas); Central air conditioning
- Interior features: High ceilings (9 ft+); Recessed lighting; Sliding doors; Unfurnished
- Laundry & utility: Gas availability
Neighborhood map
What this means for you Summary
Snapshot
- This is a 2-bed/2.0-bath single-family listed at $399k.
Deal economics
- At list price, monthly cash flow is $25 ($296/yr) — positive.
- The deal already cash-flows at list — no discount required.
- To meet the 1% rule (rent ≥ 1% of price), the offer needs to be $380k (4.7% below list).
- Recommended offer: $380k (4.7% below list) — sets the bar for 1% rule.
- Cap rate 6.4% vs local median 4.3% in Indio — top-decile yield for the area; either an underpriced asset or a hidden risk that comps aren't pricing in. Stress-test before assuming the spread holds.
Location & tenants
- Location reads 53/100 on livability (#927 in CA) — a working-class tenant base; expect higher turnover. Strengths: housing B+; Watch: employment D, schools F, crime F.
- Coachella Valley Unified (rural): math 12% / reading 23% proficiency, ranked #481 of 517 in CA (top 93%) — low school quality limits family demand, transient renter base, plan for 1-2y turnover; 79% free/reduced lunch — lower-income household profile, screen leases tightly.
- Market conditions: Rents rising (+3.3%/yr); 514 active listings in the ZIP; 33 comparable units currently listed for rent nearby; rentals lingering (median 44d on market — plan ~5-8 weeks vacancy on turnover, expect pricing pressure); 76% of comp listings sitting > 30 days — soft ceiling on asking rent; 9,195 units permitted in Riverside County in 2024 (1,512 in 5+ unit buildings).
- At $3,801/mo this rent would consume 68% of the median local household income ($67k/yr) (locally 2036% of renters already pay >50% of income on rent) — very limited rent-growth headroom before tenants either downsize or default.
Forward outlook
- Local home prices are declining (-3.0%/yr); year-one equity from $3k of loan paydown is wiped out by about $12k of value loss. Plan a longer hold.
- Riverside County population projected at +22% by 2050 — long-run rental-demand tailwind backs the buy-and-hold thesis.
Negotiation context
- It's been on market 43 days — a 3% lower offer ($387k) is reasonable based on typical stale-listing flexibility.
- 8 sale attempts since 2y ago with the ask held roughly flat each time — persistent listings suggest the price (not the market) is what's stuck; bring a comps-based counter.
Risks & watch-outs
- Climate carrying-cost: major wildfire risk; extreme-heat days projected 7→20/yr by 2055 (HVAC capex compounding) — expect insurance premiums to compound above CPI over the hold.
Questions for the listing agent
- It's been on market 43 days. Have you received any prior offers? Is the seller open to a 5% concession, seller financing, or rate buy-down credit?
- What does the HOA fee cover, when was the last increase, and are there any pending special assessments or reserve-fund shortfalls?
- Is there a deadline driving the sale (1031 exchange, divorce, estate, relocation)? That informs how much negotiation room exists.
- Schools are F-rated, which usually means shorter tenancies and higher turnover. Who's the typical renter profile here, and what's been the actual vacancy rate?
- Crime grade is F in this area — have there been break-ins, vandalism, or insurance claims at this property in the last 3 years? What carrier currently insures it and at what premium?
- The area grade is low — what's the realistic commute time and amenity access for the typical tenant pool here? Any planned neighborhood developments (good or bad) we should know about?
- What's the average days-on-market for RENTAL listings here right now (not sales)? A rising rental-DOM trend means longer vacancies and softer asking-rent achievability than the comps imply.
- What's the recent tenant-quality profile in this submarket — average credit score on applications, eviction rate, late-payment / NSF rate, and stable-employment percentage? A property-management company in the area should have these aggregated.
- How much new for-sale + rental construction is in the pipeline within 1–3 miles? Heavy new supply typically softens prices + rents 12–24 months out; constrained supply supports both.
Investment metrics
- 1% rule
- 0.95% ✗
- Cap rate
- 6.37%
- Cash-on-cash
- 0.26%
- DSCR
- 1.01
- GRM
- 8.7
CMA / ARV
- ARV (median comp)
- $498,160
- List price
- $399,000
- Delta
- -19.91%
- Verdict
- UNDERPRICED
- Comps
- 20 within 1.0 mi
Show comp detail 12 sales within ~0.75 mi
| Address | Dist | Beds/Ba | Sqft | Sold | Price | $/sf | Match |
|---|---|---|---|---|---|---|---|
| 51725 Ponderosa Dr | 0.06mi | 2/2.0 | 1,342 (0%) | 2mo | $475,000 | $354 | 96 |
| 51655 Ponderosa Dr | 0.03mi | 2/2.0 | 1,342 (0%) | 4mo | $425,000 | $317 | 96 |
| 51621 Golden Eagle Dr | 0.05mi | 2/2.0 | 1,342 (0%) | 5mo | $400,000 | $298 | 93 |
| 51675 Ponderosa Dr | 0.05mi | 2/2.0 | 1,342 (0%) | 6mo | $410,000 | $306 | 93 |
| 51585 Ponderosa Dr | 0.04mi | 2/2.0 | 1,342 (0%) | 11mo | $420,000 | $313 | 89 |
| 51700 Golden Eagle Dr | 0.08mi | 2/2.0 | 1,294 (-4%) | 4mo | $380,000 | $294 | 87 |
| 51570 Ponderosa Dr | 0.06mi | 2/2.0 | 1,294 (-4%) | 13mo | $479,900 | $371 | 80 |
| 51735 Ponderosa Dr | 0.08mi | 2/2.0 | 1,294 (-4%) | 15mo | $515,000 | $398 | 78 |
| 51721 Golden Eagle Dr | 0.12mi | 2/2.0 | 1,294 (-4%) | 15mo | $470,000 | $363 | 76 |
| 51389 Longmeadow St | 0.15mi | 2/2.0 | 1,437 (+7%) | 11mo | $500,000 | $348 | 72 |
| 51600 Rainwater Ct | 0.18mi | 2/2.0 | 1,448 (+8%) | 16mo | $610,000 | $421 | 65 |
| 50380 Timber Creek Way | 0.60mi | 2/2.0 | 1,448 (+8%) | 2mo | $500,000 | $345 | 57 |
Match score weights: distance 35% · size 25% · config 20% · recency 20%. Top-matched comps best support the ARV.
Projected returns pro-forma
-3.0% appreciation · 3.34% rent growth · sell at horizon
- IRR
- -15.4%
- Equity multiple
- 0.45×
- Total profit
- $-61,589
- Equity at exit
- $59,492
- IRR
- -6.2%
- Equity multiple
- 0.59×
- Total profit
- $-45,435
- Equity at exit
- $34,498
Cash invested: $111,720 (down + closing). Projections, not guarantees.
Landlord ↔ Tenant lean methodology
- Overall (STATE)
- 18 Strongly Tenant-Friendly
- State California
- 18 Strongly Tenant-Friendly · D+13
- County
- — inherits STATE
- City
- — inherits STATE
ZIP-level market 92201
- Home prices YoY
- -28.4%
- Rents YoY
- 3.3%
- Active inventory
- 514
- Price-to-rent
- 8.7×
Monthly cashflow live
- Estimated rent
- $3,801 high interval (Pro) →
- Mortgage (P&I)
- −$2,092
- Tax from tax record
- −$475 /mo · $5,696/yr
- Insurance
- −$166
- HOA
- −$245
- Vacancy / Maint / Mgmt
- −$798
- Net cashflow
- $25
Break-even live
UW: 25.0% down · 7.5% · 30yr · 1.5% tax · 5.0% vac · 8.0% maint · 8.0% mgmt
Financing live
Cash to close
- Down payment
- $99,750
- Closing costs
- $11,970
- Reserves months
- —
- Total cash needed
- —
Loan-product check · same deal, 3 products live
Conventional
25% down · 7.5% · 30yr
- Down + closing
- —
- Monthly P&I
- —
- Monthly cashflow
- —
- DSCR
- —
- Eligible?
- —
Personal DTI + credit; lowest rate.
DSCR
20% down · 8.5% · 30yr
- Down + closing
- —
- Monthly P&I
- —
- Monthly cashflow
- —
- DSCR
- —
- Eligible?
- —
No personal income docs; deal must DSCR.
Hard money
10% down · 12.0% · 12mo
- Down + closing
- —
- Monthly P&I
- —
- Monthly cashflow
- —
- DSCR
- —
- Eligible?
- —
Short-term bridge; refi at stabilization.
Rent comps 33 comps
| Address | Beds | Baths | Sqft | Rent | $/sqft | DOM | Units | Dist |
|---|---|---|---|---|---|---|---|---|
| 51520 Golden Eagle Dr Indio, CA | 2.0 | 2.0 | 1294 | $3,995 | $3.09 | 44d | 1 | 0.03mi |
| 82803 Spirit Mountain Dr Indio, CA | 2.0 | 2.0 | 1437 | $5,000 | $3.48 | 44d | 1 | 0.06mi |
| 51710 Ponderosa Dr Indio, CA | 2.0 | 2.0 | 1294 | $5,500 | $4.25 | 24d | 1 | 0.07mi |
| 51811 Golden Eagle Dr Chiriaco Summit, CA | 2.0 | 2.0 | 1294 | $2,850 | $2.20 | 44d | 1 | 0.17mi |
| 82820 Kingsboro Ln Indio, CA | 2.0 | 2.0 | 1399 | $4,800 | $3.43 | 44d | 1 | 0.24mi |
| 50880 Monterey Canyon Dr Indio, CA | 3.0 | 2.0 | 1847 | $3,200 | $1.73 | 44d | 1 | 0.36mi |
| 50715 Monterey Canyon Dr Indio, CA | 2.0 | 2.0 | 1622 | $5,600 | $3.45 | 44d | 1 | 0.43mi |
| 51805 Pinnacle Vista Dr Indio, CA | 3.0 | 2.0 | 1622 | $3,000 | $1.85 | 44d | 1 | 0.53mi |
| 51805 Pinnacle Vista Dr Indio, CA | 3.0 | 2.0 | 1622 | $3,000 | $1.85 | 5d | 1 | 0.53mi |
| 82900 Temescal Canyon Dr Indio, CA | 2.0 | 2.0 | 1622 | $3,800 | $2.34 | 44d | 1 | 0.66mi |
| 51580 Whiptail Dr Indio, CA | 2.0 | 2.5 | 1678 | $3,300 | $1.97 | 44d | 1 | 0.77mi |
| 51660 Whiptail Dr Indio, CA | 2.0 | 2.0 | 1678 | $3,200 | $1.91 | 22d | 1 | 0.78mi |
| 51670 Whiptail Dr Indio, CA | 2.0 | 2.0 | 1542 | $3,000 | $1.95 | 18d | 1 | 0.78mi |
| 49549 Lewis Rd Indio, CA | 2.0 | 2.0 | 1853 | $4,200 | $2.27 | 44d | 1 | 1.03mi |
| 82223 Travolta Ave Indio, CA | 3.0 | 2.0 | 1808 | $5,000 | $2.77 | 44d | 1 | 1.23mi |
| 82633 Odlum Dr Indio, CA | 2.0 | 2.0 | 1833 | $3,200 | $1.75 | 44d | 1 | 1.24mi |
| 49142 Barrymore St Indio, CA | 2.0 | 2.5 | 1773 | $2,775 | $1.57 | 12d | 1 | 1.25mi |
| 82297 Cochran Dr Indio, CA | 2.0 | 2.0 | 982 | $3,200 | $3.26 | 44d | 1 | 1.25mi |
| 82154 Travolta Ave Indio, CA | 2.0 | 3.0 | 1619 | $3,000 | $1.85 | 44d | 1 | 1.28mi |
| 49058 Wayne St Indio, CA | 2.0 | 2.0 | 1156 | $4,000 | $3.46 | 5d | 1 | 1.29mi |
| 49058 Wayne St Indio, CA | 2.0 | 2.0 | 1156 | $4,000 | $3.46 | 44d | 1 | 1.29mi |
| 49225 Eisenhower Dr Indio, CA | 2.0 | 2.0 | 1168 | $2,800 | $2.40 | 44d | 1 | 1.35mi |
| 49181 Eisenhower Dr Indio, CA | 3.0 | 2.0 | 1368 | $4,250 | $3.11 | 44d | 1 | 1.37mi |
| 48957 Heifitz Dr Indio, CA | 3.0 | 2.0 | 1833 | $4,600 | $2.51 | 44d | 1 | 1.37mi |
| 82013 Cochran Dr Indio, CA | 3.0 | 2.0 | 1796 | $3,300 | $1.84 | 44d | 1 | 1.37mi |
| 82294 Bergman Dr Indio, CA | 2.0 | 2.0 | 982 | $3,200 | $3.26 | 44d | 1 | 1.40mi |
| 82186 Bergman Dr Indio, CA | 2.0 | 2.0 | 1140 | $2,500 | $2.19 | 44d | 1 | 1.43mi |
| 48842 Biery St Indio, CA | 3.0 | 2.0 | 1833 | $3,200 | $1.75 | 44d | 1 | 1.44mi |
| 49153 Garland Rd Indio, CA | 3.0 | 2.0 | 1655 | $2,850 | $1.72 | 17d | 1 | 1.45mi |
| 48638 Hepburn Dr Indio, CA | 3.0 | 2.0 | 1732 | $5,800 | $3.35 | 44d | 1 | 1.46mi |
| 82191 Ullman Rd Indio, CA | 2.0 | 2.0 | 1446 | $2,250 | $1.56 | 18d | 1 | 1.46mi |
| 49133 Garland Rd Indio, CA | 3.0 | 2.0 | 1776 | $2,950 | $1.66 | 44d | 1 | 1.46mi |
| 49120 Cochran Dr Indio, CA | 3.0 | 2.0 | 1655 | $2,850 | $1.72 | 44d | 1 | 1.47mi |
HOA detail
- Monthly dues
- $245 · $2,940/yr
- Likely covers
- gas
Listing history 32 events
-
2026-06-18days on market $399,000 Active 43 DOM
-
2026-06-17days on market $399,000 Active 42 DOM
-
2026-06-16days on market $399,000 Active 41 DOM
-
2026-06-15days on market $399,000 Active 40 DOM
-
2026-06-13days on market $399,000 Active 38 DOM
-
2026-06-13days on market $399,000 Active 37 DOM
-
2026-06-09days on market $399,000 Active 34 DOM
-
2026-06-08days on market $399,000 Active 33 DOM
-
2026-06-07days on market $399,000 Active 32 DOM
-
2026-06-04days on market $399,000 Active 29 DOM
-
2026-06-03days on market $399,000 Active 28 DOM
-
2026-06-02days on market $399,000 Active 27 DOM
-
2026-06-01days on market $399,000 Active 26 DOM
-
2026-05-31days on market $399,000 Active 25 DOM
-
2026-05-06historical
-
2026-05-06$399,000 Active 1271-char remark
-
2026-02-08$399,000 Active
-
2026-02-01historical
-
2025-09-13$419,500 Active
-
2025-09-01historical
-
2025-07-13price $419,500
-
2025-06-30status Active
-
2025-06-18historical Active Under Contract
-
2025-05-25price $429,500
-
2025-04-13$449,500 Active
-
2025-04-01historical
-
2025-02-15price $484,900
-
2025-01-02$499,000 Active
-
2025-01-01historical
-
2024-10-01historical
-
2024-05-24$514,900 Active
-
2024-05-24$525,000 Active
ⓘ Source: listings_history table (triggers on properties + properties_extension) + one-shot
backfill from property_details.listing_events for pre-trigger history.
Tax reassessment forecast CA · Resets to sale price
- Current annual tax
- $5,696 · $475/mo
- Projected year-2 tax
- $5,696 · $475/mo
- Expected delta
- $0/yr ($0/mo · 0.0%)
ⓘ Screening estimate from a state-policy table — verify with the county assessor before closing.
Climate risk First Street
- Flood 1/10 Low FEMA zone X (unshaded) · 0% chance over 30 yrs
- Wildfire 6/10 Major
- Heat 10/10 Extreme 7 d/yr ≥115°F today · 20 d/yr by 30 yrs out
- Wind 1/10 Low
- Air quality 3/10 Moderate 3 unhealthy d/yr today · 5 by 30 yrs out
Nearby sold comps map
Loading sold comps map…
Walkable amenities ~0.75 mi
Loading nearby amenities…
Taxation est. · year 1
- Rental income
- $45,614
- − Mortgage interest
- −$22,350
- − Property taxes
- −$5,696
- − Insurance
- −$1,995
- − Repairs & maintenance
- −$3,649
- − Management
- −$3,649
- − HOA
- −$2,940
- − Depreciation
- −$11,607
- Taxable loss
- −$6,272
- Est. tax savings @ 24.0%
- +$1,505
- After-tax cash flow
- $1,801/yr
For passive investors: Depreciation is non-cash, so a rental often shows a tax loss while cash-flowing — sheltering income. Rental losses are passive: they offset passive income freely, and up to $25,000/yr can offset ordinary (W-2) income if you actively participate and your MAGI is under $100k (phasing out to $0 by $150k); unused losses carry forward. On sale, claimed depreciation is recaptured at up to 25%, and gains may owe capital-gains tax (a 1031 exchange can defer both). Figures are a year-1 estimate at your 24.0% rate — not tax advice; consult a CPA.
Schools (NCES district)
- District
- Coachella Valley Unified
- NCES district ID
- 0609070
- Math proficiency
- 12% ▼ -8.00%
- Reading proficiency
- 23% ▼ -6.00%
- Median HH income
- $37,683
- Composite
- 14.62/100
- National rank
- #9408
- State rank
- #481 of 517 in CA
Livability — Indio
- Score
- 53/100
- State rank
- #927
- US rank
- #24244
Category grades
Schools grade is shown separately in the Schools card above.
Census & demographics
- Census place
- Indio, CA
- County
- Riverside County · 2,287,001 people
- City population
- 100,560
- Metro
- Riverside-San Bernardino-Ontario, CA
- Population (ZIP)
- 65,825
- Household income
- $66,758
- Rent vs Own
- Severe rent burden
- 2036.0
Population outlook (Riverside County) Hauer SSP2
- Today (2025)
- 2,664,475 people
- By 2030
- 2,802,692 · +5.2%
- By 2040
- 3,050,904 · +14.5%
- By 2050
- 3,256,783 · +22.2%
- By 2075
- 3,655,058 · +37.2%
- By 2100
- 3,766,594 · +41.4%
Race, ethnicity, and origin ACS 2023
- Neighborhood character
- Predominantly Hispanic (74%)
- Race & ethnicity
- Hispanic / Latino 74% Two or more races 39% White 19% Black 3% Asian 3% Native American 1%
- Hispanic origin (detail)
- Mexican 69%
- Common ancestry
- Romanian 1% Iranian 1%
- Foreign-born
- 29% · Canada, Vietnam, Jamaica
- Languages at home
- 41% English-only · Spanish 55% Arabic 1% Tagalog/Filipino 1%
Political lean MEDSL · Riverside
- 2024 margin
- Toss-up / Even · D 48.0% · R 49.3% · Other 2.6%
- 2008→2024 swing
- -3.6pp toward R · 2008: 2.3pp · 2024: -1.3pp
- All cycles
- 2024: R+1.3 2020: D+8.0 2016: D+4.3 2012: R+0.4 2008: D+2.3
Not yet ingested
- Civics
- —
Market trends
- HPI YoY
- ▼ -138.46%
- Current HPI
- 348.6605
- Rent YoY
- ▲ 3.34%
- Metro
- Riverside-San Bernardino-Ontario, CA
- State GDP YoY
- ▲ 3.21%
- F500 in state
- 116
Industry mix (Fortune 500 HQ in CA)
| Industry | F500 HQs | Revenue |
|---|---|---|
| Technology | 27 | $1,492B |
|
||
| Financial Services | 3 | $174B |
|
||
| Retail | 3 | $44B |
|
||
| Insurance | 3 | $26B |
|
||
| Media / Entertainment | 2 | $115B |
|
||
| Pharmaceuticals / Biotech | 2 | $62B |
|
||
Price history
-22.5% since first listed18 events — show timeline
- 2026-05-06 Listing Removed — GPSMLS
- 2026-05-06 Listed $399,000 GPSMLS
- 2026-02-08 Listed $399,000 GPSMLS
- 2026-02-01 Listing Removed — GPSMLS
- 2025-09-13 Listed $419,500 GPSMLS
- 2025-09-01 Listing Removed — GPSMLS
- 2025-07-13 Price Changed $419,500 GPSMLS
- 2025-06-30 Relisted — GPSMLS
- 2025-06-18 Contingent — GPSMLS
- 2025-05-25 Price Changed $429,500 GPSMLS
- 2025-04-13 Listed $449,500 GPSMLS
- 2025-04-01 Listing Removed — GPSMLS
- 2025-02-15 Price Changed $484,900 GPSMLS
- 2025-01-02 Listed $499,000 GPSMLS
- 2025-01-01 Listing Removed — GPSMLS
- 2024-10-01 Listing Removed — GPSMLS
- 2024-05-24 Listed $525,000 GPSMLS
- 2024-05-24 Listed $514,900 GPSMLS
Property tax history
+75.4%/yrLatest (2025): $5,696 · +2.3% YoY. Source: county tax records.
Cash-flow waterfall
monthlySold comps — $/sqft
last 12 mo · ≤1 miLoading sold comps…