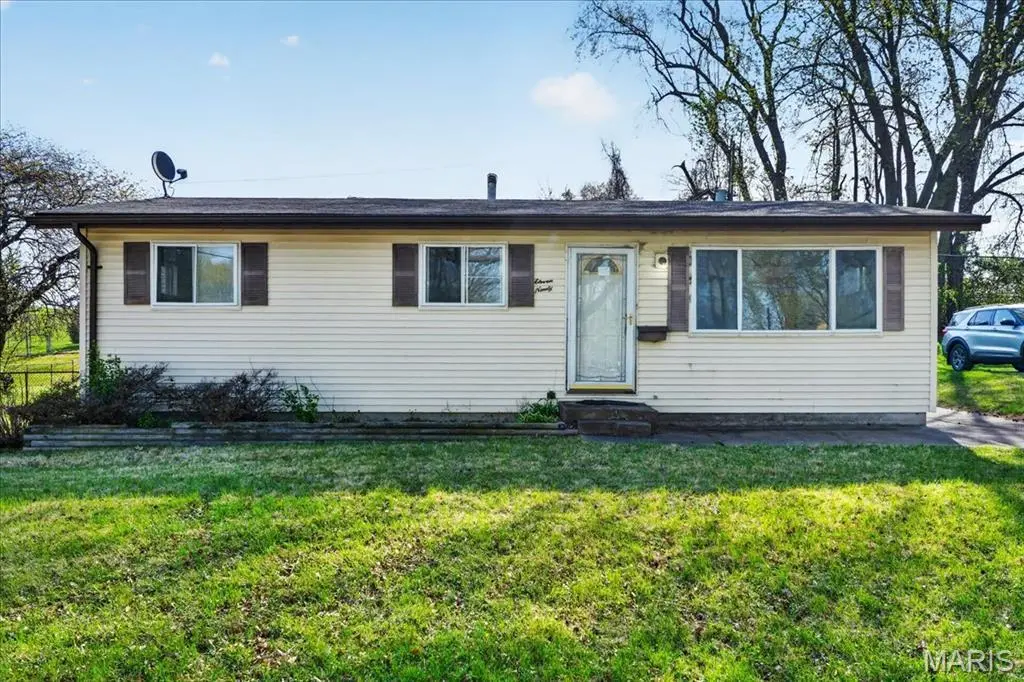
None · Florissant, MO
Flood risk 1/10 · Minimal
- FEMA flood zone
- X (unshaded)
- Chance of flooding over 30 yrs
- 0.0%
- Est. flood insurance / yr
- $473 – $860
Fire risk 1/10 · Minimal
- Est. fire insurance / yr
- $1,054 – $1,958
Heat risk 4/10 · Minor
- Hot days now (above 106°F)
- 7 days/yr
- Hot days in 30 yrs
- 20 days/yr
Wind risk 2/10 · Minimal
- Chance of severe wind over 30 yrs
- 1.0%
Air-quality risk 3/10 · Minor
- Unhealthy air days now
- 3 days/yr
- Unhealthy air days in 30 yrs
- 5 days/yr
Risk factors via First Street. Map © Google.
Why this score? — see what drove the A- grade
The composite is a weighted blend of 9 inputs, each scored 0–100. Each bar is that input's sub-score; the figure is the points it added to the 100-point composite (weight × sub-score).
- Cash flow +27.9/30.0
- ARV discount +15.0/15.0
- Appreciation +10.0/10.0
- DSCR +9.9/10.0
- 1% rule +7.3/10.0
- Rent growth +4.4/5.0
- Livability +3.7/5.0
- Condition / age +2.5/5.0
- Schools +1.2/10.0
$124,900
🖨 Deal sheet 📄 Offer letter ✓ Due diligence
Listing remarks MLS
Property to be sold AS-IS. Seller to do no repairs or inspections including governmental inspections. Here is your chance to own a darling fixer upper in the heart of Florissant. This 3 bed 1 bath beauty is waiting for it's new owner. There is a newer furnace and ac unit along with pvc plumbing some of big ticket items are already taken care of. The windows are older and electrical panel needs to be updated. Not sure what the age of the roof is but nothing is leaking and appears to be in good working order. There are beautiful hardwood floors throughout. It even comes with free pink tile in the bathroom! This would make a great fix and flip or cash flowing investment property for the savvy investor. Schedule a showing today as this one probably won't last long. Refer to ShowingTime for showing instructions.
Key facts
- 9,583 sq ft lot
- Built 1957
- Listed 69 days
Neighborhood map
What this means for you Summary
Snapshot
- This is a 3-bed/1.0-bath single-family listed at $125k.
Deal economics
- At list price, monthly cash flow is $383 ($5k/yr) — positive.
- The deal already cash-flows at list — no discount required.
- Meets the 1% rule at list price ($2k rent vs $125k).
- Recommended offer: $117k (6.0% below list) — sets the bar for market timing.
- Cap rate 10.0% vs local median 6.3% in Florissant — top-decile yield for the area; either an underpriced asset or a hidden risk that comps aren't pricing in. Stress-test before assuming the spread holds.
Location & tenants
- Location reads 73/100 on livability (#82 in MO) — a middle-class / working-renter tenant base. Strengths: cost of living A+, housing A+, health & safety B+; Watch: crime C-, amenities D+, schools D.
- Ferguson-Florissant R-II (suburban): math 7% / reading 20% proficiency, ranked #311 of 324 in MO (top 96%) — low school quality limits family demand, transient renter base, plan for 1-2y turnover; 70% free/reduced lunch — lower-income household profile, screen leases tightly.
- Market conditions: Rents rising fast (+7.5%/yr); 218 active listings in the ZIP; 24 comparable units currently listed for rent nearby; rentals at typical pace (median 24d on market — plan ~3-4 weeks tenant-placement turnaround); 920 units permitted in St. Louis County in 2024 (250 in 5+ unit buildings).
Forward outlook
- In year one you build about $13k of equity ($864 loan paydown + $12k appreciation (10.0% local appreciation)).
- At projected returns (10.0% appreciation + 7.5% rent growth), your $35k cash investment doubles in ~2 years — after that, you're playing with house money.
- By year 3, paydown + projected appreciation supports a ~$34k cash-out refi (75% LTV) — recoverable capital for the next deal without selling this one.
Negotiation context
- It's been on market 69 days — a 6% lower offer ($117k) is reasonable based on typical stale-listing flexibility.
Risks & watch-outs
- Watch-outs: built in 1957 — expect roof / HVAC / electrical / plumbing capex.
Questions for the listing agent
- It's been on market 69 days. Have you received any prior offers? Is the seller open to a 6% concession, seller financing, or rate buy-down credit?
- Built in 1957 — when were the roof, HVAC, electrical panel, plumbing, and water heater last replaced?
- Why hasn't it sold? Are there any deal-killer items the seller is aware of (foundation, flood, title, zoning, code violations)?
- Is there a deadline driving the sale (1031 exchange, divorce, estate, relocation)? That informs how much negotiation room exists.
- Schools are D-rated, which usually means shorter tenancies and higher turnover. Who's the typical renter profile here, and what's been the actual vacancy rate?
- What's the average days-on-market for RENTAL listings here right now (not sales)? A rising rental-DOM trend means longer vacancies and softer asking-rent achievability than the comps imply.
- What's the recent tenant-quality profile in this submarket — average credit score on applications, eviction rate, late-payment / NSF rate, and stable-employment percentage? A property-management company in the area should have these aggregated.
- How much new for-sale + rental construction is in the pipeline within 1–3 miles? Heavy new supply typically softens prices + rents 12–24 months out; constrained supply supports both.
Investment metrics
- 1% rule
- 1.23% ✓
- Cap rate
- 9.97%
- Cash-on-cash
- 13.15%
- DSCR
- 1.59
- GRM
- 6.8
CMA / ARV
- ARV (median comp)
- $151,825
- List price
- $124,900
- Delta
- -17.73%
- Verdict
- UNDERPRICED
- Comps
- 20 within 1.0 mi
Show comp detail 12 sales within ~0.75 mi
| Address | Dist | Beds/Ba | Sqft | Sold | Price | $/sf | Match |
|---|---|---|---|---|---|---|---|
| 1125 Apache Dr | 0.41mi | 3/1.0 | 957 (-0%) | 1mo | $100,000 | $104 | 80 |
| 1145 S Waterford Dr | 0.23mi | 3/2.0 | 984 (+2%) | 4mo | $165,000 | $168 | 78 |
| 1050 Ozment Dr | 0.18mi | 3/2.0 | 984 (+2%) | 10mo | $139,000 | $141 | 75 |
| 2 Carson Ct | 0.32mi | 3/1.0 | 888 (-8%) | 8mo | $165,000 | $186 | 66 |
| 5 Carson Ct | 0.33mi | 3/1.0 | 888 (-8%) | 10mo | $163,000 | $184 | 64 |
| 1065 Cheyenne Dr | 0.54mi | 3/2.0 | 1,040 (+8%) | 3mo | $172,000 | $165 | 54 |
| 190 Lynn Meadows Ln | 0.66mi | 3/1.0 | 864 (-10%) | 0mo | $119,900 | $139 | 52 |
| 895 Rogers Ln | 0.51mi | 3/2.0 | 888 (-8%) | 10mo | $149,375 | $168 | 52 |
| 16 Montclair Ct | 0.56mi | 3/2.0 | 864 (-10%) | 4mo | $100,000 | $116 | 50 |
| 105 Capri Dr | 0.62mi | 3/1.0 | 864 (-10%) | 7mo | $144,900 | $168 | 49 |
| 17 Montclair Ct | 0.58mi | 3/1.0 | 864 (-10%) | 10mo | $159,900 | $185 | 48 |
| 205 Lynn Meadows Ln | 0.69mi | 3/1.0 | 1,104 (+15%) | 1mo | $135,000 | $122 | 42 |
Match score weights: distance 35% · size 25% · config 20% · recency 20%. Top-matched comps best support the ARV.
Projected returns pro-forma
10.0% appreciation · 7.51% rent growth · sell at horizon
- IRR
- 36.1%
- Equity multiple
- 3.85×
- Total profit
- $99,745
- Equity at exit
- $112,520
- IRR
- 32.7%
- Equity multiple
- 9.36×
- Total profit
- $292,316
- Equity at exit
- $242,653
Cash invested: $34,972 (down + closing). Projections, not guarantees.
Landlord ↔ Tenant lean methodology
- Overall (STATE)
- 81 Strongly Landlord-Friendly
- State Missouri
- 81 Strongly Landlord-Friendly · R+10
- County
- — inherits STATE
- City
- — inherits STATE
ZIP-level market 63033
- Home prices YoY
- 2.5%
- Rents YoY
- 7.5%
- Active inventory
- 218
- Price-to-rent
- 6.8×
Monthly cashflow live
- Estimated rent
- $1,541 high interval (Pro) →
- Mortgage (P&I)
- −$655
- Tax from tax record
- −$127 /mo · $1,524/yr
- Insurance
- −$52
- HOA
- −$0
- Vacancy / Maint / Mgmt
- −$324
- Net cashflow
- $383
Break-even live
UW: 25.0% down · 7.5% · 30yr · 1.5% tax · 5.0% vac · 8.0% maint · 8.0% mgmt
Financing live
Cash to close
- Down payment
- $31,225
- Closing costs
- $3,747
- Reserves months
- —
- Total cash needed
- —
Loan-product check · same deal, 3 products live
Conventional
25% down · 7.5% · 30yr
- Down + closing
- —
- Monthly P&I
- —
- Monthly cashflow
- —
- DSCR
- —
- Eligible?
- —
Personal DTI + credit; lowest rate.
DSCR
20% down · 8.5% · 30yr
- Down + closing
- —
- Monthly P&I
- —
- Monthly cashflow
- —
- DSCR
- —
- Eligible?
- —
No personal income docs; deal must DSCR.
Hard money
10% down · 12.0% · 12mo
- Down + closing
- —
- Monthly P&I
- —
- Monthly cashflow
- —
- DSCR
- —
- Eligible?
- —
Short-term bridge; refi at stabilization.
Rent comps 24 comps
| Address | Beds | Baths | Sqft | Rent | $/sqft | DOM | Units | Dist |
|---|---|---|---|---|---|---|---|---|
| 1095 Ozment Dr Florissant, MO | 3.0 | 2.0 | 984 | $1,461 | $1.48 | 24d | 1 | 0.12mi |
| 1050 Ozment Dr Florissant, MO | 3.0 | 2.0 | 984 | $1,525 | $1.55 | 44d | 1 | 0.17mi |
| 1502 Summer Run Dr #108 Florissant, MO | 2.0 | 1.5 | 922 | $1,200 | $1.30 | 24d | 1 | 0.25mi |
| 1670 Arundel Dr Florissant, MO | 3.0 | 2.0 | 1012 | $1,450 | $1.43 | 24d | 1 | 0.36mi |
| 50 Lynn Meadows Ln Florissant, MO | 3.0 | 1.0 | 864 | $1,450 | $1.68 | 24d | 1 | 0.64mi |
| 765 Bobbins Ln Florissant, MO | 3.0 | 1.0 | 1107 | $1,450 | $1.31 | 44d | 1 | 0.80mi |
| 297 Saint Eugene Ln Florissant, MO | 2.0 | 1.0 | 1100 | $1,100 | $1.00 | 44d | 1 | 0.98mi |
| 1465 W Duchesne Dr Florissant, MO | 3.0 | 1.0 | 896 | $1,500 | $1.67 | 44d | 1 | 1.02mi |
| 24 Barto Dr Saint Louis, MO | 3.0 | 1.0 | 864 | $1,400 | $1.62 | 44d | 1 | 1.10mi |
| 11 Anistasia Dr Saint Louis, MO | 3.0 | 1.5 | 1120 | $1,345 | $1.20 | 24d | 1 | 1.13mi |
| 36 Connolly Dr Saint Louis, MO | 3.0 | 1.0 | 1024 | $1,149 | $1.12 | 24d | 1 | 1.15mi |
| 1600 Washington St Florissant, MO | 3.0 | 1.5 | 1095 | $1,250 | $1.14 | 20d | 1 | 1.16mi |
| 1275 N Florissant Rd Saint Louis, MO | 2.0 | 1.0 | 1008 | $1,275 | $1.26 | 24d | 1 | 1.16mi |
| 20 Saint Benedict Ln Florissant, MO | 3.0 | 1.5 | 1092 | $1,525 | $1.40 | 20d | 1 | 1.17mi |
| 1180 S New Florissant Rd Florissant, MO | 3.0 | 1.0 | 925 | $1,225 | $1.32 | 24d | 1 | 1.20mi |
| 1725 Saint Catherine St Florissant, MO | 3.0 | 1.0 | 1107 | $1,800 | $1.63 | 15d | 1 | 1.25mi |
| 107 Anistasia Dr Saint Louis, MO | 2.0 | 2.0 | 1030 | $1,400 | $1.36 | 24d | 1 | 1.25mi |
| 46 Bascom Dr Saint Louis, MO | 2.0 | 1.0 | 932 | $1,175 | $1.26 | 44d | 1 | 1.26mi |
| 24 Vierling Dr Saint Louis, MO | 2.0 | 1.0 | 850 | $1,290 | $1.52 | 7d | 1 | 1.33mi |
| 221 Barto Dr Saint Louis, MO | 3.0 | 2.0 | 958 | $1,295 | $1.35 | 20d | 1 | 1.34mi |
| 153 Bascom Dr Saint Louis, MO | 3.0 | 1.0 | 1076 | $1,195 | $1.11 | 20d | 1 | 1.39mi |
| 171 Elbring Dr Saint Louis, MO | 3.0 | 1.5 | 1008 | $1,395 | $1.38 | 12d | 1 | 1.41mi |
| 220 Du Bourg Ln Florissant, MO | 2.0 | 1.0 | 816 | $1,150 | $1.41 | 44d | 1 | 1.46mi |
| 241 Flora Dr Saint Louis, MO | 2.0 | 1.0 | 703 | $1,075 | $1.53 | 24d | 1 | 1.47mi |
Listing history 18 events
-
2026-06-18days on market $124,900 Active 69 DOM
-
2026-06-17days on market $124,900 Active 68 DOM
-
2026-06-16days on market $124,900 Active 67 DOM
-
2026-06-15days on market $124,900 Active 66 DOM
-
2026-06-13days on market $124,900 Active 64 DOM
-
2026-06-13days on market $124,900 Active 63 DOM
-
2026-06-09days on market $124,900 Active 60 DOM
-
2026-06-08days on market $124,900 Active 59 DOM
-
2026-06-07days on market $124,900 Active 58 DOM
-
2026-06-05days on market $124,900 Active 55 DOM
-
2026-06-03days on market $124,900 Active 54 DOM
-
2026-06-02days on market $124,900 Active 53 DOM
-
2026-06-01days on market $124,900 Active 52 DOM
-
2026-05-31days on market $124,900 Active 51 DOM
-
2026-05-14price $124,900 818-char remark
Show marketing remark (818 chars)
Property to be sold AS-IS. Seller to do no repairs or inspections including governmental inspections. Here is your chance to own a darling fixer upper in the heart of Florissant. This 3 bed 1 bath beauty is waiting for it's new owner. There is a newer furnace and ac unit along with pvc plumbing some of big ticket items are already taken care of. The windows are older and electrical panel needs to be updated. Not sure what the age of the roof is but nothing is leaking and appears to be in good working order. There are beautiful hardwood floors throughout. It even comes with free pink tile in the bathroom! This would make a great fix and flip or cash flowing investment property for the savvy investor. Schedule a showing today as this one probably won't last long. Refer to ShowingTime for showing instructions.
-
2026-05-04price $129,900 818-char remark
Show marketing remark (818 chars)
Property to be sold AS-IS. Seller to do no repairs or inspections including governmental inspections. Here is your chance to own a darling fixer upper in the heart of Florissant. This 3 bed 1 bath beauty is waiting for it's new owner. There is a newer furnace and ac unit along with pvc plumbing some of big ticket items are already taken care of. The windows are older and electrical panel needs to be updated. Not sure what the age of the roof is but nothing is leaking and appears to be in good working order. There are beautiful hardwood floors throughout. It even comes with free pink tile in the bathroom! This would make a great fix and flip or cash flowing investment property for the savvy investor. Schedule a showing today as this one probably won't last long. Refer to ShowingTime for showing instructions.
-
2026-04-23price $134,900 818-char remark
Show marketing remark (818 chars)
Property to be sold AS-IS. Seller to do no repairs or inspections including governmental inspections. Here is your chance to own a darling fixer upper in the heart of Florissant. This 3 bed 1 bath beauty is waiting for it's new owner. There is a newer furnace and ac unit along with pvc plumbing some of big ticket items are already taken care of. The windows are older and electrical panel needs to be updated. Not sure what the age of the roof is but nothing is leaking and appears to be in good working order. There are beautiful hardwood floors throughout. It even comes with free pink tile in the bathroom! This would make a great fix and flip or cash flowing investment property for the savvy investor. Schedule a showing today as this one probably won't last long. Refer to ShowingTime for showing instructions.
-
2026-04-10$139,900 Active 818-char remark
Show marketing remark (818 chars)
Property to be sold AS-IS. Seller to do no repairs or inspections including governmental inspections. Here is your chance to own a darling fixer upper in the heart of Florissant. This 3 bed 1 bath beauty is waiting for it's new owner. There is a newer furnace and ac unit along with pvc plumbing some of big ticket items are already taken care of. The windows are older and electrical panel needs to be updated. Not sure what the age of the roof is but nothing is leaking and appears to be in good working order. There are beautiful hardwood floors throughout. It even comes with free pink tile in the bathroom! This would make a great fix and flip or cash flowing investment property for the savvy investor. Schedule a showing today as this one probably won't last long. Refer to ShowingTime for showing instructions.
ⓘ Source: listings_history table (triggers on properties + properties_extension) + one-shot
backfill from property_details.listing_events for pre-trigger history.
Tax reassessment forecast MO · Resets to sale price
- Current annual tax
- $1,524 · $127/mo
- Projected year-2 tax
- $1,524 · $127/mo
- Expected delta
- $0/yr ($0/mo · 0.0%)
ⓘ Screening estimate from a state-policy table — verify with the county assessor before closing.
Climate risk First Street
- Flood 1/10 Low FEMA zone X (unshaded) · 0% chance over 30 yrs
- Wildfire 1/10 Low
- Heat 4/10 Moderate 7 d/yr ≥106°F today · 20 d/yr by 30 yrs out
- Wind 2/10 Low 100% chance of damaging wind over 30 yrs
- Air quality 3/10 Moderate 3 unhealthy d/yr today · 5 by 30 yrs out
Nearby sold comps map
Loading sold comps map…
Walkable amenities ~0.75 mi
Loading nearby amenities…
Taxation est. · year 1
- Rental income
- $18,489
- − Mortgage interest
- −$6,996
- − Property taxes
- −$1,524
- − Insurance
- −$624
- − Repairs & maintenance
- −$1,479
- − Management
- −$1,479
- − Depreciation
- −$3,633
- Taxable income
- $2,753
- Est. tax owed @ 24.0%
- −$661
- After-tax cash flow
- $3,938/yr
For passive investors: Depreciation is non-cash, so a rental often shows a tax loss while cash-flowing — sheltering income. Rental losses are passive: they offset passive income freely, and up to $25,000/yr can offset ordinary (W-2) income if you actively participate and your MAGI is under $100k (phasing out to $0 by $150k); unused losses carry forward. On sale, claimed depreciation is recaptured at up to 25%, and gains may owe capital-gains tax (a 1031 exchange can defer both). Figures are a year-1 estimate at your 24.0% rate — not tax advice; consult a CPA.
Schools (NCES district)
- District
- Ferguson-Florissant R-II
- NCES district ID
- 2912010
- Math proficiency
- 7% ▼ -9.00%
- Reading proficiency
- 20% ▼ -6.00%
- Median HH income
- $44,610
- Composite
- 11.96/100
- National rank
- #9666
- State rank
- #311 of 324 in MO
Livability — Florissant
- Score
- 73/100
- State rank
- #82
- US rank
- #5406
Category grades
Schools grade is shown separately in the Schools card above.
Census & demographics
- Census place
- Florissant, MO
- County
- Saint Louis County · 888,823 people
- City population
- 69,104
- Metro
- St. Louis, MO-IL
- Population (ZIP)
- 43,056
- Household income
- $66,776
- Rent vs Own
- Severe rent burden
- 1429.0
Population outlook (St. Louis County) Hauer SSP2
- Today (2025)
- 1,025,227 people
- By 2030
- 1,028,023 · +0.3%
- By 2040
- 1,020,940 · -0.4%
- By 2050
- 1,007,280 · -1.8%
- By 2075
- 987,277 · -3.7%
- By 2100
- 921,984 · -10.1%
Race, ethnicity, and origin ACS 2023
- Neighborhood character
- Predominantly Black (71%)
- Race & ethnicity
- Black 71% White 23% Two or more races 4% Hispanic / Latino 1%
- Common ancestry
- Romanian 1% Lithuanian 1% Italian 1%
- Foreign-born
- 3% · Canada, Vietnam
- Languages at home
- 95% English-only · Spanish 1% French/Haitian/Cajun 1%
Political lean MEDSL · St. Louis
- 2024 margin
- Strong D (+23.4) · D 60.8% · R 37.4% · Other 1.7%
- 2008→2024 swing
- +3.5pp toward D · 2008: 19.9pp · 2024: 23.4pp
- All cycles
- 2024: D+23.4 2020: D+24.0 2016: D+16.2 2012: D+13.7 2008: D+19.9
Not yet ingested
- Civics
- —
Market trends
- HPI YoY
- ▲ 13.78%
- Current HPI
- 570.6
- Rent YoY
- ▲ 7.51%
- Metro
- St. Louis, MO-IL
- State GDP YoY
- ▲ 1.84%
- F500 in state
- 20
Industry mix (Fortune 500 HQ in MO)
| Industry | F500 HQs | Revenue |
|---|---|---|
| Healthcare | 1 | $163B |
|
||
| Insurance | 1 | $21B |
|
||
| Industrial Technology | 1 | $17B |
|
||
| Retail | 1 | $16B |
|
||
| Industrial Distribution | 1 | $10B |
|
||
| Utilities | 1 | $9B |
|
||
Price history
-10.7% since first listed4 events — show timeline
- 2026-05-14 Price Changed $124,900 MARIS as Distributed by MLS Grid
- 2026-05-04 Price Changed $129,900 MARIS as Distributed by MLS Grid
- 2026-04-23 Price Changed $134,900 MARIS as Distributed by MLS Grid
- 2026-04-10 Listed $139,900 MARIS as Distributed by MLS Grid
Property tax history
+0.4%/yrLatest (2022): $1,524 · +1.7% YoY. Source: county tax records.
Cash-flow waterfall
monthlySold comps — $/sqft
last 12 mo · ≤1 miLoading sold comps…