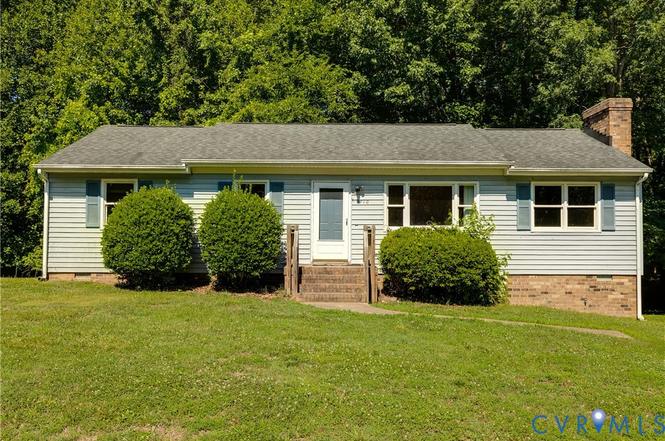
2710 Puckett Ct · Rockwood, VA
Flood risk 1/10 · Minimal
- FEMA flood zone
- X (unshaded)
- Chance of flooding over 30 yrs
- 0.0%
- Est. flood insurance / yr
- $507 – $1,088
Fire risk 1/10 · Minimal
- Est. fire insurance / yr
- $666 – $1,236
Heat risk 7/10 · Major
- Hot days now (above 104°F)
- 7 days/yr
- Hot days in 30 yrs
- 15 days/yr
Wind risk 5/10 · Moderate
- Chance of severe wind over 30 yrs
- 25.0%
Air-quality risk 2/10 · Minimal
- Unhealthy air days now
- 0 days/yr
- Unhealthy air days in 30 yrs
- 2 days/yr
Risk factors via First Street. Map © Google.
Why this score? — see what drove the C- grade
The composite is a weighted blend of 9 inputs, each scored 0–100. Each bar is that input's sub-score; the figure is the points it added to the 100-point composite (weight × sub-score).
- Cash flow +15.3/30.0
- ARV discount +12.6/15.0
- Schools +5.2/10.0
- DSCR +4.7/10.0
- Livability +3.9/5.0
- 1% rule +3.4/10.0
- Rent growth +3.1/5.0
- Condition / age +2.5/5.0
- Appreciation +0.0/10.0
$289,000
🖨 Deal sheet (PDF) 📄 Offer letter ✓ Due diligence
Listing remarks
3 bedroom, 2 bathroom, ranch home in desirable Chesterfield County! Situated on a spacious lot in the peaceful Lake Genito neighborhood, this home would make a great first home or investment property. The spacious living room with fireplace. The eat-in kitchen has ample cabinet and counter space. All three bedrooms are generously sized. Step outside to enjoy the expansive backyard. A driveway provides ample off-street parking. Trane HVAC from 2013. Conveniently located near parks, schools, shopping, dining, and major commuter routes. Schedule your showing today! Property sold as-is.
Key facts
- Ranch home
- Spacious lot
- Eat-in kitchen
Tags
Property features AI
Finance
- Other: Zoning: R7; Lot size: 0.325 acres; Above-grade finished area: 1,300 (value provided)
Exterior
- Parking: Off-street parking; Unpaved driveway
- Security: No security features listed
- Utilities: Public water; Public sewer
- Home design: Single-story home; Resale property
- Construction: Brick and vinyl siding exterior; Asphalt roof; Built (actual year not specified)
- Exterior features: Unpaved driveway; Driveway and off-street parking
Interior
- Kitchen: No specific appliances listed beyond water heater
- Bedrooms: Total rooms: 6
- Flooring: Laminate
- Bathrooms: 2 full bathrooms
- Heating & cooling: Central air conditioning; Electric heating; Heat pump
- Interior features: Laminate flooring; Electric water heater
- Laundry & utility: No specific laundry appliances listed
Neighborhood map
What this means for you Summary
Snapshot
- This is a 3-bed/1.5-bath single-family listed at $289k.
Deal economics
- At list price, monthly cash flow is $107 ($1k/yr) — positive.
- The deal already cash-flows at list — no discount required.
- To meet the 1% rule (rent ≥ 1% of price), the offer needs to be $243k (15.9% below list).
- Recommended offer: $243k (15.9% below list) — sets the bar for 1% rule.
- Cap rate 6.7% vs local median 4.2% in Rockwood — top-decile yield for the area; either an underpriced asset or a hidden risk that comps aren't pricing in. Stress-test before assuming the spread holds.
Location & tenants
- Location reads 77/100 on livability (#86 in VA, #2,803 nationally) — a middle-class / working-renter tenant base. Strengths: housing A+, health & safety A+, schools A; Watch: amenities F, commute F.
- Chesterfield County Public School District (suburban): math 52% / reading 64% proficiency, ranked #57 of 131 in VA (top 44%) — acceptable for families but not a draw, mixed tenant base, ~2y average lease.
- Market conditions: Rents rising (+2.3%/yr); 492 active listings in the ZIP; 4 comparable units currently listed for rent nearby; rentals at typical pace (median 21d on market — plan ~3-4 weeks tenant-placement turnaround); high-income renter base; 2,307 units permitted in Chesterfield County in 2024 (462 in 5+ unit buildings).
Forward outlook
- Local home prices are declining (-3.0%/yr); year-one equity from $2k of loan paydown is wiped out by about $9k of value loss. Plan a longer hold.
- Chesterfield County population projected at +20% by 2050 — long-run rental-demand tailwind backs the buy-and-hold thesis.
Negotiation context
- Only 1 days on market — expect competitive offers; lowballing is unlikely to land.
Risks & watch-outs
- Climate carrying-cost: moderate wind risk, 25% chance of damaging wind over 30y; extreme-heat days projected 7→15/yr by 2055 (HVAC capex compounding) — expect insurance premiums to compound above CPI over the hold.
Questions for the listing agent
- Is there a deadline driving the sale (1031 exchange, divorce, estate, relocation)? That informs how much negotiation room exists.
- Schools are A-rated — typically a magnet for longer-tenancy family renters. What's the average tenant stay here, and is there a school-zone premium baked into asking?
- What's the average days-on-market for RENTAL listings here right now (not sales)? A rising rental-DOM trend means longer vacancies and softer asking-rent achievability than the comps imply.
- What's the recent tenant-quality profile in this submarket — average credit score on applications, eviction rate, late-payment / NSF rate, and stable-employment percentage? A property-management company in the area should have these aggregated.
- How much new for-sale + rental construction is in the pipeline within 1–3 miles? Heavy new supply typically softens prices + rents 12–24 months out; constrained supply supports both.
Investment metrics
- 1% rule
- 0.84% ✗
- Cap rate
- 6.74%
- Cash-on-cash
- 1.58%
- DSCR
- 1.07
- GRM
- 9.9
CMA / ARV
- ARV (on-the-fly)
- $326,300
- Comps found
- 12
Show comp detail 12 sales within ~0.75 mi
| Address | Dist | Beds/Ba | Sqft | Sold | Price | $/sf | Match |
|---|---|---|---|---|---|---|---|
| 11201 Puckett Pl | 0.12mi | 3/1.5 | 1,294 (-0%) | 5mo | $325,000 | $251 | 90 |
| 3030 Clintwood Rd | 0.36mi | 3/2.0 | 1,350 (+4%) | 1mo | $315,000 | $233 | 74 |
| 2831 Delfin Rd | 0.18mi | 3/2.0 | 1,431 (+10%) | 2mo | $365,000 | $255 | 72 |
| 3041 Clintwood Rd | 0.31mi | 3/1.5 | 1,200 (-8%) | 2mo | $275,000 | $229 | 71 |
| 11101 Dumaine Dr | 0.40mi | 3/2.0 | 1,224 (-6%) | 1mo | $345,000 | $282 | 69 |
| 2917 Speeks Dr | 0.24mi | 3/2.0 | 1,428 (+10%) | 4mo | $340,000 | $238 | 67 |
| 2218 Providence Creek Rd | 0.56mi | 3/1.5 | 1,258 (-3%) | 6mo | $353,000 | $281 | 63 |
| 3055 Quisenberry St | 0.66mi | 3/1.0 | 1,325 (+2%) | 2mo | $335,000 | $253 | 62 |
| 2707 Quisenberry St | 0.66mi | 3/2.0 | 1,250 (-4%) | 4mo | $297,000 | $238 | 57 |
| 11300 Forestwind Dr | 0.46mi | 3/2.0 | 1,427 (+10%) | 4mo | $369,900 | $259 | 57 |
| 3350 Kellynn Dr | 0.61mi | 3/1.5 | 1,431 (+10%) | 2mo | $329,500 | $230 | 53 |
| 2869 Iverson Rd | 0.70mi | 3/2.0 | 1,420 (+9%) | 1mo | $320,000 | $225 | 49 |
Match score weights: distance 35% · size 25% · config 20% · recency 20%. Top-matched comps best support the ARV.
Projected returns pro-forma
-3.0% appreciation · 2.29% rent growth · sell at horizon
- IRR
- -14.5%
- Equity multiple
- 0.48×
- Total profit
- $-41,840
- Equity at exit
- $43,091
- IRR
- -7.0%
- Equity multiple
- 0.57×
- Total profit
- $-34,975
- Equity at exit
- $24,987
Cash invested: $80,920 (down + closing). Projections, not guarantees.
Landlord ↔ Tenant lean methodology
- Overall (STATE)
- 55 Moderately Landlord-Leaning
- State Virginia
- 55 Moderately Landlord-Leaning · D+2
- County
- — inherits STATE
- City
- — inherits STATE
ZIP-level market 23112
- Rents YoY
- 2.3%
- Active inventory
- 492
- Price-to-rent
- 9.9×
Monthly cashflow live
- Estimated rent
- $2,432 medium interval (Pro) →
- Mortgage (P&I)
- −$1,516
- Tax from tax record
- −$178 /mo · $2,140/yr
- Insurance
- −$120
- HOA
- −$0
- Vacancy / Maint / Mgmt
- −$511
- Net cashflow
- $107
Break-even live
Sensitivity live
| Price | -10% $270 | -5% $188 | +0% $107 | +5% $25 | +10% $-57 |
|---|---|---|---|---|---|
| Rent | -10% $-85 | -5% $11 | +0% $107 | +5% $203 | +10% $299 |
| Rate | -1.0pp $252 | -0.5pp $180 | base $107 | +0.5pp $32 | +1.0pp $-44 |
UW: 25.0% down · 7.5% · 30yr · 1.5% tax · 5.0% vac · 8.0% maint · 8.0% mgmt
Financing live
Cash to close
- Down payment
- $72,250
- Closing costs
- $8,670
- Reserves months
- —
- Total cash needed
- —
Loan-product check · same deal, 3 products live
Conventional
25% down · 7.5% · 30yr
- Down + closing
- —
- Monthly P&I
- —
- Monthly cashflow
- —
- DSCR
- —
- Eligible?
- —
Personal DTI + credit; lowest rate.
DSCR
20% down · 8.5% · 30yr
- Down + closing
- —
- Monthly P&I
- —
- Monthly cashflow
- —
- DSCR
- —
- Eligible?
- —
No personal income docs; deal must DSCR.
Hard money
10% down · 12.0% · 12mo
- Down + closing
- —
- Monthly P&I
- —
- Monthly cashflow
- —
- DSCR
- —
- Eligible?
- —
Short-term bridge; refi at stabilization.
Rent comps 4 comps
| Address | Beds | Baths | Sqft | Rent | $/sqft | DOM | Units | Dist |
|---|---|---|---|---|---|---|---|---|
| 2900 Clintwood Rd Midlothian, VA | 3.0 | 2.0 | 1500 | $2,225 | $1.48 | 20d | 1 | 0.34mi |
| 3225 Hollyglen Ct Midlothian, VA | 3.0 | 2.0 | 1274 | $2,125 | $1.67 | 24d | 1 | 0.80mi |
| 3310 Old Courthouse Rd North Chesterfield, VA | 1.0–3.0 | 1.0–2.0 | 880 | $2,408 | $2.74 | 3d | 9 | 0.92mi |
| 2350 Scenic Lake Dr Midlothian, VA | 1.0–3.0 | 1.0–2.5 | 1255 | $3,210 | $2.56 | 2d | 37 | 1.22mi |
Listing history 2 events
-
2026-06-19remarks 589-char remark
-
2026-06-19$289,000 Active 1 DOM
ⓘ Source: listings_history table (triggers on properties + properties_extension) + one-shot
backfill from property_details.listing_events for pre-trigger history.
Tax reassessment forecast VA · Resets to sale price
- Current annual tax
- $2,140 · $178/mo
- Projected year-2 tax
- $2,370 · $197/mo
- Expected delta
- +$229/yr (+$19/mo · 10.7%)
ⓘ Screening estimate from a state-policy table — verify with the county assessor before closing.
Climate risk First Street
- Flood 1/10 Low FEMA zone X (unshaded) · 0% chance over 30 yrs
- Wildfire 1/10 Low
- Heat 7/10 Severe 7 d/yr ≥104°F today · 15 d/yr by 30 yrs out
- Wind 5/10 Major 25% chance of damaging wind over 30 yrs
- Air quality 2/10 Low 0 unhealthy d/yr today · 2 by 30 yrs out
Nearby sold comps map
Loading sold comps map…
Walkable amenities ~0.75 mi
Loading nearby amenities…
Taxation est. · year 1
- Rental income
- $29,179
- − Mortgage interest
- −$16,188
- − Property taxes
- −$2,140
- − Insurance
- −$1,445
- − Repairs & maintenance
- −$2,334
- − Management
- −$2,334
- − Depreciation
- −$8,407
- Taxable loss
- −$3,671
- Est. tax savings @ 24.0%
- +$881
- After-tax cash flow
- $2,160/yr
For passive investors: Depreciation is non-cash, so a rental often shows a tax loss while cash-flowing — sheltering income. Rental losses are passive: they offset passive income freely, and up to $25,000/yr can offset ordinary (W-2) income if you actively participate and your MAGI is under $100k (phasing out to $0 by $150k); unused losses carry forward. On sale, claimed depreciation is recaptured at up to 25%, and gains may owe capital-gains tax (a 1031 exchange can defer both). Figures are a year-1 estimate at your 24.0% rate — not tax advice; consult a CPA.
Schools (NCES district)
- District
- Chesterfield County Public School District
- NCES district ID
- 5100840
- Math proficiency
- 52% ▼ -30.00%
- Reading proficiency
- 64% ▼ -15.00%
- Median HH income
- $72,821
- Composite
- 51.56/100
- National rank
- #1712
- State rank
- #57 of 131 in VA
Livability — Rockwood
- Score
- 77/100
- State rank
- #86
- US rank
- #2803
Category grades
Schools grade is shown separately in the Schools card above.
Census & demographics
- County
- Chesterfield County · 406,988 people
- Metro
- Richmond, VA
- Population (ZIP)
- 57,016
- Household income
- $116,465
- Rent vs Own
- Severe rent burden
- 897.0
Population outlook (Chesterfield County) Hauer SSP2
- Today (2025)
- 377,190 people
- By 2030
- 395,710 · +4.9%
- By 2040
- 427,694 · +13.4%
- By 2050
- 452,706 · +20.0%
- By 2075
- 505,533 · +34.0%
- By 2100
- 521,282 · +38.2%
Race, ethnicity, and origin ACS 2023
- Neighborhood character
- Predominantly White (70%)
- Race & ethnicity
- White 70% Black 14% Two or more races 7% Hispanic / Latino 6% Asian 4%
- Hispanic origin (detail)
- Mexican 1% Puerto Rican 2%
- Common ancestry
- Lithuanian 4% Italian 4% Romanian 2%
- Foreign-born
- 7% · Canada, China, Jamaica
- Languages at home
- 91% English-only · Spanish 4% Other Indo-European 1% Arabic 1%
Political lean MEDSL · Chesterfield
- 2024 margin
- Lean D (+9.0) · D 53.8% · R 44.8% · Other 1.4%
- 2008→2024 swing
- +16.4pp toward D · 2008: -7.5pp · 2024: 9.0pp
- All cycles
- 2024: D+9.0 2020: D+6.7 2016: R+2.2 2012: R+7.1 2008: R+7.5
Not yet ingested
- Civics
- —
Market trends
- HPI YoY
- ▼ -224.87%
- Current HPI
- 277.4841
- Rent YoY
- ▲ 2.29%
- Metro
- Richmond, VA
- State GDP YoY
- ▲ 2.40%
- F500 in state
- 50
Industry mix (Fortune 500 HQ in VA)
| Industry | F500 HQs | Revenue |
|---|---|---|
| Aerospace / Defense | 4 | $236B |
|
||
| Technology / Defense | 3 | $32B |
|
||
| Financial Services | 2 | $176B |
|
||
| Utilities | 2 | $27B |
|
||
| Insurance | 2 | $25B |
|
||
| Technology | 2 | $15B |
|
||
Price history
1 event — show timeline
- 2026-06-18 Listed $289,000 CVRMLS
Property tax history
+4.8%/yrLatest (2025): $2,140 · +1.0% YoY. Source: county tax records.
Cash-flow waterfall
monthlySold comps — $/sqft
last 12 mo · ≤1 miLoading sold comps…