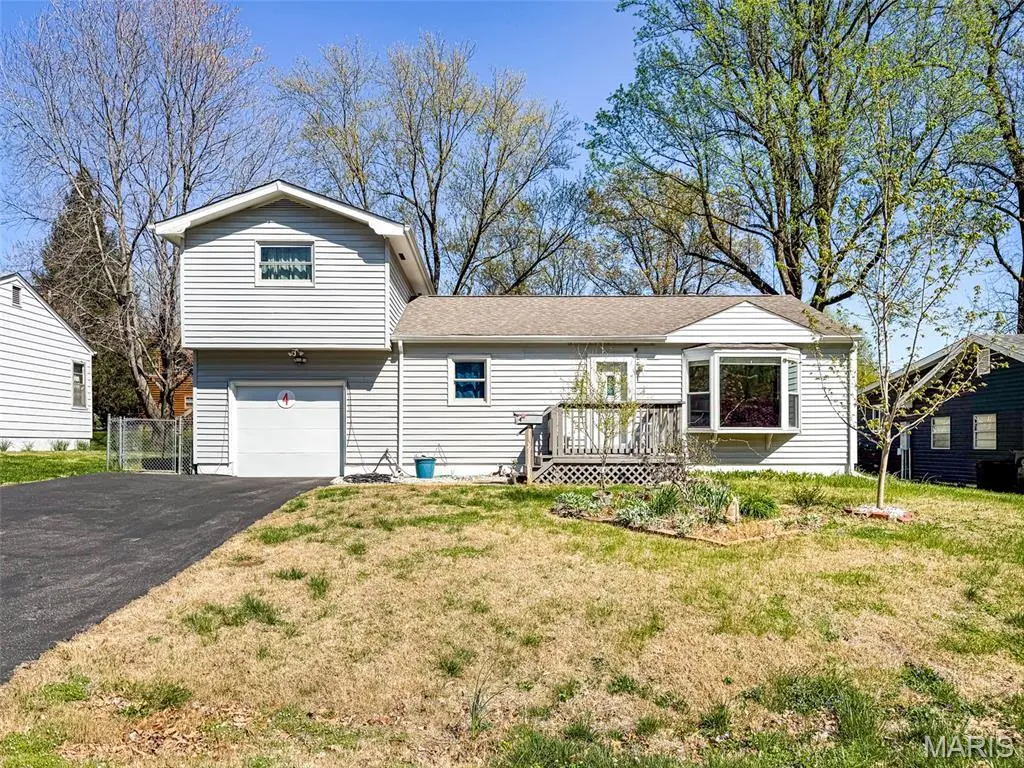
4 Marlo Dr · Belleville, IL
Flood risk 1/10 · Minimal
- FEMA flood zone
- X
- Chance of flooding over 30 yrs
- 0.0%
- Est. flood insurance / yr
- $507 – $1,088
Fire risk 1/10 · Minimal
- Est. fire insurance / yr
- $804 – $1,492
Heat risk 5/10 · Moderate
- Hot days now (above 107°F)
- 7 days/yr
- Hot days in 30 yrs
- 21 days/yr
Wind risk 2/10 · Minimal
- Chance of severe wind over 30 yrs
- 1.0%
Air-quality risk 4/10 · Minor
- Unhealthy air days now
- 3 days/yr
- Unhealthy air days in 30 yrs
- 6 days/yr
Risk factors via First Street. Map © Google.
Why this score? — see what drove the F grade
The composite is a weighted blend of 9 inputs, each scored 0–100. Each bar is that input's sub-score; the figure is the points it added to the 100-point composite (weight × sub-score).
- Cash flow +12.7/30.0
- 1% rule +4.6/10.0
- Livability +3.9/5.0
- DSCR +3.8/10.0
- Rent growth +3.6/5.0
- Condition / age +2.5/5.0
- Schools +2.2/10.0
- ARV discount +1.1/15.0
- Appreciation +0.0/10.0
$139,000
🖨 Deal sheet 📄 Offer letter ✓ Due diligence
Listing remarks
Tucked into a quiet, often overlooked street right in the heart of town, this home offers a setting that’s hard to find: a true sense of neighborhood, where neighbors know each other and friendships come naturally. This 3 bedroom, 1 bath home features a functional layout with a main floor primary bedroom set apart from the two guest bedrooms, creating a comfortable split-bedroom design. The living space is filled with natural light from a large bay window and complemented by built-ins that add both character and practicality. Hardwood floors run through most of the home, and the kitchen offers generous space with vintage-style countertops that bring a bit of personality. Many of the m
Key facts
- 8,276 sq ft lot
- Garage
- Built 1955
Property features AI
Exterior
- Parking: Attached garage (1 car)
- Utilities: Public water; Public sewer; Electric service by Ameren; Electricity connected; Natural gas connected; Water connected
- Home design: Single-family residence; Two levels
- Construction: Vinyl siding
- Exterior features: Back yard
Interior
- Kitchen: Kitchen with electric oven and microwave; Refrigerator included
- Bedrooms: Three bedrooms total (one on the main level, two on the upper level)
- Bathrooms: One full bathroom (main level)
- Heating & cooling: Natural gas heating; Central air conditioning
- Interior features: Microwave; Electric oven; Refrigerator; Water heater
- Laundry & utility: Washer and dryer included
Neighborhood map
What this means for you Summary
Snapshot
- This is a 3-bed/3.0-bath single-family listed at $139k.
Deal economics
- At list price, monthly cash flow is $-15 ($-180/yr) — negative.
- To cash-flow at today's rent, offer at most $136k (1.9% below list).
- To meet the 1% rule (rent ≥ 1% of price), the offer needs to be $133k (4.5% below list).
- Recommended offer: $133k (4.5% below list) — sets the bar for 1% rule.
Location & tenants
- Location reads 78/100 on livability (#142 in IL, #2,604 nationally) — a middle-class / working-renter tenant base. Strengths: commute A+, cost of living A+, housing A+; Watch: crime F, amenities D-.
- Belleville Twp Hsd 201 (suburban): math 21% / reading 28% proficiency, ranked #308 of 620 in IL (top 50%) — low school quality limits family demand, transient renter base, plan for 1-2y turnover.
- Zoned schools: Belleville High School-West (math 19% / reading 26%, grade F, #317 of 693 statewide, top 46%, 2,234 students, 0% FRL).
- Market conditions: Rents rising fast (+4.6%/yr); 190 active listings in the ZIP; 8 comparable units currently listed for rent nearby; rentals at typical pace (median 24d on market — plan ~3-4 weeks tenant-placement turnaround); 783 units permitted in St. Clair County in 2024 (378 in 5+ unit buildings).
Forward outlook
- Local home prices are declining (-3.0%/yr); year-one equity from $961 of loan paydown is wiped out by about $4k of value loss. Plan a longer hold.
- St. Clair County population projected at -23% by 2050 — secular population decline; favor cash flow + early exit over multi-decade hold.
Negotiation context
- It's been on market 16 days — a 2% lower offer ($137k) is reasonable based on typical stale-listing flexibility.
- Current owner paid $48k; list at $139k implies a 190% gain — meaningful room to come down on a strong offer.
Risks & watch-outs
- Watch-outs: built in 1955 — expect roof / HVAC / electrical / plumbing capex.
- Climate carrying-cost: extreme-heat days projected 7→21/yr by 2055 (HVAC capex compounding) — expect insurance premiums to compound above CPI over the hold.
Questions for the listing agent
- What do current leases actually rent for vs. the listed asking? Can we see a recent rent roll and the last 12 months of T-12 income?
- Built in 1955 — when were the roof, HVAC, electrical panel, plumbing, and water heater last replaced?
- Is there a deadline driving the sale (1031 exchange, divorce, estate, relocation)? That informs how much negotiation room exists.
- Crime grade is F in this area — have there been break-ins, vandalism, or insurance claims at this property in the last 3 years? What carrier currently insures it and at what premium?
- The area grade is low — what's the realistic commute time and amenity access for the typical tenant pool here? Any planned neighborhood developments (good or bad) we should know about?
- What's the average days-on-market for RENTAL listings here right now (not sales)? A rising rental-DOM trend means longer vacancies and softer asking-rent achievability than the comps imply.
- What's the recent tenant-quality profile in this submarket — average credit score on applications, eviction rate, late-payment / NSF rate, and stable-employment percentage? A property-management company in the area should have these aggregated.
- How much new for-sale + rental construction is in the pipeline within 1–3 miles? Heavy new supply typically softens prices + rents 12–24 months out; constrained supply supports both.
Investment metrics
- 1% rule
- 0.96% ✗
- Cap rate
- 6.16%
- Cash-on-cash
- -0.46%
- DSCR
- 0.98
- GRM
- 8.7
CMA / ARV
- ARV (on-the-fly)
- $121,584
- Comps found
- 12
Show comp detail 12 sales within ~0.75 mi
| Address | Dist | Beds/Ba | Sqft | Sold | Price | $/sf | Match |
|---|---|---|---|---|---|---|---|
| 123 Verne Ave | 0.35mi | 2/1.0 (-1) | 868 (+6%) | 4mo | $135,000 | $156 | 57 |
| 1604 Pin Oak Ln | 0.30mi | 2/1.0 (-1) | 864 (+6%) | 11mo | $119,900 | $139 | 54 |
| 504 N 16th St | 0.63mi | 3/1.0 | 840 (+3%) | 10mo | $54,900 | $65 | 50 |
| 102 S 34th St | 0.71mi | 2/1.0 (-1) | 806 (-1%) | 3mo | $135,000 | $167 | 49 |
| 1007 Western Ave | 0.57mi | 3/1.5 | 884 (+8%) | 9mo | $132,500 | $150 | 46 |
| 1213 Kinsella Ave | 0.52mi | 2/1.0 (-1) | 864 (+6%) | 11mo | $145,000 | $168 | 44 |
| 14 Lillian Dr | 0.54mi | 3/1.0 | 925 (+13%) | 3mo | $79,900 | $86 | 42 |
| 708 Gilbert St | 0.54mi | 2/1.0 (-1) | 910 (+12%) | 1mo | $94,500 | $104 | 42 |
| 612 Morgan St | 0.72mi | 2/1.0 (-1) | 784 (-4%) | 10mo | $134,000 | $171 | 39 |
| 51 Lillian Dr | 0.56mi | 3/1.0 | 925 (+13%) | 10mo | $137,900 | $149 | 35 |
| 18 Lillian Dr | 0.54mi | 3/1.0 | 925 (+13%) | 14mo | $110,000 | $119 | 33 |
| 3106 Roland Ave | 0.60mi | 2/1.0 (-1) | 914 (+12%) | 10mo | $120,000 | $131 | 31 |
Match score weights: distance 35% · size 25% · config 20% · recency 20%. Top-matched comps best support the ARV.
Projected returns pro-forma
-3.0% appreciation · 4.56% rent growth · sell at horizon
- IRR
- -15.1%
- Equity multiple
- 0.45×
- Total profit
- $-21,278
- Equity at exit
- $20,725
- IRR
- -3.7%
- Equity multiple
- 0.73×
- Total profit
- $-10,451
- Equity at exit
- $12,018
Cash invested: $38,920 (down + closing). Projections, not guarantees.
Landlord ↔ Tenant lean methodology
- Overall (STATE)
- 43 Moderately Tenant-Leaning
- State Illinois
- 43 Moderately Tenant-Leaning · D+7
- County
- — inherits STATE
- City
- — inherits STATE
ZIP-level market 62226
- Rents YoY
- 4.6%
- Active inventory
- 190
- Price-to-rent
- 8.7×
Monthly cashflow live
- Estimated rent
- $1,328 high interval (Pro) →
- Mortgage (P&I)
- −$729
- Tax from tax record
- −$277 /mo · $3,327/yr
- Insurance
- −$58
- HOA
- −$0
- Vacancy / Maint / Mgmt
- −$279
- Net cashflow
- $-15
Break-even live
UW: 25.0% down · 7.5% · 30yr · 1.5% tax · 5.0% vac · 8.0% maint · 8.0% mgmt
Financing live
Cash to close
- Down payment
- $34,750
- Closing costs
- $4,170
- Reserves months
- —
- Total cash needed
- —
Loan-product check · same deal, 3 products live
Conventional
25% down · 7.5% · 30yr
- Down + closing
- —
- Monthly P&I
- —
- Monthly cashflow
- —
- DSCR
- —
- Eligible?
- —
Personal DTI + credit; lowest rate.
DSCR
20% down · 8.5% · 30yr
- Down + closing
- —
- Monthly P&I
- —
- Monthly cashflow
- —
- DSCR
- —
- Eligible?
- —
No personal income docs; deal must DSCR.
Hard money
10% down · 12.0% · 12mo
- Down + closing
- —
- Monthly P&I
- —
- Monthly cashflow
- —
- DSCR
- —
- Eligible?
- —
Short-term bridge; refi at stabilization.
Rent comps 8 comps
| Address | Beds | Baths | Sqft | Rent | $/sqft | DOM | Units | Dist |
|---|---|---|---|---|---|---|---|---|
| 31 S 27th St Belleville, IL | 2.0 | 1.0 | 1000 | $915 | $0.92 | 24d | 1 | 0.65mi |
| 213 Columbus Dr Belleville, IL | 3.0 | 1.0 | 1040 | $1,650 | $1.59 | 24d | 1 | 0.68mi |
| 1308 Caseyville Ave Swansea, IL | 2.0 | 1.0 | 890 | $1,200 | $1.35 | 4d | 1 | 0.75mi |
| 654 N 39th St Belleville, IL | 3.0 | 1.0 | 984 | $1,400 | $1.42 | 18d | 1 | 1.13mi |
| 54 Ben Louis Dr Belleville, IL | 2.0 | 1.0 | 900 | $1,145 | $1.27 | 24d | 1 | 1.18mi |
| 1000 Royal Heights Rd Belleville, IL | 2.0 | 1.5 | 1100 | $1,345 | $1.22 | 24d | 1 | 1.33mi |
| 4516 W Main St Belleville, IL | 2.0 | 1.0 | 607 | $850 | $1.40 | 24d | 1 | 1.36mi |
| 56 Friendly Dr Belleville, IL | 2.0 | 1.0 | 1000 | $1,550 | $1.55 | 24d | 1 | 1.37mi |
Listing history 6 events
-
2026-04-24status Pending
-
2026-04-14price $139,000
-
2026-04-09$149,000 Active
-
2026-04-07historical $149,000
-
1991-05-02soldstatus $48,000
-
1991-05-02soldstatus $48,000
ⓘ Source: listings_history table (triggers on properties + properties_extension) + one-shot
backfill from property_details.listing_events for pre-trigger history.
Tax reassessment forecast IL · Partial reset (capped growth)
- Current annual tax
- $3,327 · $277/mo
- Projected year-2 tax
- $3,327 · $277/mo
- Expected delta
- $0/yr ($0/mo · 0.0%)
ⓘ Screening estimate from a state-policy table — verify with the county assessor before closing.
Climate risk First Street
- Flood 1/10 Low FEMA zone X · 0% chance over 30 yrs
- Wildfire 1/10 Low
- Heat 5/10 Major 7 d/yr ≥107°F today · 21 d/yr by 30 yrs out
- Wind 2/10 Low 100% chance of damaging wind over 30 yrs
- Air quality 4/10 Moderate 3 unhealthy d/yr today · 6 by 30 yrs out
Nearby sold comps map
Loading sold comps map…
Walkable amenities ~0.75 mi
Loading nearby amenities…
Taxation est. · year 1
- Rental income
- $15,936
- − Mortgage interest
- −$7,786
- − Property taxes
- −$3,327
- − Insurance
- −$695
- − Repairs & maintenance
- −$1,275
- − Management
- −$1,275
- − Depreciation
- −$4,044
- Taxable loss
- −$2,466
- Est. tax savings @ 24.0%
- +$592
- After-tax cash flow
- $412/yr
For passive investors: Depreciation is non-cash, so a rental often shows a tax loss while cash-flowing — sheltering income. Rental losses are passive: they offset passive income freely, and up to $25,000/yr can offset ordinary (W-2) income if you actively participate and your MAGI is under $100k (phasing out to $0 by $150k); unused losses carry forward. On sale, claimed depreciation is recaptured at up to 25%, and gains may owe capital-gains tax (a 1031 exchange can defer both). Figures are a year-1 estimate at your 24.0% rate — not tax advice; consult a CPA.
Schools (NCES district)
- District
- Belleville Twp Hsd 201
- NCES district ID
- 1705640
- Math proficiency
- 21% ▼ -8.00%
- Reading proficiency
- 28% ▼ -3.00%
- Median HH income
- $58,064
- Composite
- 22.39/100
- National rank
- #8115
- State rank
- #308 of 620 in IL
Livability — Belleville
- Score
- 78/100
- State rank
- #142
- US rank
- #2604
Category grades
Schools grade is shown separately in the Schools card above.
Census & demographics
- Census place
- Belleville, IL
- County
- Saint Clair County · 169,691 people
- City population
- 47,407
- Metro
- St. Louis, MO-IL
- Population (ZIP)
- 28,255
- Household income
- $70,797
- Rent vs Own
- Severe rent burden
- 824.0
Population outlook (St. Clair County) Hauer SSP2
- Today (2025)
- 250,366 people
- By 2030
- 240,511 · -3.9%
- By 2040
- 217,391 · -13.2%
- By 2050
- 192,699 · -23.0%
- By 2075
- 140,637 · -43.8%
- By 2100
- 100,499 · -59.9%
Race, ethnicity, and origin ACS 2023
- Neighborhood character
- Majority White (64%)
- Race & ethnicity
- White 64% Black 24% Two or more races 7% Hispanic / Latino 3% Asian 2%
- Common ancestry
- Romanian 4% Lithuanian 2% Slovak 2%
- Foreign-born
- 4% · Canada, China
- Languages at home
- 96% English-only · Chinese 1% Spanish 1%
Political lean MEDSL · St. Clair
- 2024 margin
- Lean D (+7.9) · D 53.0% · R 45.1% · Other 1.8%
- 2008→2024 swing
- -14.6pp toward R · 2008: 22.4pp · 2024: 7.9pp
- All cycles
- 2024: D+7.9 2020: D+8.7 2016: D+5.6 2012: D+14.5 2008: D+22.4
Not yet ingested
- Civics
- —
Market trends
- HPI YoY
- ▼ -83.57%
- Current HPI
- 133.9028
- Rent YoY
- ▲ 4.56%
- Metro
- St. Louis, MO-IL
- State GDP YoY
- ▲ 1.59%
- F500 in state
- 60
Industry mix (Fortune 500 HQ in IL)
| Industry | F500 HQs | Revenue |
|---|---|---|
| Insurance | 4 | $201B |
|
||
| Consumer Goods | 4 | $87B |
|
||
| Industrial Machinery | 3 | $64B |
|
||
| Healthcare | 2 | $55B |
|
||
| Retail / Pharmacy | 1 | $148B |
|
||
| Agriculture / Food | 1 | $86B |
|
||
Price history
+189.6% since first listed6 events — show timeline
- 2026-04-24 Pending — MARIS as Distributed by MLS Grid
- 2026-04-14 Price Changed $139,000 MARIS as Distributed by MLS Grid
- 2026-04-09 Listed $149,000 MARIS as Distributed by MLS Grid
- 2026-04-07 Coming Soon $149,000 MARIS as Distributed by MLS Grid
- 1991-05-02 Sold (Public Records) $48,000 Public Records
- 1991-05-02 Sold (Public Records) $48,000 Public Records
Property tax history
+6.3%/yrLatest (2024): $3,327 · +12.1% YoY. Source: county tax records.
Cash-flow waterfall
monthlySold comps — $/sqft
last 12 mo · ≤1 miLoading sold comps…