4706 NW 36th St #507 · Lauderdale Lakes, FL
Flood risk 1/10 · Minimal
- FEMA flood zone
- X (shaded)
- Chance of flooding over 30 yrs
- 0.0%
- Est. flood insurance / yr
- $507 – $1,088
Fire risk 1/10 · Minimal
- Est. fire insurance / yr
- $947 – $1,759
Heat risk 9/10 · Severe
- Hot days now (above 105°F)
- 7 days/yr
- Hot days in 30 yrs
- 23 days/yr
Wind risk 10/10 · Severe
- Chance of severe wind over 30 yrs
- 99.0%
Air-quality risk 3/10 · Minor
- Unhealthy air days now
- 3 days/yr
- Unhealthy air days in 30 yrs
- 3 days/yr
Risk factors via First Street. Map © Google.
Why this score? — see what drove the D grade
The composite is a weighted blend of 9 inputs, each scored 0–100. Each bar is that input's sub-score; the figure is the points it added to the 100-point composite (weight × sub-score).
- 1% rule +10.0/10.0
- Cash flow +9.9/30.0
- ARV discount +7.5/15.0
- Schools +4.1/10.0
- Livability +4.0/5.0
- DSCR +2.8/10.0
- Condition / age +2.5/5.0
- Rent growth +2.2/5.0
- Appreciation +0.0/10.0
$95,000
🖨 Deal sheet (PDF) 📄 Offer letter ✓ Due diligence
Listing remarks
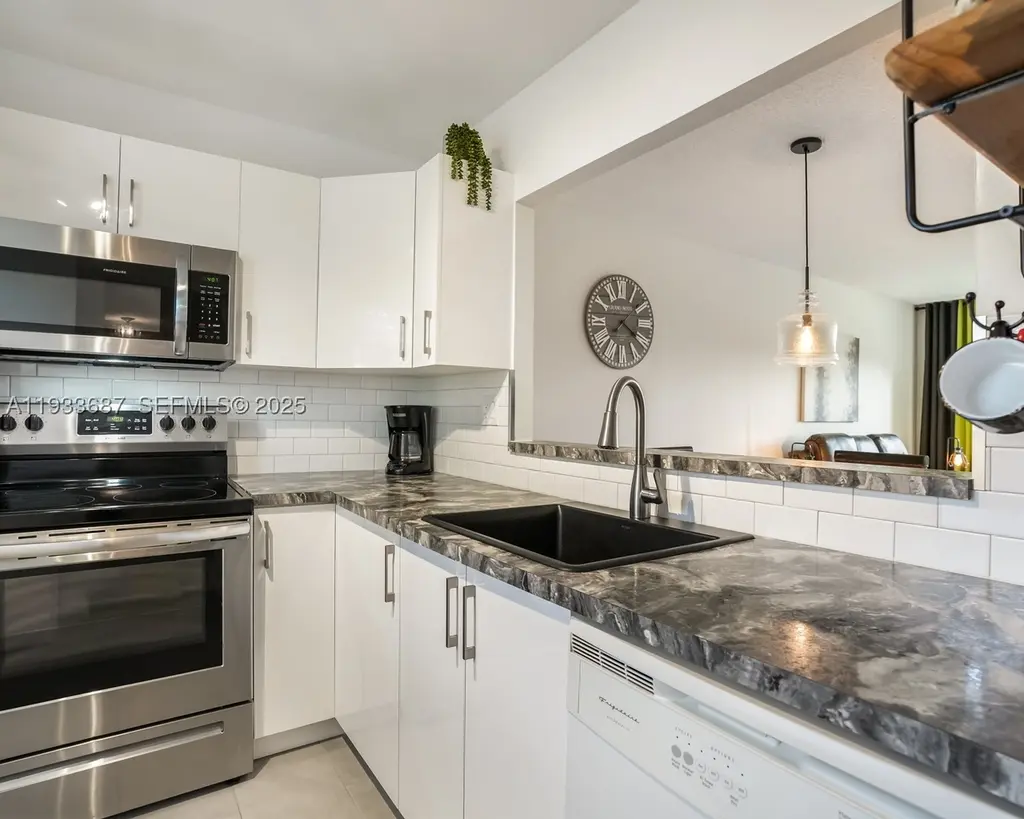
Beautiful 1-bedroom, 1-bath condo offered fully furnished and truly turn-key. Enjoy stunning water views from the unit, creating a peaceful and relaxing atmosphere. The layout is bright and functional, ideal for full-time living or seasonal use. Located in a desirable community with excellent amenities for your enjoyment. Water heater replaced in 2020. A perfect opportunity to own a move-in-ready property in a sought-after setting.
Key facts
- Move-in-ready
- Turn-key
- Fully furnished
Tags
Neighborhood map
What this means for you Summary
Snapshot
- This is a 1-bed/1.0-bath condo listed at $95k.
Deal economics
- At list price, monthly cash flow is $-59 ($-705/yr) — negative.
- To cash-flow at today's rent, offer at most $85k (10.9% below list).
- Meets the 1% rule at list price ($2k rent vs $95k).
- Recommended offer: $85k (10.9% below list) — sets the bar for cash-flow.
Location & tenants
- Location reads 81/100 on livability (#100 in FL, #1,527 nationally) — a professional / high-income tenant draw. Strengths: commute A+, cost of living A+, housing A+; Watch: crime D+, amenities F, employment F.
- Broward (suburban): math 42% / reading 53% proficiency, ranked #46 of 73 in FL (top 63%) — families likely to look elsewhere, expect single-tenant / working-renter base with shorter leases.
- Zoned schools: Park Lakes Elementary School (math 35% / reading 44%, grade F, #1,513 of 2,144 statewide, top 73%, 970 students, 82% FRL); Nova Middle School (math 44% / reading 53%, grade C-, #274 of 571 statewide, top 50%, 1,284 students, 68% FRL); Nova High School (math 22% / reading 56%, grade F, #312 of 667 statewide, top 48%, 2,227 students, 59% FRL) — zoned schools average 70% FRL vs 51% district-wide (19 pts higher); higher-poverty schools than district average — tighter screening recommended.
- Market conditions: Rents soft (-1.4%/yr); 827 active listings in the ZIP; 40 comparable units currently listed for rent nearby; rentals at typical pace (median 19d on market — plan ~3-4 weeks tenant-placement turnaround); 2,111 units permitted in Broward County in 2024 (1,265 in 5+ unit buildings).
- This rent runs 31% of the median local income ($58k/yr) — at the standard rent-burdened threshold; future hikes will face affordability resistance.
Forward outlook
- Local home prices are declining (-3.0%/yr); year-one equity from $657 of loan paydown is wiped out by about $3k of value loss. Plan a longer hold.
- Broward County population projected at +34% by 2050 — long-run rental-demand tailwind backs the buy-and-hold thesis.
Negotiation context
- It's been on market 54 days — a 3% lower offer ($92k) is reasonable based on typical stale-listing flexibility.
- 3 sale attempts since 2y ago with the ask held roughly flat each time — persistent listings suggest the price (not the market) is what's stuck; bring a comps-based counter.
- Current owner paid $58k; list at $95k implies a 62% gain — meaningful room to come down on a strong offer.
Risks & watch-outs
- Watch-outs: HOA is 35% of rent.
- Climate carrying-cost: severe wind risk, 99% chance of damaging wind over 30y; extreme-heat days projected 7→23/yr by 2055 (HVAC capex compounding) — expect insurance premiums to compound above CPI over the hold.
Questions for the listing agent
- What do current leases actually rent for vs. the listed asking? Can we see a recent rent roll and the last 12 months of T-12 income?
- It's been on market 54 days. Have you received any prior offers? Is the seller open to a 11% concession, seller financing, or rate buy-down credit?
- Built in 1975 — when were the roof, HVAC, electrical panel, plumbing, and water heater last replaced?
- What does the HOA fee cover, when was the last increase, and are there any pending special assessments or reserve-fund shortfalls?
- Any open or pending special assessments — roof, HVAC, plumbing, elevator, façade? What's the per-unit balance and payoff schedule, and is the seller paying it off at close or rolling it to the buyer?
- Is there a deadline driving the sale (1031 exchange, divorce, estate, relocation)? That informs how much negotiation room exists.
- Crime grade is D in this area — have there been break-ins, vandalism, or insurance claims at this property in the last 3 years? What carrier currently insures it and at what premium?
- The area grade is low — what's the realistic commute time and amenity access for the typical tenant pool here? Any planned neighborhood developments (good or bad) we should know about?
- What's the average days-on-market for RENTAL listings here right now (not sales)? A rising rental-DOM trend means longer vacancies and softer asking-rent achievability than the comps imply.
- What's the recent tenant-quality profile in this submarket — average credit score on applications, eviction rate, late-payment / NSF rate, and stable-employment percentage? A property-management company in the area should have these aggregated.
- How much new apartment / multifamily construction is in the pipeline within 1–3 miles? Heavy new supply (>2% of stock underway) typically softens rents 12–24 months out; light construction supports rent growth.
Investment metrics
- 1% rule
- 1.60% ✓
- Cap rate
- 5.55%
- Cash-on-cash
- -2.65%
- DSCR
- 0.88
- GRM
- 5.2
CMA / ARV
No comps found within radius.
Projected returns pro-forma
-3.0% appreciation · 0.0% rent growth · sell at horizon
- IRR
- -27.3%
- Equity multiple
- 0.13×
- Total profit
- $-23,205
- Equity at exit
- $14,165
- IRR
- -71.7%
- Equity multiple
- -0.53×
- Total profit
- $-40,669
- Equity at exit
- $8,214
Cash invested: $26,600 (down + closing). Projections, not guarantees.
Landlord ↔ Tenant lean methodology
- Overall (STATE)
- 87 Strongly Landlord-Friendly
- State Florida
- 87 Strongly Landlord-Friendly · R+3
- County
- — inherits STATE
- City
- — inherits STATE
ZIP-level market 33319
- Rents YoY
- -1.4%
- Active inventory
- 827
- Price-to-rent
- 5.2×
Monthly cashflow live
- Estimated rent
- $1,523 high interval (Pro) →
- Mortgage (P&I)
- −$498
- Tax from tax record
- −$187 /mo · $2,244/yr
- Insurance
- −$40
- HOA
- −$537
- Vacancy / Maint / Mgmt
- −$320
- Net cashflow
- $-59
Break-even live
Sensitivity live
| Price | -10% $-5 | -5% $-32 | +0% $-59 | +5% $-86 | +10% $-113 |
|---|---|---|---|---|---|
| Rent | -10% $-179 | -5% $-119 | +0% $-59 | +5% $1 | +10% $62 |
| Rate | -1.0pp $-11 | -0.5pp $-35 | base $-59 | +0.5pp $-83 | +1.0pp $-108 |
UW: 25.0% down · 7.5% · 30yr · 1.5% tax · 5.0% vac · 8.0% maint · 8.0% mgmt
Financing live
Cash to close
- Down payment
- $23,750
- Closing costs
- $2,850
- Reserves months
- —
- Total cash needed
- —
Loan-product check · same deal, 3 products live
Conventional
25% down · 7.5% · 30yr
- Down + closing
- —
- Monthly P&I
- —
- Monthly cashflow
- —
- DSCR
- —
- Eligible?
- —
Personal DTI + credit; lowest rate.
DSCR
20% down · 8.5% · 30yr
- Down + closing
- —
- Monthly P&I
- —
- Monthly cashflow
- —
- DSCR
- —
- Eligible?
- —
No personal income docs; deal must DSCR.
Hard money
10% down · 12.0% · 12mo
- Down + closing
- —
- Monthly P&I
- —
- Monthly cashflow
- —
- DSCR
- —
- Eligible?
- —
Short-term bridge; refi at stabilization.
Rent comps 40 comps
| Address | Beds | Baths | Sqft | Rent | $/sqft | DOM | Units | Dist |
|---|---|---|---|---|---|---|---|---|
| 3460 NW 50th Ave Lauderdale Lakes, FL | 1.0–2.0 | 1.0–2.0 | 750 | $1,499 | $2.00 | 18d | 3 | 0.28mi |
| 3531 NW 50th Ave #609 Lauderdale Lakes, FL | 1.0 | 1.0 | 684 | $1,350 | $1.97 | 26d | 1 | 0.31mi |
| 3301 NW 47th Ter #308 Lauderdale Lakes, FL | 1.0 | 2.0 | 750 | $2,200 | $2.93 | 14d | 1 | 0.31mi |
| 3161 NW 47th Ter #110 Lauderdale Lakes, FL | 1.0 | 1.5 | 721 | $1,500 | $2.08 | 7d | 1 | 0.47mi |
| 3161 NW 47th Ter #111 Lauderdale Lakes, FL | 1.0 | 1.5 | 721 | $1,500 | $2.08 | 26d | 1 | 0.47mi |
| 3141 NW 47th Ter Lauderdale Lakes, FL | 1.0–2.0 | 1.5–2.0 | 861 | $1,440 | $1.67 | 26d | 2 | 0.48mi |
| 5031 W Oakland Park Blvd Lauderdale Lakes, FL | 1.0 | 1.0 | 683 | $1,400 | $2.05 | 12d | 2 | 0.51mi |
| 5021 W Oakland Park Blvd Lauderdale Lakes, FL | 1.0 | 1.0 | 684 | $1,550 | $2.27 | 19d | 2 | 0.54mi |
| 2901 NW 47th Ter Unit 247B Lauderdale Lakes, FL | 1.0 | 1.5 | 662 | $1,400 | $2.11 | 0d | 1 | 0.61mi |
| 2901 NW 47th Ter Unit 348B Lauderdale Lakes, FL | 1.0 | 1.5 | 662 | $1,350 | $2.04 | 26d | 1 | 0.61mi |
| 3061 NW 47th Ter Unit 335B Lauderdale Lakes, FL | 1.0 | 1.5 | 662 | $1,500 | $2.27 | 0d | 1 | 0.61mi |
| 3061 NW 47th Ter Unit 132C Lauderdale Lakes, FL | 1.0 | 1.0 | 610 | $1,500 | $2.46 | 26d | 1 | 0.61mi |
| 3061 NW 47th Ter Unit 327B Lauderdale Lakes, FL | 1.0 | 1.5 | 662 | $1,600 | $2.42 | 9d | 1 | 0.61mi |
| 3061 NW 47th Ter #327 Lauderdale Lakes, FL | 1.0 | 1.5 | 662 | $1,500 | $2.27 | 26d | 1 | 0.61mi |
| 3001 NW 48th Ave #440 Lauderdale Lakes, FL | 1.0 | 1.5 | 705 | $1,300 | $1.84 | 26d | 1 | 0.62mi |
| 3030 NW 43rd Ter #102 Lauderdale Lakes, FL | 1.0 | 1.0 | 710 | $1,450 | $2.04 | 26d | 1 | 0.66mi |
| 3030 NW 43rd Ter Lauderdale Lakes, FL | 1.0 | 1.0 | 592 | $1,400 | $2.36 | 0d | 2 | 0.66mi |
| 3030 NW 43rd Ter Lauderdale Lakes, FL | 1.0 | 1.0 | 592 | $1,400 | $2.36 | 4d | 2 | 0.66mi |
| 3033 NW 43rd Ave #108 Lauderdale Lakes, FL | 1.0 | 1.0 | 650 | $1,590 | $2.45 | 15d | 1 | 0.68mi |
| 4851 NW 26th Ct #338 Lauderdale Lakes, FL | 1.0 | 1.0 | 705 | $1,650 | $2.34 | 18d | 1 | 0.84mi |
| 3720 Inverrary Dr Lauderhill, FL | 3.0 | 1.0–2.0 | 940 | $1,600 | $1.70 | 12d | 5 | 0.89mi |
| 4174 Inverrary Dr #907 Lauderhill, FL | 1.0 | 1.0 | 675 | $1,500 | $2.22 | 26d | 1 | 0.90mi |
| 4141 NW 26th St #316 Lauderhill, FL | 1.0 | 1.0 | 624 | $1,450 | $2.32 | 26d | 1 | 0.93mi |
| 4121 NW 26th St Unit T16 Lauderhill, FL | 1.0 | 1.5 | 750 | $1,500 | $2.00 | 26d | 1 | 0.95mi |
| 3760 Inverrary Dr Lauderhill, FL | 2.0 | 1.0–2.0 | 800 | $1,725 | $2.16 | 7d | 3 | 1.04mi |
| 3760 Inverrary Dr Unit 3M Lauderhill, FL | — | 1.0 | 450 | $1,800 | $4.00 | 26d | 1 | 1.06mi |
| 2800 NW 56th Ave Lauderhill, FL | 1.0–2.0 | 1.0–2.0 | 847 | $1,175 | $1.39 | 26d | 8 | 1.10mi |
| 2800 NW 56th Ave Lauderhill, FL | 1.0–2.0 | 1.0–2.0 | 847 | $1,480 | $1.75 | 17d | 6 | 1.10mi |
| 2800 NW 56th Ave Lauderhill, FL | 1.0–2.0 | 1.0–2.0 | 847 | $1,250 | $1.48 | 24d | 7 | 1.10mi |
| 2800 NW 56th Ave Lauderhill, FL | 1.0–3.0 | 1.0–2.0 | 965 | $1,250 | $1.30 | 0d | 8 | 1.10mi |
| 2800 NW 56th Ave Lauderhill, FL | 1.0–2.0 | 1.0–2.0 | 847 | $1,250 | $1.48 | 6d | 8 | 1.10mi |
| 3541 NW 30th Pl Lauderdale Lakes, FL | 1.0–3.0 | 1.0–2.0 | 865 | $1,739 | $2.01 | 0d | 16 | 1.11mi |
| 3650 Inverrary Dr Lauderhill, FL | 1.0 | 1.0–1.5 | 610 | $1,570 | $2.57 | 4d | 3 | 1.13mi |
| 3650 Inverrary Dr Lauderhill, FL | 1.0 | 1.0–1.5 | 610 | $1,570 | $2.57 | 15d | 3 | 1.13mi |
| 3670 Inverrary Dr Lauderhill, FL | 1.0 | 1.0–1.5 | 650 | $1,600 | $2.46 | 9d | 3 | 1.20mi |
| 3670 Inverrary Dr Lauderhill, FL | 1.0 | 1.0–1.5 | 650 | $1,450 | $2.23 | 16d | 2 | 1.20mi |
| 3680 Inverrary Dr Unit 2M Lauderhill, FL | — | 1.0 | 420 | $1,300 | $3.10 | 26d | 1 | 1.23mi |
| 3660 Inverrary Dr Lauderhill, FL | 1.0 | 1.0–1.5 | 725 | $1,799 | $2.48 | 19d | 2 | 1.27mi |
| 3660 Inverrary Dr Lauderhill, FL | 1.0 | 1.0–1.5 | 725 | $1,799 | $2.48 | 9d | 3 | 1.27mi |
| 2070 NW 43rd Ter #6 Lauderhill, FL | 1.0 | 1.0 | 600 | $1,600 | $2.67 | 24d | 1 | 1.31mi |
HOA detail condo
- Monthly dues
- $537 · $6,444/yr
- Likely covers
- water
- Assessments
- None detected in remarks — confirm with the listing agent.
Listing history 11 events
-
2026-02-11status Pending
-
2025-12-19$95,000 Active
-
2025-10-29historical
-
2025-07-29$109,900 Active
-
2025-07-01historical
-
2025-03-10price $114,900
-
2024-12-21$117,000 Active
-
2021-01-20soldstatus $58,500
-
2010-04-12soldstatus $42,000
-
2000-05-09soldstatus $20,500
-
1974-03-01soldstatus $23,000
ⓘ Source: listings_history table (triggers on properties + properties_extension) + one-shot
backfill from property_details.listing_events for pre-trigger history.
Tax reassessment forecast FL · Resets to sale price
- Current annual tax
- $2,244 · $187/mo
- Projected year-2 tax
- $2,244 · $187/mo
- Expected delta
- $0/yr ($0/mo · 0.0%)
ⓘ Screening estimate from a state-policy table — verify with the county assessor before closing.
Climate risk First Street
- Flood 1/10 Low FEMA zone X (shaded) · 0% chance over 30 yrs
- Wildfire 1/10 Low
- Heat 9/10 Extreme 7 d/yr ≥105°F today · 23 d/yr by 30 yrs out
- Wind 10/10 Extreme 99% chance of damaging wind over 30 yrs
- Air quality 3/10 Moderate 3 unhealthy d/yr today · 3 by 30 yrs out
Nearby sold comps map
Loading sold comps map…
Walkable amenities ~0.75 mi
Loading nearby amenities…
Taxation est. · year 1
- Rental income
- $18,273
- − Mortgage interest
- −$5,321
- − Property taxes
- −$2,244
- − Insurance
- −$475
- − Repairs & maintenance
- −$1,462
- − Management
- −$1,462
- − HOA
- −$6,444
- − Depreciation
- −$2,764
- Taxable loss
- −$1,898
- Est. tax savings @ 24.0%
- +$456
- After-tax cash flow
- $-250/yr
For passive investors: Depreciation is non-cash, so a rental often shows a tax loss while cash-flowing — sheltering income. Rental losses are passive: they offset passive income freely, and up to $25,000/yr can offset ordinary (W-2) income if you actively participate and your MAGI is under $100k (phasing out to $0 by $150k); unused losses carry forward. On sale, claimed depreciation is recaptured at up to 25%, and gains may owe capital-gains tax (a 1031 exchange can defer both). Figures are a year-1 estimate at your 24.0% rate — not tax advice; consult a CPA.
Schools (NCES district)
- District
- Broward
- NCES district ID
- 1200180
- Math proficiency
- 42% ▼ -18.00%
- Reading proficiency
- 53% ▼ -5.00%
- Median HH income
- $52,139
- Composite
- 40.88/100
- National rank
- #3621
- State rank
- #46 of 73 in FL
Livability — Lauderdale Lakes
- Score
- 81/100
- State rank
- #100
- US rank
- #1527
Category grades
Schools grade is shown separately in the Schools card above.
Census & demographics
- Census place
- Lauderdale Lakes, FL
- County
- Broward County · 1,963,430 people
- Metro
- Miami-Fort Lauderdale-Pompano Beach, FL
- Population (ZIP)
- 54,450
- Household income
- $58,388
- Rent vs Own
- Severe rent burden
- 2809.0
Population outlook (Broward County) Hauer SSP2
- Today (2025)
- 2,207,033 people
- By 2030
- 2,360,704 · +7.0%
- By 2040
- 2,661,208 · +20.6%
- By 2050
- 2,946,698 · +33.5%
- By 2075
- 3,602,273 · +63.2%
- By 2100
- 3,970,984 · +79.9%
Race, ethnicity, and origin ACS 2023
- Neighborhood character
- Diverse neighborhood (Simpson 0.58)
- Race & ethnicity
- Black 61% Hispanic / Latino 17% White 15% Two or more races 11% Asian 4%
- Hispanic origin (detail)
- Puerto Rican 4% Cuban 2% Dominican 1%
- Common ancestry
- Hispanic 13% Romanian 1% Italian 1%
- Foreign-born
- 46% · Canada, Jamaica, Vietnam
- Languages at home
- 64% English-only · Spanish 15% French/Haitian/Cajun 15% Other Indo-European 2%
Political lean MEDSL · Broward
- 2024 margin
- D (+17.0) · D 58.0% · R 41.0%
- 2008→2024 swing
- -17.8pp toward R · 2008: 34.7pp · 2024: 17.0pp
- All cycles
- 2024: D+17.0 2020: D+29.8 2016: D+35.0 2012: D+34.9 2008: D+34.7
Not yet ingested
- Civics
- —
Market trends
- HPI YoY
- ▼ -202.84%
- Current HPI
- 328.4307
- Rent YoY
- ▼ -1.38%
- Metro
- Miami-Fort Lauderdale-Pompano Beach, FL
- State GDP YoY
- ▲ 3.28%
- F500 in state
- 36
Industry mix (Fortune 500 HQ in FL)
| Industry | F500 HQs | Revenue |
|---|---|---|
| Industrial Technology | 2 | $29B |
|
||
| Insurance | 2 | $17B |
|
||
| Retail | 1 | $60B |
|
||
| Technology Distribution | 1 | $58B |
|
||
| Homebuilding | 1 | $35B |
|
||
| Technology Manufacturing | 1 | $35B |
|
||
Price history
+313.0% since first listed11 events — show timeline
- 2026-02-11 Pending — MARMLS
- 2025-12-19 Listed $95,000 MARMLS
- 2025-10-29 Listing Removed — MARMLS
- 2025-07-29 Listed $109,900 MARMLS
- 2025-07-01 Listing Removed — MARMLS
- 2025-03-10 Price Changed $114,900 MARMLS
- 2024-12-21 Listed $117,000 MARMLS
- 2021-01-20 Sold (Public Records) $58,500 Public Records
- 2010-04-12 Sold (Public Records) $42,000 Public Records
- 2000-05-09 Sold (Public Records) $20,500 Public Records
- 1974-03-01 Sold (Public Records) $23,000 Public Records
Property tax history
+3.9%/yrLatest (2025): $2,244 · +8.5% YoY. Source: county tax records.
Cash-flow waterfall
monthlySold comps — $/sqft
last 12 mo · ≤1 miLoading sold comps…