 Multi-family
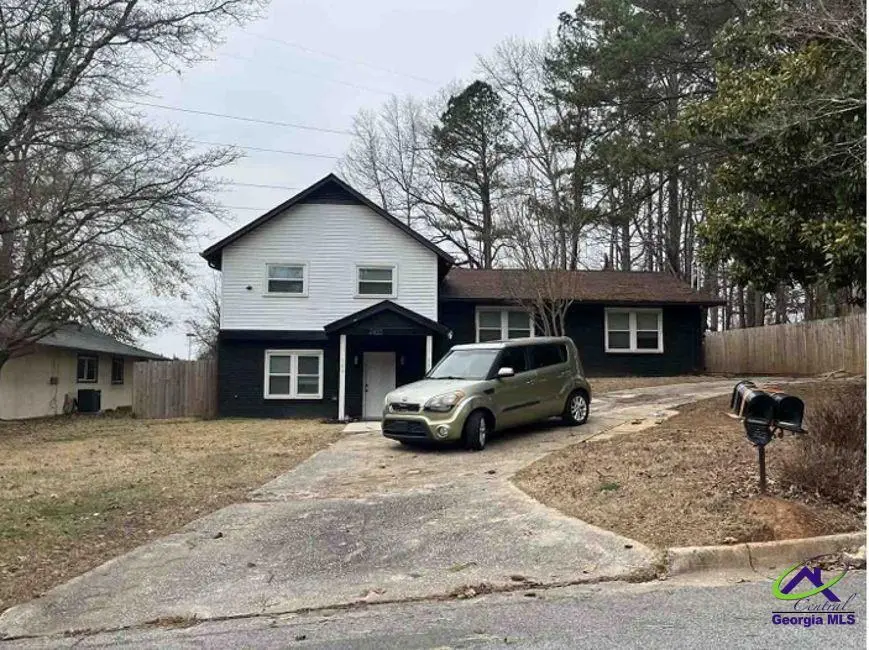
2455 Mcalpin Ter · East Point, GA
Flood risk 1/10 · Minimal
- FEMA flood zone
- X (unshaded)
- Chance of flooding over 30 yrs
- 0.0%
- Est. flood insurance / yr
- $473 – $860
Fire risk 1/10 · Minimal
- Est. fire insurance / yr
- $963 – $1,789
Heat risk 6/10 · Moderate
- Hot days now (above 103°F)
- 7 days/yr
- Hot days in 30 yrs
- 19 days/yr
Wind risk 6/10 · Moderate
- Chance of severe wind over 30 yrs
- 27.0%
Air-quality risk 3/10 · Minor
- Unhealthy air days now
- 3 days/yr
- Unhealthy air days in 30 yrs
- 3 days/yr
Risk factors via First Street. Map © Google.
Why this score? — see what drove the C grade
The composite is a weighted blend of 9 inputs, each scored 0–100. Each bar is that input's sub-score; the figure is the points it added to the 100-point composite (weight × sub-score).
- Cash flow +19.2/30.0
- ARV discount +15.0/15.0
- DSCR +6.1/10.0
- 1% rule +5.2/10.0
- Schools +4.5/10.0
- Livability +3.6/5.0
- Rent growth +2.8/5.0
- Condition / age +2.5/5.0
- Appreciation +0.0/10.0
$207,700
🖨 Deal sheet (PDF) 📄 Offer letter ✓ Due diligence
Multi-family units
County records classify this as Multi-Family (2-4 Unit). Listing-text estimate: 1 unit. estimate disagrees with records
Listing remarks MLS
Brick duplex with recent updates conveniently located near Greenbriar Mall, public transportation, and interstates. Great cash flow potential and low maintenance! Unit to the left is a 2 bed/1.5 bath townhouse style unit with large kitchen, and private backyard space. Unit to the right is a 2 bed/1 bath flat with hardwood floors, spacious kitchen, and easy access to backyard. Lots of parking. Situated on private culde-sac street.
Key facts
- 0.3 acre lot
- Built 1964
- Listed 41 days
Property features AI
Exterior
- Parking: No garage
- Utilities: Sewer: unknown
- Home design: Single-family residence; Residential property; Brick construction
- Construction: Brick construction; One and one-half story
- Exterior features: Lot approximately 0.3 acres (13,068 sq ft)
Interior
- Bathrooms: 2 full bathrooms; 1 half bathroom
- Heating & cooling: Heating present (see remarks)
- Interior features: Has heating (details: see remarks); One and one-half levels
Neighborhood map
What this means for you Summary
Snapshot
- This is a 4-bed/2.5-bath multifamily listed at $208k.
Deal economics
- At list price, monthly cash flow is $225 ($3k/yr) — positive.
- The deal already cash-flows at list — no discount required.
- Meets the 1% rule at list price ($2k rent vs $208k).
- Recommended offer: $201k (3.0% below list) — sets the bar for market timing.
- Cap rate 7.6% vs local median 5.1% in East Point — top-decile yield for the area; either an underpriced asset or a hidden risk that comps aren't pricing in. Stress-test before assuming the spread holds.
Location & tenants
- Location reads 72/100 on livability (#72 in GA) — a middle-class / working-renter tenant base. Strengths: commute A+, cost of living A+, housing A+; Watch: employment D+, crime F, amenities F.
- Fulton County (suburban): math 49% / reading 53% proficiency, ranked #12 of 174 in GA (top 7%) — acceptable for families but not a draw, mixed tenant base, ~2y average lease.
- Zoned schools: Amana Academy School (math 47% / reading 52%, grade D, #264 of 1,228 statewide, top 23%, 731 students, 30% FRL, charter); Paul D. West Middle School (math 17% / reading 17%, grade F, #381 of 470 statewide, top 82%, 803 students, 100% FRL); Tri-Cities High School (math 5% / reading 30%, grade F, #264 of 424 statewide, top 63%, 1,483 students, 100% FRL) — zoned schools average 77% FRL vs 41% district-wide (35 pts higher); higher-poverty schools than district average — tighter screening recommended.
- Zoned-school proficiency averages 28% at this address vs 51% district-wide (-23 pts) — the specific schools serving this property underperform the Fulton County average; the district grade overstates school quality for this exact location.
- Market conditions: Rents rising (+1.4%/yr); 295 active listings in the ZIP; 40 comparable units currently listed for rent nearby; rentals at typical pace (median 26d on market — plan ~3-4 weeks tenant-placement turnaround); 11,565 units permitted in Fulton County in 2024 (8,159 in 5+ unit buildings).
- This rent runs 37% of the median local income ($68k/yr) — at the standard rent-burdened threshold; future hikes will face affordability resistance.
Forward outlook
- Local home prices are declining (-3.0%/yr); year-one equity from $1k of loan paydown is wiped out by about $6k of value loss. Plan a longer hold.
- Fulton County population projected at +38% by 2050 — long-run rental-demand tailwind backs the buy-and-hold thesis.
Negotiation context
- It's been on market 41 days — a 3% lower offer ($201k) is reasonable based on typical stale-listing flexibility.
- 6 sale attempts since 15y ago with the ask held roughly flat each time — persistent listings suggest the price (not the market) is what's stuck; bring a comps-based counter.
Risks & watch-outs
- Climate carrying-cost: major wind risk, 27% chance of damaging wind over 30y; extreme-heat days projected 7→19/yr by 2055 (HVAC capex compounding) — expect insurance premiums to compound above CPI over the hold.
Questions for the listing agent
- It's been on market 41 days. Have you received any prior offers? Is the seller open to a 3% concession, seller financing, or rate buy-down credit?
- Built in 1964 — when were the roof, HVAC, electrical panel, plumbing, and water heater last replaced?
- Is there a deadline driving the sale (1031 exchange, divorce, estate, relocation)? That informs how much negotiation room exists.
- Schools are F-rated, which usually means shorter tenancies and higher turnover. Who's the typical renter profile here, and what's been the actual vacancy rate?
- Crime grade is F in this area — have there been break-ins, vandalism, or insurance claims at this property in the last 3 years? What carrier currently insures it and at what premium?
- What's the average days-on-market for RENTAL listings here right now (not sales)? A rising rental-DOM trend means longer vacancies and softer asking-rent achievability than the comps imply.
- What's the recent tenant-quality profile in this submarket — average credit score on applications, eviction rate, late-payment / NSF rate, and stable-employment percentage? A property-management company in the area should have these aggregated.
- How much new apartment / multifamily construction is in the pipeline within 1–3 miles? Heavy new supply (>2% of stock underway) typically softens rents 12–24 months out; light construction supports rent growth.
Investment metrics
- 1% rule
- 1.02% ✓
- Cap rate
- 7.59%
- Cash-on-cash
- 4.63%
- DSCR
- 1.21
- GRM
- 8.2
CMA / ARV
- ARV (median comp)
- $353,619
- List price
- $207,700
- Delta
- -41.26%
- Verdict
- UNDERPRICED
- Comps
- 20 within 1.0 mi
Projected returns pro-forma
-3.0% appreciation · 1.35% rent growth · sell at horizon
- IRR
- -10.9%
- Equity multiple
- 0.61×
- Total profit
- $-22,770
- Equity at exit
- $30,969
- IRR
- -4.2%
- Equity multiple
- 0.74×
- Total profit
- $-14,975
- Equity at exit
- $17,958
Cash invested: $58,156 (down + closing). Projections, not guarantees.
Landlord ↔ Tenant lean methodology
- Overall (STATE)
- 90 Strongly Landlord-Friendly
- State Georgia
- 90 Strongly Landlord-Friendly · R+3
- County
- — inherits STATE
- City
- — inherits STATE
ZIP-level market 30344
- Home prices YoY
- -31.0%
- Rents YoY
- 1.4%
- Active inventory
- 295
- Price-to-rent
- 8.2×
Monthly cashflow live
- Estimated rent
- $2,118 high interval (Pro) →
- Mortgage (P&I)
- −$1,089
- Tax from tax record
- −$273 /mo · $3,273/yr
- Insurance
- −$87
- HOA
- −$0
- Vacancy / Maint / Mgmt
- −$445
- Net cashflow
- $225
Break-even live
Sensitivity live
| Price | -10% $342 | -5% $283 | +0% $225 | +5% $166 | +10% $107 |
|---|---|---|---|---|---|
| Rent | -10% $57 | -5% $141 | +0% $225 | +5% $308 | +10% $392 |
| Rate | -1.0pp $329 | -0.5pp $277 | base $225 | +0.5pp $171 | +1.0pp $116 |
UW: 25.0% down · 7.5% · 30yr · 1.5% tax · 5.0% vac · 8.0% maint · 8.0% mgmt
Financing live
Cash to close
- Down payment
- $51,925
- Closing costs
- $6,231
- Reserves months
- —
- Total cash needed
- —
Loan-product check · same deal, 3 products live
Conventional
25% down · 7.5% · 30yr
- Down + closing
- —
- Monthly P&I
- —
- Monthly cashflow
- —
- DSCR
- —
- Eligible?
- —
Personal DTI + credit; lowest rate.
DSCR
20% down · 8.5% · 30yr
- Down + closing
- —
- Monthly P&I
- —
- Monthly cashflow
- —
- DSCR
- —
- Eligible?
- —
No personal income docs; deal must DSCR.
Hard money
10% down · 12.0% · 12mo
- Down + closing
- —
- Monthly P&I
- —
- Monthly cashflow
- —
- DSCR
- —
- Eligible?
- —
Short-term bridge; refi at stabilization.
Rent comps 40 comps
| Address | Beds | Baths | Sqft | Rent | $/sqft | DOM | Units | Dist |
|---|---|---|---|---|---|---|---|---|
| 2675 Headland Dr Atlanta, GA | 3.0 | 2.0 | 1408 | $1,600 | $1.14 | 19d | 1 | 0.58mi |
| 2275 Country Club Ln SW Atlanta, GA | 5.0 | 3.0 | 2198 | $3,100 | $1.41 | 20d | 1 | 0.68mi |
| 2909 Campbellton Rd SW Atlanta, GA | 1.0–3.0 | 1.0–2.0 | 917 | $1,299 | $1.42 | 26d | 1 | 0.78mi |
| 2250 Dodson Dr Atlanta, GA | 4.0 | 2.0 | 1522 | $4,200 | $2.76 | 45d | 1 | 0.79mi |
| 3369 Dale Ln SW Atlanta, GA | 5.0 | 3.0 | 1400 | $2,400 | $1.71 | 23d | 1 | 0.85mi |
| 3138 Imperial Cir SW Atlanta, GA | 3.0 | 3.0 | 2210 | $2,250 | $1.02 | 26d | 1 | 0.87mi |
| 3488 Cardinal Dr SW Atlanta, GA | 3.0 | 2.5 | 1421 | $2,100 | $1.48 | 26d | 1 | 0.92mi |
| 3503 Parc Cir SW Atlanta, GA | 3.0 | 2.5 | 1742 | $1,850 | $1.06 | 26d | 1 | 0.93mi |
| 2684 Toucan Way SW Atlanta, GA | 3.0 | 2.5 | 1652 | $2,350 | $1.42 | 26d | 1 | 0.97mi |
| 3477 Meadowlane Pl SW Atlanta, GA | 3.0 | 2.0 | 2182 | $2,350 | $1.08 | 26d | 1 | 0.97mi |
| 3560 Eagle Ct SW Atlanta, GA | 3.0 | 2.5 | 1480 | $1,995 | $1.35 | 9d | 1 | 0.99mi |
| 2589 Coventry St SW Atlanta, GA | 3.0 | 2.5 | 1421 | $1,995 | $1.40 | 26d | 2 | 0.99mi |
| 3596 Raven Way Atlanta, GA | 3.0 | 2.5 | 1421 | $1,965 | $1.38 | 26d | 1 | 1.02mi |
| 2523 Ben Hill Rd Atlanta, GA | 3.0 | 1.5 | 1412 | $3,000 | $2.12 | 23d | 1 | 1.03mi |
| 2610 Harmony Way Atlanta, GA | 3.0 | 1.0 | 1100 | $1,095 | $1.00 | 26d | 1 | 1.04mi |
| 2311 Cherry Blossom Dr SW Atlanta, GA | 3.0 | 2.0 | 1311 | $1,750 | $1.33 | 26d | 1 | 1.04mi |
| 2900 Landrum Dr SW Atlanta, GA | 2.0–3.0 | 2.0 | 1045 | $1,472 | $1.41 | 19d | 6 | 1.07mi |
| 2467 Calvin Ave Atlanta, GA | 3.0 | 2.0 | 1200 | $1,950 | $1.62 | 26d | 1 | 1.09mi |
| 3333 Cascade Parc Blvd SW Atlanta, GA | 3.0 | 2.5 | 1830 | $2,800 | $1.53 | 26d | 1 | 1.13mi |
| 2535 Rex Ave SW Atlanta, GA | 3.0 | 2.0 | 1443 | $1,850 | $1.28 | 26d | 1 | 1.13mi |
| 2514 Riggs Dr Atlanta, GA | 4.0 | 2.0 | 1274 | $2,000 | $1.57 | 45d | 1 | 1.16mi |
| 2658 Rolling Brook Trl Atlanta, GA | 3.0 | 2.0 | 1754 | $1,850 | $1.05 | 45d | 1 | 1.19mi |
| 2750 Barge Rd SW Atlanta, GA | 1.0–3.0 | 1.0–2.0 | 986 | $2,371 | $2.40 | 0d | 51 | 1.19mi |
| 2764 Riggs Dr Atlanta, GA | 3.0 | 2.0 | 1147 | $2,050 | $1.79 | 45d | 1 | 1.28mi |
| 2511 Susan Ln SW Atlanta, GA | 3.0 | 2.0 | 1277 | $1,625 | $1.27 | 0d | 1 | 1.28mi |
| 3638 Barrow Pl SW Atlanta, GA | 3.0 | 2.0 | 1200 | $1,695 | $1.41 | 26d | 1 | 1.29mi |
| 3433 Cascade Parc Blvd SW Atlanta, GA | 3.0 | 2.5 | 1682 | $2,500 | $1.49 | 26d | 1 | 1.30mi |
| 1821 Sandringham Dr SW Atlanta, GA | 3.0 | 2.0 | 1540 | $2,100 | $1.36 | 20d | 1 | 1.31mi |
| 2284 Headland Dr Atlanta, GA | 3.0 | 3.5 | 1117 | $1,502 | $1.34 | 14d | 1 | 1.31mi |
| 1788 Dodson Dr SW Atlanta, GA | 3.0 | 2.0 | 1212 | $1,950 | $1.61 | 15d | 1 | 1.33mi |
| 1788 Dodson Dr SW Atlanta, GA | 3.0 | 2.0 | 1212 | $1,950 | $1.61 | 0d | 1 | 1.33mi |
| 3596 Indian Rock Rd SW Atlanta, GA | 3.0 | 1.5 | 1198 | $2,000 | $1.67 | 5d | 1 | 1.33mi |
| 1994 Bent Creek Way SW Atlanta, GA | 1.0–3.0 | 1.0–2.0 | 1041 | $1,455 | $1.40 | 9d | 1 | 1.35mi |
| 2560 Wood Valley Dr Atlanta, GA | 4.0 | 2.5 | 1141 | $1,900 | $1.67 | 19d | 1 | 1.36mi |
| 2560 Wood Valley Dr Atlanta, GA | 4.0 | 2.5 | 1141 | $1,900 | $1.67 | 26d | 1 | 1.36mi |
| 1736 Devon Dr SW Atlanta, GA | 3.0 | 2.5 | 1354 | $2,000 | $1.48 | 26d | 1 | 1.37mi |
| 2801 Ridgeview Dr SW Atlanta, GA | 3.0 | 3.0 | 1588 | $2,500 | $1.57 | 20d | 1 | 1.42mi |
| 2756 Plantation Dr Atlanta, GA | 3.0 | 2.0 | 1119 | $1,950 | $1.74 | 22d | 1 | 1.44mi |
| 3211 Flamingo Dr Atlanta, GA | 3.0 | 2.0 | 1485 | $1,900 | $1.28 | 45d | 1 | 1.47mi |
| 2400 Campbellton Rd SW Atlanta, GA | 2.0–3.0 | 1.5–2.5 | 1237 | $1,450 | $1.17 | 18d | 3 | 1.49mi |
Listing history 32 events
-
2026-06-21days on market $207,700 Active 41 DOM
-
2026-06-18days on market $207,700 Active 38 DOM
-
2026-06-17days on market $207,700 Active 37 DOM
-
2026-06-16days on market $207,700 Active 36 DOM
-
2026-06-15days on market $207,700 Active 35 DOM
-
2026-06-13days on market $207,700 Active 33 DOM
-
2026-06-09days on market $207,700 Active 29 DOM
-
2026-06-08days on market $207,700 Active 28 DOM
-
2026-06-07days on market $207,700 Active 27 DOM
-
2026-06-04days on market $207,700 Active 24 DOM
-
2026-06-03days on market $207,700 Active 23 DOM
-
2026-06-01days on market $207,700 Active 21 DOM
-
2026-05-31days on market $207,700 Active 20 DOM
-
2026-05-11$207,700 Active 245-char remark
-
2022-10-18soldstatus $275,000 Closed 434-char remark
Show marketing remark (433 chars)
Brick duplex with recent updates conveniently located near Greenbriar Mall, public transportation, and interstates. Great cash flow potential and low maintenance! Unit to the left is a 2 bed/1.5 bath townhouse style unit with large kitchen, and private backyard space. Unit to the right is a 2 bed/1 bath flat with hardwood floors, spacious kitchen, and easy access to backyard. Lots of parking. Situated on private culde-sac street.
-
2022-10-18soldstatus $275,000 Sold
Show marketing remark (433 chars)
Brick duplex with recent updates conveniently located near Greenbriar Mall, public transportation, and interstates. Great cash flow potential and low maintenance! Unit to the left is a 2 bed/1.5 bath townhouse style unit with large kitchen, and private backyard space. Unit to the right is a 2 bed/1 bath flat with hardwood floors, spacious kitchen, and easy access to backyard. Lots of parking. Situated on private culde-sac street.
-
2022-07-18status Under Contract
Show marketing remark (434 chars)
Brick duplex with recent updates conveniently located near Greenbriar Mall, public transportation, and interstates. Great cash flow potential and low maintenance! Unit to the left is a 2 bed/1.5 bath townhouse style unit with large kitchen, and private backyard space. Unit to the right is a 2 bed/1 bath flat with hardwood floors, spacious kitchen, and easy access to backyard. Lots of parking. Situated on private culde-sac street.
-
2022-07-18historical Active Under Contract 434-char remark
Show marketing remark (434 chars)
Brick duplex with recent updates conveniently located near Greenbriar Mall, public transportation, and interstates. Great cash flow potential and low maintenance! Unit to the left is a 2 bed/1.5 bath townhouse style unit with large kitchen, and private backyard space. Unit to the right is a 2 bed/1 bath flat with hardwood floors, spacious kitchen, and easy access to backyard. Lots of parking. Situated on private culde-sac street.
-
2022-07-13$250,000 Active 434-char remark
Show marketing remark (433 chars)
Brick duplex with recent updates conveniently located near Greenbriar Mall, public transportation, and interstates. Great cash flow potential and low maintenance! Unit to the left is a 2 bed/1.5 bath townhouse style unit with large kitchen, and private backyard space. Unit to the right is a 2 bed/1 bath flat with hardwood floors, spacious kitchen, and easy access to backyard. Lots of parking. Situated on private culde-sac street.
-
2022-07-13$250,000 New
Show marketing remark (433 chars)
Brick duplex with recent updates conveniently located near Greenbriar Mall, public transportation, and interstates. Great cash flow potential and low maintenance! Unit to the left is a 2 bed/1.5 bath townhouse style unit with large kitchen, and private backyard space. Unit to the right is a 2 bed/1 bath flat with hardwood floors, spacious kitchen, and easy access to backyard. Lots of parking. Situated on private culde-sac street.
-
2022-07-11status Back On Market
-
2022-07-11historical
-
2021-10-05status Under Contract
-
2021-07-22status Under Contract
-
2021-07-14$225,000 New
-
2011-03-28soldstatus $43,800
-
2011-03-23soldstatus $43,750 Sold
-
2011-03-01historical
-
2011-02-15price $49,900 Reduced
-
2011-02-14price $49,900
-
2011-01-18$55,000 Active
-
1978-09-01soldstatus $48,000
ⓘ Source: listings_history table (triggers on properties + properties_extension) + one-shot
backfill from property_details.listing_events for pre-trigger history.
Tax reassessment forecast GA · Resets to sale price
- Current annual tax
- $3,273 · $273/mo
- Projected year-2 tax
- $3,273 · $273/mo
- Expected delta
- $0/yr ($0/mo · 0.0%)
ⓘ Screening estimate from a state-policy table — verify with the county assessor before closing.
Climate risk First Street
- Flood 1/10 Low FEMA zone X (unshaded) · 0% chance over 30 yrs
- Wildfire 1/10 Low
- Heat 6/10 Major 7 d/yr ≥103°F today · 19 d/yr by 30 yrs out
- Wind 6/10 Major 27% chance of damaging wind over 30 yrs
- Air quality 3/10 Moderate 3 unhealthy d/yr today · 3 by 30 yrs out
Nearby sold comps map
Loading sold comps map…
Walkable amenities ~0.75 mi
Loading nearby amenities…
Taxation est. · year 1
- Rental income
- $25,415
- − Mortgage interest
- −$11,634
- − Property taxes
- −$3,273
- − Insurance
- −$1,038
- − Repairs & maintenance
- −$2,033
- − Management
- −$2,033
- − Depreciation
- −$6,042
- Taxable loss
- −$640
- Est. tax savings @ 24.0%
- +$154
- After-tax cash flow
- $2,849/yr
For passive investors: Depreciation is non-cash, so a rental often shows a tax loss while cash-flowing — sheltering income. Rental losses are passive: they offset passive income freely, and up to $25,000/yr can offset ordinary (W-2) income if you actively participate and your MAGI is under $100k (phasing out to $0 by $150k); unused losses carry forward. On sale, claimed depreciation is recaptured at up to 25%, and gains may owe capital-gains tax (a 1031 exchange can defer both). Figures are a year-1 estimate at your 24.0% rate — not tax advice; consult a CPA.
Schools (NCES district)
- District
- Fulton County
- NCES district ID
- 1302280
- Math proficiency
- 49% ▼ -2.00%
- Reading proficiency
- 53% ▬ 0.00%
- Median HH income
- $68,035
- Composite
- 45.33/100
- National rank
- #2640
- State rank
- #12 of 174 in GA
Livability — East Point
- Score
- 72/100
- State rank
- #72
- US rank
- #6314
Category grades
Schools grade is shown separately in the Schools card above.
Census & demographics
- Census place
- East Point, GA
- County
- Fulton County · 1,094,430 people
- City population
- 35,456
- Metro
- Atlanta-Sandy Springs-Alpharetta, GA
- Population (ZIP)
- 35,456
- Household income
- $68,380
- Rent vs Own
- Severe rent burden
- 2226.0
Population outlook (Fulton County) Hauer SSP2
- Today (2025)
- 1,203,707 people
- By 2030
- 1,299,706 · +8.0%
- By 2040
- 1,488,256 · +23.6%
- By 2050
- 1,664,580 · +38.3%
- By 2075
- 2,036,072 · +69.2%
- By 2100
- 2,222,402 · +84.6%
Race, ethnicity, and origin ACS 2023
- Neighborhood character
- Predominantly Black (74%)
- Race & ethnicity
- Black 74% White 11% Hispanic / Latino 11% Two or more races 6%
- Hispanic origin (detail)
- Mexican 7% Puerto Rican 1%
- Common ancestry
- Italian 1% Swiss 1% Russian 1%
- Foreign-born
- 6% · Canada, Jamaica
- Languages at home
- 87% English-only · Spanish 9% Other Indo-European 1% German/W. Germanic 1%
Political lean MEDSL · Fulton
- 2024 margin
- Solid D (+44.9) · D 71.9% · R 27.0% · Other 1.1%
- 2008→2024 swing
- +9.8pp toward D · 2008: 35.0pp · 2024: 44.9pp
- All cycles
- 2024: D+44.9 2020: D+46.4 2016: D+42.1 2012: D+29.6 2008: D+35.0
Not yet ingested
- Civics
- —
Market trends
- HPI YoY
- ▼ -113.15%
- Current HPI
- 251.7916
- Rent YoY
- ▲ 1.35%
- Metro
- Atlanta-Sandy Springs-Alpharetta, GA
- State GDP YoY
- ▲ 2.66%
- F500 in state
- 28
Industry mix (Fortune 500 HQ in GA)
| Industry | F500 HQs | Revenue |
|---|---|---|
| Paper / Packaging | 2 | $29B |
|
||
| Retail | 1 | $160B |
|
||
| Transportation / Logistics | 1 | $91B |
|
||
| Airlines | 1 | $62B |
|
||
| Consumer Goods | 1 | $47B |
|
||
| Utilities | 1 | $25B |
|
||
Price history
+332.7% since first listed19 events — show timeline
- 2026-05-11 Listed $207,700 CGMLS
- 2022-10-18 Sold (MLS) $275,000 GAMLS
- 2022-10-18 Sold (MLS) $275,000 FMLS
- 2022-07-18 Pending — GAMLS
- 2022-07-18 Contingent — FMLS
- 2022-07-13 Listed $250,000 GAMLS
- 2022-07-13 Listed $250,000 FMLS
- 2022-07-11 Relisted — GAMLS
- 2022-07-11 Listing Removed — GAMLS
- 2021-10-05 Pending — GAMLS
- 2021-07-22 Pending — GAMLS
- 2021-07-14 Listed $225,000 GAMLS
- 2011-03-28 Sold (Public Records) $43,800 Public Records
- 2011-03-23 Sold (MLS) $43,750 FMLS
- 2011-03-01 Listing Removed — FMLS
- 2011-02-15 Price Changed $49,900 GAMLS
- 2011-02-14 Price Changed $49,900 FMLS
- 2011-01-18 Listed $55,000 FMLS
- 1978-09-01 Sold (Public Records) $48,000 Public Records
Property tax history
+5.7%/yrLatest (2025): $3,273 · -2.6% YoY. Source: county tax records.
Cash-flow waterfall
monthlySold comps — $/sqft
last 12 mo · ≤1 miLoading sold comps…