 🏷️ Likely Rental
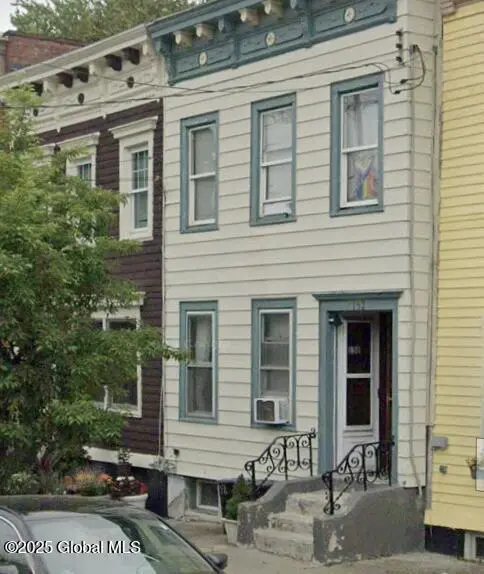
152 Dove St · Albany, NY
Flood risk 1/10 · Minimal
- FEMA flood zone
- X (unshaded)
- Chance of flooding over 30 yrs
- 0.0%
- Est. flood insurance / yr
- $473 – $860
Fire risk 1/10 · Minimal
- Est. fire insurance / yr
- $691 – $1,283
Heat risk 4/10 · Minor
- Hot days now (above 99°F)
- 7 days/yr
- Hot days in 30 yrs
- 16 days/yr
Wind risk 3/10 · Minor
- Chance of severe wind over 30 yrs
- 6.0%
Air-quality risk 1/10 · Minimal
- Unhealthy air days now
- 0 days/yr
- Unhealthy air days in 30 yrs
- 0 days/yr
Risk factors via First Street. Map © Google.
Why this score? — see what drove the B grade
The composite is a weighted blend of 9 inputs, each scored 0–100. Each bar is that input's sub-score; the figure is the points it added to the 100-point composite (weight × sub-score).
- Cash flow +24.1/30.0
- Appreciation +10.0/10.0
- DSCR +7.8/10.0
- ARV discount +7.5/15.0
- 1% rule +7.2/10.0
- Rent growth +4.7/5.0
- Livability +4.0/5.0
- Schools +3.2/10.0
- Condition / age +2.5/5.0
$230,000
🖨 Deal sheet 📄 Offer letter ✓ Due diligence
Multi-family units
County records classify this as Multi-Family (2-4 Unit). Listing-text estimate: 2 units. confirmed
Listing remarks
Multiple offers presented. Highest and best by 5/26 @ 6PM. Don't miss this well maintained 2 unit opportunity in a super convenient Albany location. You'll find Beautiful hardwood floors and tile bathroom floors. Both kitchens are updated. Laundry in the basement. Large Bedrooms. Short walk to everything in downtown Albany including Washington Park, The Capitol, ESP, nightlife and grocery/package stores. Pictures from before tenant moved in.
Key facts
- Washington park
- Tile bathroom floors
- Laundry in basement
Tags
Property features AI
Finance
- Financial info: Two-unit property
Exterior
- Utilities: Public water; Public sewer; 100 Amp electric service; Cable available
- Home design: Duplex; Primary entry facing not specified; Two-story building
- Construction: Aluminum siding; Shingle siding; Brick/Mortar foundation; Rubber roof; Built year not specified
- Exterior features: Wood fencing around the backyard; Level lot
Interior
- Kitchen: Each unit includes a kitchen
- Bedrooms: Unit 1: 1 bedroom (1st floor); Unit 2: 1 bedroom (2nd floor)
- Flooring: Tile; Hardwood; Laminate
- Bathrooms: Two full bathrooms total; One full bath on the 1st floor; One full bath on the 2nd floor
- Heating & cooling: Forced air heating; Natural gas heating
- Interior features: Paddle fan; High-speed internet available; Ceramic tile bath
Neighborhood map
What this means for you Summary
Snapshot
- This is a 2 × 2-bed/1.0-bath units multifamily listed at $230k.
Deal economics
- At list price, monthly cash flow is $455 ($5k/yr) — positive. Per door: $227/mo.
- The deal already cash-flows at list — no discount required.
- Meets the 1% rule at list price ($3k rent vs $230k).
- Cap rate 8.7% vs local median 5.7% in Albany — top-decile yield for the area; either an underpriced asset or a hidden risk that comps aren't pricing in. Stress-test before assuming the spread holds.
Location & tenants
- Location reads 79/100 on livability (#129 in NY, #2,083 nationally) — a middle-class / working-renter tenant base. Strengths: amenities A+, commute A+, housing A+; Watch: employment C-, crime F.
- Albany City School District (urban): math 37% / reading 40% proficiency, ranked #543 of 590 in NY (top 92%) — families likely to look elsewhere, expect single-tenant / working-renter base with shorter leases; 66% free/reduced lunch — lower-income household profile, screen leases tightly.
- Zoned schools: Thomas S O'Brien Academy of Science & Technology (math 27% / reading 42%, grade F, #1,577 of 2,108 statewide, top 77%, 250 students, 74% FRL); Albany High School (math 74% / reading 67%, grade B+, #710 of 1,100 statewide, top 65%, 2,676 students, 69% FRL).
- Zoned-school proficiency averages 52% at this address vs 38% district-wide (+14 pts) — the actual schools serving this property are materially stronger than the Albany City School District average implies; a family-tenant draw the district grade alone would hide.
- Market conditions: Rents rising fast (+8.7%/yr); 58 active listings in the ZIP; 40 comparable units currently listed for rent nearby; rentals at typical pace (median 24d on market — plan ~3-4 weeks tenant-placement turnaround); 675 units permitted in Albany County in 2024 (451 in 5+ unit buildings).
Forward outlook
- In year one you build about $25k of equity ($2k loan paydown + $23k appreciation (10.0% local appreciation)).
- Albany County population projected at +9% by 2050 — modest demand growth; plan on rents tracking national, not racing it.
- At projected returns (10.0% appreciation + 8.0% rent growth), your $64k cash investment doubles in ~2 years — after that, you're playing with house money.
- By year 2, paydown + projected appreciation supports a ~$40k cash-out refi (75% LTV) — recoverable capital for the next deal without selling this one.
Negotiation context
- Only 14 days on market — expect competitive offers; lowballing is unlikely to land.
- 4 sale attempts since 10y ago with the ask held roughly flat each time — persistent listings suggest the price (not the market) is what's stuck; bring a comps-based counter.
- Current owner paid $76k; list at $230k implies a 203% gain — meaningful room to come down on a strong offer.
Risks & watch-outs
- Watch-outs: built in 1900 — expect roof / HVAC / electrical / plumbing capex.
Questions for the listing agent
- Can we see the unit-by-unit rent roll, current vacancy, and any below-market leases? What's the average tenancy length?
- What capital expenditures (roof, boiler, parking lot, exteriors) have been made in the last 5 years, and what's planned in the next 2?
- Built in 1900 — when were the roof, HVAC, electrical panel, plumbing, and water heater last replaced?
- Is there a deadline driving the sale (1031 exchange, divorce, estate, relocation)? That informs how much negotiation room exists.
- Crime grade is F in this area — have there been break-ins, vandalism, or insurance claims at this property in the last 3 years? What carrier currently insures it and at what premium?
- What's the average days-on-market for RENTAL listings here right now (not sales)? A rising rental-DOM trend means longer vacancies and softer asking-rent achievability than the comps imply.
- What's the recent tenant-quality profile in this submarket — average credit score on applications, eviction rate, late-payment / NSF rate, and stable-employment percentage? A property-management company in the area should have these aggregated.
- How much new apartment / multifamily construction is in the pipeline within 1–3 miles? Heavy new supply (>2% of stock underway) typically softens rents 12–24 months out; light construction supports rent growth.
Investment metrics
- 1% rule
- 1.22% ✓
- Cap rate
- 8.66%
- Cash-on-cash
- 8.47%
- DSCR
- 1.38
- GRM
- 6.8
CMA / ARV
- ARV (median comp)
- $460,430
- List price
- $230,000
- Delta
- -50.05%
- Verdict
- UNDERPRICED
- Comps
- 20 within 1.0 mi
Show comp detail 12 sales within ~0.75 mi
| Address | Dist | Beds/Ba | Sqft | Sold | Price | $/sf | Match |
|---|---|---|---|---|---|---|---|
| 203 Myrtle Ave | 0.04mi | 4/2.0 | 1,624 (+9%) | 22mo | $230,000 | $142 | 66 |
| 63 Irving St | 0.06mi | 3/2.5 (-1) | 1,638 (+10%) | 13mo | $207,000 | $126 | 64 |
| 378 Hamilton St | 0.23mi | 4/3.0 | 1,700 (+14%) | 6mo | $285,000 | $168 | 58 |
| 33 Myrtle Ave | 0.47mi | 4/2.0 | 1,612 (+8%) | 11mo | $180,000 | $112 | 56 |
| 77 3rd Ave | 0.69mi | 4/1.5 | 1,529 (+2%) | 12mo | $120,000 | $78 | 53 |
| 8 Myrtle Ave | 0.56mi | 3/2.0 (-1) | 1,446 (-3%) | 14mo | $195,000 | $135 | 51 |
| 301 Hudson Ave | 0.29mi | 3/2.0 (-1) | 1,700 (+14%) | 16mo | $360,000 | $212 | 45 |
| 4 Myrtle Ave | 0.56mi | 3/2.0 (-1) | 1,446 (-3%) | 23mo | $113,000 | $78 | 44 |
| 299 Hudson Ave | 0.29mi | 3/3.0 (-1) | 1,710 (+14%) | 14mo | $324,450 | $190 | 42 |
| 62 Catherine St | 0.58mi | 5/2.5 (+1) | 1,320 (-12%) | 13mo | $319,000 | $242 | 35 |
| 3 Regent St | 0.72mi | 4/2.0 | 1,309 (-12%) | 13mo | $142,000 | $108 | 35 |
| 40 Spring St | 0.50mi | 3/3.0 (-1) | 1,716 (+15%) | 14mo | $221,100 | $129 | 31 |
Match score weights: distance 35% · size 25% · config 20% · recency 20%. Top-matched comps best support the ARV.
Projected returns pro-forma
10.0% appreciation · 8.0% rent growth · sell at horizon
- IRR
- 32.8%
- Equity multiple
- 3.63×
- Total profit
- $169,249
- Equity at exit
- $207,202
- IRR
- 30.2%
- Equity multiple
- 8.96×
- Total profit
- $512,817
- Equity at exit
- $446,839
Cash invested: $64,400 (down + closing). Projections, not guarantees.
Landlord ↔ Tenant lean methodology
- Overall (STATE)
- 15 Strongly Tenant-Friendly
- State New York
- 15 Strongly Tenant-Friendly · D+10
- County
- — inherits STATE
- City
- — inherits STATE
ZIP-level market 12202
- Home prices YoY
- 14.3%
- Rents YoY
- 8.7%
- Active inventory
- 58
- Price-to-rent
- 13.6×
Monthly cashflow live
- Estimated rent
- $2,816 high interval (Pro) →
- Mortgage (P&I)
- −$1,206
- Tax from tax record
- −$468 /mo · $5,618/yr
- Insurance
- −$96
- HOA
- −$0
- Vacancy / Maint / Mgmt
- −$591
- Net cashflow
- $455
Break-even live
2-unit breakdown (identical units grouped — click to expand)
| Units | Beds | Baths | Est. rent |
|---|---|---|---|
| 2× units | 2 | 1 | $2,816 |
| #1 | 2 | 1 | $1,408 |
| #2 | 2 | 1 | $1,408 |
| Total (2 units) | $2,816 | ||
UW: 25.0% down · 7.5% · 30yr · 1.5% tax · 5.0% vac · 8.0% maint · 8.0% mgmt
Financing live
Cash to close
- Down payment
- $57,500
- Closing costs
- $6,900
- Reserves months
- —
- Total cash needed
- —
Loan-product check · same deal, 3 products live
Conventional
25% down · 7.5% · 30yr
- Down + closing
- —
- Monthly P&I
- —
- Monthly cashflow
- —
- DSCR
- —
- Eligible?
- —
Personal DTI + credit; lowest rate.
DSCR
20% down · 8.5% · 30yr
- Down + closing
- —
- Monthly P&I
- —
- Monthly cashflow
- —
- DSCR
- —
- Eligible?
- —
No personal income docs; deal must DSCR.
Hard money
10% down · 12.0% · 12mo
- Down + closing
- —
- Monthly P&I
- —
- Monthly cashflow
- —
- DSCR
- —
- Eligible?
- —
Short-term bridge; refi at stabilization.
Rent comps 40 comps
| Address | Beds | Baths | Sqft | Rent | $/sqft | DOM | Units | Dist |
|---|---|---|---|---|---|---|---|---|
| 201 Park Ave Unit 10 Albany, NY | 3.0 | 2.0 | 1600 | $2,100 | $1.31 | 43d | 1 | 0.06mi |
| 4 Irving St Unit 2nd Floor Albany, NY | 3.0 | 1.0 | 1000 | $1,695 | $1.70 | 43d | 1 | 0.10mi |
| 346 Madison Ave Unit 3 Albany, NY | 3.0 | 2.0 | 1110 | $2,725 | $2.45 | 43d | 1 | 0.16mi |
| 346 Madison Ave Albany, NY | 3.0 | 2.0 | 1500 | $2,495 | $1.66 | 23d | 1 | 0.16mi |
| 88 Willett St Albany, NY | 3.0 | 1.0 | 825 | $2,080 | $2.52 | 14d | 10 | 0.32mi |
| 520 Madison Ave Unit 1 Albany, NY | 3.0 | 1.0 | 1080 | $1,700 | $1.57 | 43d | 1 | 0.40mi |
| 199 Lark St Albany, NY | 3.0 | 1.0 | 1000 | $1,800 | $1.80 | 43d | 1 | 0.52mi |
| 119 Grand St Albany, NY | 3.0 | 1.0 | 1600 | $1,300 | $0.81 | 43d | 1 | 0.56mi |
| 168 S Pearl St Albany, NY | 3.0 | 1.5 | 1044 | $1,800 | $1.72 | 23d | 1 | 0.68mi |
| 254 Sheridan Ave Unit 2 Albany, NY | 3.0 | 1.0 | 900 | $1,300 | $1.44 | 23d | 1 | 0.72mi |
| 22 Hurlbut St Albany, NY | 3.0 | 1.0 | 1209 | $2,050 | $1.70 | 43d | 1 | 0.82mi |
| 31 Bertha St Albany, NY | 4.0 | 1.0 | 1116 | $2,000 | $1.79 | 23d | 1 | 0.83mi |
| 32 1st St Albany, NY | 4.0 | 1.5 | 1773 | $1,850 | $1.04 | 43d | 1 | 0.91mi |
| 546 Mercer St Unit 1 Albany, NY | 3.0 | 1.0 | 1400 | $1,800 | $1.29 | 23d | 1 | 0.91mi |
| 475 S Pearl St #3 Albany, NY | 4.0 | 2.0 | 1200 | $1,850 | $1.54 | 21d | 1 | 0.92mi |
| 475 S Pearl St #3 Albany, NY | 4.0 | 2.0 | 1200 | $1,850 | $1.54 | 14d | 1 | 0.92mi |
| 147 Western Ave Albany, NY | 3.0 | 1.0 | 1428 | $1,800 | $1.26 | 14d | 1 | 0.92mi |
| 433 Hamilton St Unit 1 Albany, NY | 4.0 | 1.0 | 1200 | $2,300 | $1.92 | 14d | 1 | 0.94mi |
| 9 St Josephs Ter Albany, NY | 3.0 | 2.0 | 1000 | $1,850 | $1.85 | 43d | 1 | 0.95mi |
| 437 Hamilton St Unit 2 Albany, NY | 4.0 | 1.0 | 1200 | $2,300 | $1.92 | 14d | 1 | 0.95mi |
| 21 Woodlawn Ave Unit 3RDFL Albany, NY | 3.0 | 1.0 | 1300 | $1,500 | $1.15 | 43d | 1 | 0.95mi |
| 21 Woodlawn Ave Unit 3rd floor Albany, NY | 3.0 | 1.0 | 1300 | $1,500 | $1.15 | 23d | 1 | 0.95mi |
| 15 Stanwix St Albany, NY | 4.0 | 1.5 | 1660 | $2,500 | $1.51 | 14d | 1 | 0.96mi |
| 178 Western Ave Unit 3 Albany, NY | 3.0 | 1.0 | 1500 | $1,725 | $1.15 | 14d | 1 | 0.96mi |
| 58 Elberon Pl Apt 2 Albany, NY | 4.0 | 1.0 | 1250 | $2,200 | $1.76 | 43d | 1 | 0.99mi |
| 614 Park Ave Albany, NY | 3.0 | 1.0 | 1118 | $2,500 | $2.24 | 43d | 1 | 1.01mi |
| 52 Grove Ave Albany, NY | 4.0 | 1.0 | 1200 | $2,200 | $1.83 | 21d | 1 | 1.04mi |
| 223 Western Ave #1 Albany, NY | 3.0 | 1.0 | 1100 | $1,750 | $1.59 | 23d | 1 | 1.06mi |
| 282 Livingston Ave Albany, NY | 3.0 | 1.5 | 1464 | $2,400 | $1.64 | 23d | 1 | 1.07mi |
| 830 Madison Ave Albany, NY | 3.0 | 1.0 | 1180 | $1,700 | $1.44 | 23d | 1 | 1.07mi |
| 489 Hamilton St Unit 1 Albany, NY | 3.0 | 1.0 | 1100 | $1,800 | $1.64 | 14d | 1 | 1.09mi |
| 502 Second Ave #3 Albany, NY | 3.0 | 1.0 | 1100 | $1,800 | $1.64 | 43d | 1 | 1.09mi |
| 273 Western Ave Unit 3 Albany, NY | 3.0 | 1.0 | 1100 | $1,850 | $1.68 | 23d | 1 | 1.14mi |
| 273 Western Ave Unit 2 Albany, NY | 3.0 | 1.0 | 1000 | $1,800 | $1.80 | 23d | 1 | 1.14mi |
| 673 Myrtle Ave Albany, NY | 4.0 | 1.0 | 1076 | $2,400 | $2.23 | 21d | 1 | 1.15mi |
| 517 Hamilton St Albany, NY | 4.0 | 1.0 | 1020 | $2,000 | $1.96 | 23d | 1 | 1.18mi |
| 50 Southern Blvd Albany, NY | 3.0 | 1.0 | 1200 | $1,650 | $1.38 | 14d | 1 | 1.19mi |
| 569 Washington Ave Unit 1st Floor Albany, NY | 4.0 | 1.0 | 1275 | $2,000 | $1.57 | 43d | 1 | 1.28mi |
| 260 Bradford St Unit 205 Albany, NY | 3.0 | 2.0 | 912 | $1,700 | $1.86 | 23d | 1 | 1.33mi |
| 602 Morris St Albany, NY | 3.0 | 1.0 | 1270 | $1,850 | $1.46 | 14d | 1 | 1.40mi |
Listing history 8 events
-
2026-05-15$230,000 Active 426-char remark
-
2025-07-18historical
-
2025-06-05$225,000 Active
-
2018-01-31historical
-
2017-09-08$139,900 New
-
2016-06-06soldstatus $76,000 Closed (Final Sale)
-
2016-04-05status Pend (Under Cntr)
-
2016-03-30$70,000 New
ⓘ Source: listings_history table (triggers on properties + properties_extension) + one-shot
backfill from property_details.listing_events for pre-trigger history.
Tax reassessment forecast NY · Partial reset (capped growth)
- Current annual tax
- $5,618 · $468/mo
- Projected year-2 tax
- $5,618 · $468/mo
- Expected delta
- $0/yr ($0/mo · 0.0%)
ⓘ Screening estimate from a state-policy table — verify with the county assessor before closing.
Climate risk First Street
- Flood 1/10 Low FEMA zone X (unshaded) · 0% chance over 30 yrs
- Wildfire 1/10 Low
- Heat 4/10 Moderate 7 d/yr ≥99°F today · 16 d/yr by 30 yrs out
- Wind 3/10 Moderate 6% chance of damaging wind over 30 yrs
- Air quality 1/10 Low 0 unhealthy d/yr today · 0 by 30 yrs out
Nearby sold comps map
Loading sold comps map…
Walkable amenities ~0.75 mi
Loading nearby amenities…
Taxation est. · year 1
- Rental income
- $33,792
- − Mortgage interest
- −$12,884
- − Property taxes
- −$5,618
- − Insurance
- −$1,150
- − Repairs & maintenance
- −$2,703
- − Management
- −$2,703
- − Depreciation
- −$6,691
- Taxable income
- $2,043
- Est. tax owed @ 24.0%
- −$490
- After-tax cash flow
- $4,964/yr
For passive investors: Depreciation is non-cash, so a rental often shows a tax loss while cash-flowing — sheltering income. Rental losses are passive: they offset passive income freely, and up to $25,000/yr can offset ordinary (W-2) income if you actively participate and your MAGI is under $100k (phasing out to $0 by $150k); unused losses carry forward. On sale, claimed depreciation is recaptured at up to 25%, and gains may owe capital-gains tax (a 1031 exchange can defer both). Figures are a year-1 estimate at your 24.0% rate — not tax advice; consult a CPA.
Schools (NCES district)
- District
- Albany City School District
- NCES district ID
- 3602460
- Math proficiency
- 37% ▲ 6.00%
- Reading proficiency
- 40% ▲ 7.00%
- Median HH income
- $40,568
- Composite
- 32.34/100
- National rank
- #5744
- State rank
- #543 of 590 in NY
Livability — Albany
- Score
- 79/100
- State rank
- #129
- US rank
- #2083
Category grades
Schools grade is shown separately in the Schools card above.
Census & demographics
- Census place
- Albany, NY
- County
- Albany County · 196,626 people
- City population
- 116,921
- Metro
- Albany-Schenectady-Troy, NY
- Population (ZIP)
- 10,166
- Household income
- $52,868
- Rent vs Own
- Severe rent burden
- 935.0
Population outlook (Albany County) Hauer SSP2
- Today (2025)
- 320,794 people
- By 2030
- 327,401 · +2.1%
- By 2040
- 338,218 · +5.4%
- By 2050
- 348,467 · +8.6%
- By 2075
- 381,693 · +19.0%
- By 2100
- 393,809 · +22.8%
Race, ethnicity, and origin ACS 2023
- Neighborhood character
- Highly diverse neighborhood (Simpson 0.73)
- Race & ethnicity
- Black 40% White 28% Hispanic / Latino 15% Two or more races 14% Asian 7%
- Hispanic origin (detail)
- Mexican 3% Puerto Rican 5% Dominican 5%
- Common ancestry
- Iranian 2% Romanian 1% Serbian 1%
- Foreign-born
- 14% · Canada, Philippines, China
- Languages at home
- 80% English-only · Spanish 10% Other Asian/Pacific 4% Arabic 1%
Political lean MEDSL · Albany
- 2024 margin
- Strong D (+25.8) · D 62.9% · R 37.1%
- 2008→2024 swing
- -3.6pp toward R · 2008: 29.4pp · 2024: 25.8pp
- All cycles
- 2024: D+25.8 2020: D+31.4 2016: D+24.3 2012: D+31.0 2008: D+29.4
Not yet ingested
- Civics
- —
Market trends
- HPI YoY
- ▲ 38.05%
- Current HPI
- 303.8939
- Rent YoY
- ▲ 8.70%
- Metro
- Albany-Schenectady-Troy, NY
- State GDP YoY
- ▲ 2.60%
- F500 in state
- 92
Industry mix (Fortune 500 HQ in NY)
| Industry | F500 HQs | Revenue |
|---|---|---|
| Financial Services | 10 | $950B |
|
||
| Consumer Goods | 9 | $162B |
|
||
| Insurance | 4 | $225B |
|
||
| Telecommunications | 2 | $144B |
|
||
| Pharmaceuticals | 2 | $112B |
|
||
| Media / Entertainment | 2 | $69B |
|
||
Price history
+228.6% since first listed9 events — show timeline
- 2026-05-29 Pending — Global MLS
- 2026-05-15 Listed $230,000 Global MLS
- 2025-07-18 Listing Removed — Global MLS
- 2025-06-05 Listed $225,000 Global MLS
- 2018-01-31 Listing Removed — Global MLS
- 2017-09-08 Listed $139,900 Global MLS
- 2016-06-06 Sold (MLS) $76,000 Global MLS
- 2016-04-05 Pending — Global MLS
- 2016-03-30 Listed $70,000 Global MLS
Property tax history
+23.3%/yrLatest (2025): $5,618 · +3.3% YoY. Source: county tax records.
Cash-flow waterfall
monthlySold comps — $/sqft
last 12 mo · ≤1 miLoading sold comps…