38 Saint George · Bourbonnais, IL
Flood risk No data
- FEMA flood zone
- —
- Chance of flooding over 30 yrs
- —
- Est. flood insurance / yr
- —
Fire risk No data
- Est. fire insurance / yr
- —
Heat risk No data
- Hot days now (above threshold)
- —
- Hot days in 30 yrs
- —
Wind risk No data
- Chance of severe wind over 30 yrs
- —
Air-quality risk No data
- Unhealthy air days now
- —
- Unhealthy air days in 30 yrs
- —
Risk factors via First Street. Map © Google.
Why this score? — see what drove the B- grade
The composite is a weighted blend of 9 inputs, each scored 0–100. Each bar is that input's sub-score; the figure is the points it added to the 100-point composite (weight × sub-score).
- Cash flow +30.0/30.0
- 1% rule +10.0/10.0
- DSCR +10.0/10.0
- ARV discount +7.5/15.0
- Condition / age +3.8/5.0
- Livability +3.5/5.0
- Rent growth +2.5/5.0
- Schools +1.8/10.0
- Appreciation +0.0/10.0
$65,000
🖨 Deal sheet 📄 Offer letter ✓ Due diligence
Listing remarks
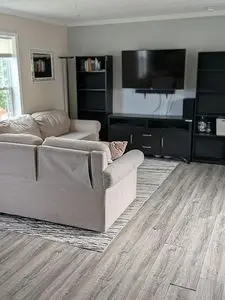
3 bedroom 2 bath home in Tri- Star Manufactured Estates in Bourbonnais. This house has all new flooring throughout. New fridge and has washer and dryer and shed. New 24x14 sqft front porch. New open pantry shelving. Amenities include pool, parks, basketball courts and use of community club house for private parties. Lot rent is $749
Key facts
- Open pantry shelving
- New front porch
- Washer and dryer
Tags
Neighborhood map
What this means for you Summary
Snapshot
- This is a 3-bed/2.0-bath other listed at $65k. Condition is rated good.
Deal economics
- At list price, monthly cash flow is $1k ($14k/yr) — positive.
- The deal already cash-flows at list — no discount required.
- Meets the 1% rule at list price ($2k rent vs $65k).
- Cap rate 28.0% vs local median 3.9% in Bourbonnais — top-decile yield for the area; either an underpriced asset or a hidden risk that comps aren't pricing in. Stress-test before assuming the spread holds.
Location & tenants
- Location reads 70/100 on livability (#362 in IL) — a middle-class / working-renter tenant base. Strengths: crime A+, cost of living A+, housing A+; Watch: schools D, amenities F, commute F.
- Bradley Bourbonnais Chsd 307 (suburban): math 15% / reading 24% proficiency, ranked #413 of 620 in IL (top 67%) — low school quality limits family demand, transient renter base, plan for 1-2y turnover.
- Market conditions: 86 active listings in the ZIP; solid renter incomes; 145 units permitted in Kankakee County in 2024 (5 in 5+ unit buildings).
Forward outlook
- Local home prices are declining (-3.0%/yr); year-one equity from $449 of loan paydown is wiped out by about $2k of value loss. Plan a longer hold.
- Kankakee County population projected at -19% by 2050 — secular population decline; favor cash flow + early exit over multi-decade hold.
- At projected returns (-3.0% appreciation + 3.0% rent growth), your $18k cash investment doubles in ~2 years — after that, you're playing with house money.
Negotiation context
- Only 10 days on market — expect competitive offers; lowballing is unlikely to land.
Questions for the listing agent
- Is there a deadline driving the sale (1031 exchange, divorce, estate, relocation)? That informs how much negotiation room exists.
- Schools are D-rated, which usually means shorter tenancies and higher turnover. Who's the typical renter profile here, and what's been the actual vacancy rate?
- What's the average days-on-market for RENTAL listings here right now (not sales)? A rising rental-DOM trend means longer vacancies and softer asking-rent achievability than the comps imply.
- What's the recent tenant-quality profile in this submarket — average credit score on applications, eviction rate, late-payment / NSF rate, and stable-employment percentage? A property-management company in the area should have these aggregated.
- How much new for-sale + rental construction is in the pipeline within 1–3 miles? Heavy new supply typically softens prices + rents 12–24 months out; constrained supply supports both.
Investment metrics
- 1% rule
- 3.17% ✓
- Cap rate
- 28.01%
- Cash-on-cash
- 77.55%
- DSCR
- 4.45
- GRM
- 2.6
CMA / ARV
No comps found within radius.
Projected returns pro-forma
-3.0% appreciation · 3.0% rent growth · sell at horizon
- IRR
- 77.6%
- Equity multiple
- 4.54×
- Total profit
- $64,412
- Equity at exit
- $9,692
- IRR
- 81.2%
- Equity multiple
- 9.39×
- Total profit
- $152,679
- Equity at exit
- $5,620
Cash invested: $18,200 (down + closing). Projections, not guarantees.
Landlord ↔ Tenant lean methodology
- Overall (STATE)
- 43 Moderately Tenant-Leaning
- State Illinois
- 43 Moderately Tenant-Leaning · D+7
- County
- — inherits STATE
- City
- — inherits STATE
ZIP-level market 60914
- Active inventory
- 86
- Price-to-rent
- 2.6×
Monthly cashflow live
- Estimated rent
- $2,057 medium interval (Pro) →
- Mortgage (P&I)
- −$341
- Tax est. 1.5%
- −$81 /mo · $975/yr
- Insurance
- −$27
- HOA
- −$0
- Vacancy / Maint / Mgmt
- −$432
- Net cashflow
- $1,176
Break-even live
UW: 25.0% down · 7.5% · 30yr · 1.5% tax · 5.0% vac · 8.0% maint · 8.0% mgmt
Financing live
Cash to close
- Down payment
- $16,250
- Closing costs
- $1,950
- Reserves months
- —
- Total cash needed
- —
Loan-product check · same deal, 3 products live
Conventional
25% down · 7.5% · 30yr
- Down + closing
- —
- Monthly P&I
- —
- Monthly cashflow
- —
- DSCR
- —
- Eligible?
- —
Personal DTI + credit; lowest rate.
DSCR
20% down · 8.5% · 30yr
- Down + closing
- —
- Monthly P&I
- —
- Monthly cashflow
- —
- DSCR
- —
- Eligible?
- —
No personal income docs; deal must DSCR.
Hard money
10% down · 12.0% · 12mo
- Down + closing
- —
- Monthly P&I
- —
- Monthly cashflow
- —
- DSCR
- —
- Eligible?
- —
Short-term bridge; refi at stabilization.
Listing history 9 events
-
2026-06-19days on market $65,000 Active 10 DOM
-
2026-06-18days on market $65,000 Active 9 DOM
-
2026-06-17days on market $65,000 Active 8 DOM
-
2026-06-16days on market $65,000 Active 7 DOM
-
2026-06-15days on market $65,000 Active 6 DOM
-
2026-06-14days on market $65,000 Active 4 DOM
-
2026-06-13days on market $65,000 Active 3 DOM
-
2026-06-10remarks 334-char remark
-
2026-06-10$65,000 Active 1 DOM
ⓘ Source: listings_history table (triggers on properties + properties_extension) + one-shot
backfill from property_details.listing_events for pre-trigger history.
Nearby sold comps map
Loading sold comps map…
Walkable amenities ~0.75 mi
Loading nearby amenities…
Taxation est. · year 1
- Rental income
- $24,690
- − Mortgage interest
- −$3,641
- − Property taxes
- −$975
- − Insurance
- −$325
- − Repairs & maintenance
- −$1,975
- − Management
- −$1,975
- − Depreciation
- −$1,891
- Taxable income
- $13,908
- Est. tax owed @ 24.0%
- −$3,338
- After-tax cash flow
- $10,777/yr
For passive investors: Depreciation is non-cash, so a rental often shows a tax loss while cash-flowing — sheltering income. Rental losses are passive: they offset passive income freely, and up to $25,000/yr can offset ordinary (W-2) income if you actively participate and your MAGI is under $100k (phasing out to $0 by $150k); unused losses carry forward. On sale, claimed depreciation is recaptured at up to 25%, and gains may owe capital-gains tax (a 1031 exchange can defer both). Figures are a year-1 estimate at your 24.0% rate — not tax advice; consult a CPA.
Condition & rehab AI · 1 photo
This 3-bedroom, 2-bath home in Bourbonnais has new flooring and is in good condition, with potential for further value through exterior painting and roof inspection.
Value-add opportunities
- Both Paint exterior — Enhances curb appeal and value
- Both Inspect and repair roof — Ensures structural integrity and prevents leaks
Renovation cost estimate screening
Value-add ROI direction
- Both Paint exterior — Enhances curb appeal and value ↑
- Both Inspect and repair roof — Ensures structural integrity and prevents leaks ↑
ⓘ Cost ranges are severity-bucket heuristics (US national rule-of-thumb). Get contractor quotes + a written scope before underwriting a rehab budget.
Schools (NCES district)
- District
- Bradley Bourbonnais Chsd 307
- NCES district ID
- 1706960
- Math proficiency
- 15% ▼ -6.00%
- Reading proficiency
- 24% ▼ -6.00%
- Median HH income
- $59,302
- Composite
- 18.35/100
- National rank
- #8945
- State rank
- #413 of 620 in IL
Livability — Bourbonnais
- Score
- 70/100
- State rank
- #362
- US rank
- #7487
Category grades
Schools grade is shown separately in the Schools card above.
Census & demographics
- County
- Kankakee County · 61,801 people
- City population
- 28,673
- Metro
- Kankakee, IL
- Population (ZIP)
- 28,673
- Household income
- $86,223
- Rent vs Own
- Severe rent burden
- 590.0
Population outlook (Kankakee County) Hauer SSP2
- Today (2025)
- 105,479 people
- By 2030
- 101,792 · -3.5%
- By 2040
- 93,479 · -11.4%
- By 2050
- 85,061 · -19.4%
- By 2075
- 67,314 · -36.2%
- By 2100
- 52,439 · -50.3%
Race, ethnicity, and origin ACS 2023
- Neighborhood character
- Predominantly White (76%)
- Race & ethnicity
- White 76% Black 10% Hispanic / Latino 7% Two or more races 6% Asian 3%
- Hispanic origin (detail)
- Mexican 4%
- Common ancestry
- Lithuanian 7% Romanian 6% Iranian 2%
- Foreign-born
- 4% · Canada, South Korea
- Languages at home
- 93% English-only · Spanish 4% Tagalog/Filipino 1%
Political lean MEDSL · Kankakee
- 2024 margin
- Strong R (+20.8) · D 38.7% · R 59.5% · Other 1.8%
- 2008→2024 swing
- -25.4pp toward R · 2008: 4.6pp · 2024: -20.8pp
- All cycles
- 2024: R+20.8 2020: R+16.5 2016: R+13.3 2012: R+3.4 2008: D+4.6
Not yet ingested
- Civics
- —
Market trends
- HPI YoY
- ▼ -106.62%
- Current HPI
- 175.0777
- Rent YoY
- —
- Metro
- Kankakee, IL
- State GDP YoY
- ▲ 1.59%
- F500 in state
- 60
Industry mix (Fortune 500 HQ in IL)
| Industry | F500 HQs | Revenue |
|---|---|---|
| Insurance | 4 | $201B |
|
||
| Consumer Goods | 4 | $87B |
|
||
| Industrial Machinery | 3 | $64B |
|
||
| Healthcare | 2 | $55B |
|
||
| Retail / Pharmacy | 1 | $148B |
|
||
| Agriculture / Food | 1 | $86B |
|
||
Price history
1 event — show timeline
- 2026-06-10 Listed $65,000 FSBO.com
Cash-flow waterfall
monthlySold comps — $/sqft
last 12 mo · ≤1 miLoading sold comps…