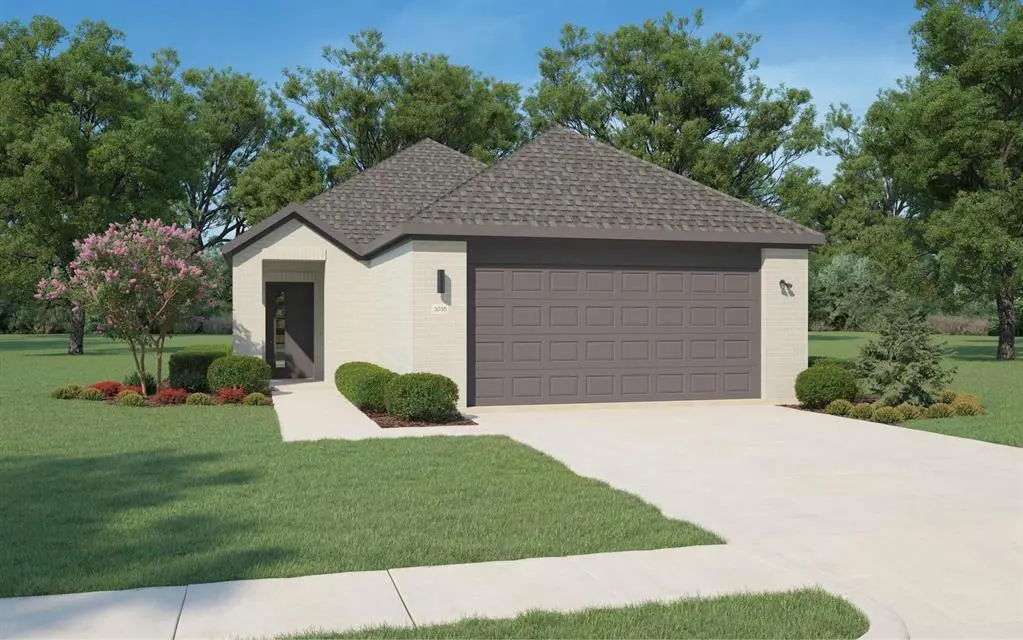
2806 Baynes Pl · Lowry Crossing, TX
Flood risk 1/10 · Minimal
- FEMA flood zone
- X (unshaded)
- Chance of flooding over 30 yrs
- 0.0%
- Est. flood insurance / yr
- $507 – $1,088
Fire risk 4/10 · Minor
- Est. fire insurance / yr
- $1,222 – $2,270
Heat risk 7/10 · Major
- Hot days now (above 111°F)
- 6 days/yr
- Hot days in 30 yrs
- 19 days/yr
Wind risk 6/10 · Moderate
- Chance of severe wind over 30 yrs
- 27.0%
Air-quality risk 3/10 · Minor
- Unhealthy air days now
- 3 days/yr
- Unhealthy air days in 30 yrs
- 3 days/yr
Risk factors via First Street. Map © Google.
Why this score? — see what drove the D- grade
The composite is a weighted blend of 9 inputs, each scored 0–100. Each bar is that input's sub-score; the figure is the points it added to the 100-point composite (weight × sub-score).
- ARV discount +9.8/15.0
- Cash flow +9.7/30.0
- Schools +4.2/10.0
- Condition / age +4.0/5.0
- 1% rule +3.2/10.0
- Livability +3.2/5.0
- DSCR +2.8/10.0
- Rent growth +2.2/5.0
- Appreciation +0.0/10.0
$255,990
🖨 Deal sheet 📄 Offer letter ✓ Due diligence
Listing remarks
MLS# 21248640 - Built by Trophy Signature Homes - Jun 2026 completion! ~ The birch tree represents new beginnings and what better place to start anew than with a floor plan bearing the same name? Invite new neighbors over for a housewarming party featuring stuffed mushrooms. The secret ingredient is the gourmet kitchen you used to make them in. There’s plenty of room to entertain in the airy great room, but with the patio door open, guests can enjoy fresh air. When conversation turns to work, take them to see the bedroom you converted into a home office. The spacious closet is perfect for storing supplies. After the party, snuggle with your spouse in the lovely primary suite. You made
Key facts
- Primary suite
- Gourmet kitchen
- Airy great room
Tags
Property features AI
Finance
- Other: Community playground; Green/energy-efficient features: efficient appliances, HVAC, insulation, and lighting; Water conservation features: low-flow fixtures and water-smart landscaping
- HOA & community: Mandatory HOA (Lowry Trails); HOA covers maintenance of grounds and management fees; Annual HOA fee; Neighborhood Management, Inc. (management company)
Exterior
- Parking: 2 covered parking spaces; 2-car garage with garage door opener and garage facing front (approx. 20' x 20')
- Security: Prewired; Smoke detector(s); Carbon monoxide detector(s)
- Utilities: City water; City sewer; Not in a municipal utility district
- Home design: Single-family residence; One story; New construction (incomplete); Located in Lowry Trails planned development
- Construction: Built in 2025; Brick, rock/stone, and siding exterior; Composition roof; Slab foundation; Smart home features included
- Exterior features: Private yard; Gutters; Exterior lighting; Wood backyard fencing
Interior
- Kitchen: Dishwasher; Disposal; Microwave; Pantry; Tankless water heater
- Bedrooms: 3 bedrooms on main level (one is primary bedroom)
- Flooring: Carpet; Luxury vinyl plank; Tile
- Bathrooms: 2 full bathrooms
- Heating & cooling: Central heating; Central air; Ceiling fan(s)
- Interior features: Open floorplan; Pantry; Walk-in closet(s); Cable TV available; High-speed internet available
- Laundry & utility: Full-size washer/dryer area; Washer hookup; Electric dryer hookup; Utility room
Neighborhood map
What this means for you Summary
Snapshot
- This is a 3-bed/2.0-bath single-family listed at $256k. Condition is rated good.
Deal economics
- At list price, monthly cash flow is $-167 ($-2k/yr) — negative.
- To cash-flow at today's rent, offer at most $232k (9.4% below list).
- To meet the 1% rule (rent ≥ 1% of price), the offer needs to be $210k (18.1% below list).
- Recommended offer: $210k (18.1% below list) — sets the bar for 1% rule.
- Cap rate 5.5% vs local median 4.3% in Lowry Crossing — meaningfully above typical; check what's discounted (condition, days-on-market, listing class) to confirm the premium yield is real.
Location & tenants
- Location reads 65/100 on livability (#718 in TX) — a middle-class / working-renter tenant base. Strengths: crime A+, employment A+, housing A+; Watch: amenities F, commute F, health & safety F.
- Princeton ISD (suburban): math 51% / reading 47% proficiency, ranked #188 of 826 in TX (top 23%) — families likely to look elsewhere, expect single-tenant / working-renter base with shorter leases.
- Zoned schools: Harper El (math 50% / reading 41%, grade D-, #1,112 of 4,322 statewide, top 26%, 436 students, 56% FRL) — zoned schools at 56% FRL track the district average.
- Market conditions: Rents soft (-1.0%/yr); 1404 active listings in the ZIP; 16 comparable units currently listed for rent nearby; rentals lingering (median 44d on market — plan ~5-8 weeks vacancy on turnover, expect pricing pressure); 50% of comp listings sitting > 30 days — soft ceiling on asking rent; solid renter incomes; 19,194 units permitted in Collin County in 2024 (3,988 in 5+ unit buildings).
Forward outlook
- Local home prices are declining (-3.0%/yr); year-one equity from $2k of loan paydown is wiped out by about $8k of value loss. Plan a longer hold.
- Collin County population projected at +60% by 2050 — long-run rental-demand tailwind backs the buy-and-hold thesis.
Negotiation context
- It's been on market 56 days — a 3% lower offer ($248k) is reasonable based on typical stale-listing flexibility.
Risks & watch-outs
- Climate carrying-cost: major wind risk, 27% chance of damaging wind over 30y; extreme-heat days projected 6→19/yr by 2055 (HVAC capex compounding) — expect insurance premiums to compound above CPI over the hold.
Questions for the listing agent
- What do current leases actually rent for vs. the listed asking? Can we see a recent rent roll and the last 12 months of T-12 income?
- It's been on market 56 days. Have you received any prior offers? Is the seller open to a 18% concession, seller financing, or rate buy-down credit?
- What does the HOA fee cover, when was the last increase, and are there any pending special assessments or reserve-fund shortfalls?
- Is there a deadline driving the sale (1031 exchange, divorce, estate, relocation)? That informs how much negotiation room exists.
- Schools are D-rated, which usually means shorter tenancies and higher turnover. Who's the typical renter profile here, and what's been the actual vacancy rate?
- The area grade is low — what's the realistic commute time and amenity access for the typical tenant pool here? Any planned neighborhood developments (good or bad) we should know about?
- What's the average days-on-market for RENTAL listings here right now (not sales)? A rising rental-DOM trend means longer vacancies and softer asking-rent achievability than the comps imply.
- What's the recent tenant-quality profile in this submarket — average credit score on applications, eviction rate, late-payment / NSF rate, and stable-employment percentage? A property-management company in the area should have these aggregated.
- How much new for-sale + rental construction is in the pipeline within 1–3 miles? Heavy new supply typically softens prices + rents 12–24 months out; constrained supply supports both.
Investment metrics
- 1% rule
- 0.82% ✗
- Cap rate
- 5.51%
- Cash-on-cash
- -2.79%
- DSCR
- 0.88
- GRM
- 10.2
CMA / ARV
- ARV (median comp)
- $269,990
- List price
- $255,990
- Delta
- -5.19%
- Verdict
- FAIR
- Comps
- 20 within 1.0 mi
Show comp detail 12 sales within ~0.75 mi
| Address | Dist | Beds/Ba | Sqft | Sold | Price | $/sf | Match |
|---|---|---|---|---|---|---|---|
| 809 Landon Way | 0.05mi | 3/2.0 | 1,335 (0%) | 1mo | $257,490 | $193 | 97 |
| 2803 Parkside Trl | 0.09mi | 3/2.0 | 1,335 (0%) | 2mo | $256,990 | $193 | 94 |
| 2530 Midfield Way | 0.44mi | 3/2.0 | 1,330 (-0%) | 2mo | $234,990 | $177 | 77 |
| 2722 Parkside Trl | 0.06mi | 3/2.0 | 1,532 (+15%) | 1mo | $269,990 | $176 | 72 |
| 901 Landon Way | 0.05mi | 3/2.0 | 1,532 (+15%) | 2mo | $264,990 | $173 | 71 |
| 1304 Hopes Lake Dr | 0.65mi | 3/2.0 | 1,352 (+1%) | 1mo | $269,490 | $199 | 67 |
| 2523 Midfield Way | 0.47mi | 3/2.0 | 1,250 (-6%) | 2mo | $229,490 | $184 | 65 |
| 1223 Hopes Lake Dr | 0.69mi | 3/2.0 | 1,352 (+1%) | 1mo | $269,490 | $199 | 65 |
| 2514 Midfield Way | 0.46mi | 3/2.0 | 1,438 (+8%) | 2mo | $239,990 | $167 | 64 |
| 2515 Midfield Way | 0.48mi | 3/2.0 | 1,204 (-10%) | 2mo | $238,190 | $198 | 59 |
| 2518 Midfield Way | 0.45mi | 3/2.0 | 1,512 (+13%) | 1mo | $252,550 | $167 | 56 |
| 1445 Kinsdale Dr | 0.75mi | 3/2.0 | 1,428 (+7%) | 1mo | $244,990 | $172 | 53 |
Match score weights: distance 35% · size 25% · config 20% · recency 20%. Top-matched comps best support the ARV.
Projected returns pro-forma
-3.0% appreciation · 0.0% rent growth · sell at horizon
- IRR
- -24.4%
- Equity multiple
- 0.19×
- Total profit
- $-58,169
- Equity at exit
- $38,169
- IRR
- -32.5%
- Equity multiple
- -0.22×
- Total profit
- $-87,796
- Equity at exit
- $22,133
Cash invested: $71,677 (down + closing). Projections, not guarantees.
Landlord ↔ Tenant lean methodology
- Overall (STATE)
- 87 Strongly Landlord-Friendly
- State Texas
- 87 Strongly Landlord-Friendly · R+5
- County
- — inherits STATE
- City
- — inherits STATE
ZIP-level market 75407
- Home prices YoY
- -30.3%
- Rents YoY
- -1.0%
- Active inventory
- 1404
- Price-to-rent
- 10.2×
Monthly cashflow live
- Estimated rent
- $2,097 high interval (Pro) →
- Mortgage (P&I)
- −$1,342
- Tax est. 1.5%
- −$320 /mo · $3,840/yr
- Insurance
- −$107
- HOA
- −$54
- Vacancy / Maint / Mgmt
- −$440
- Net cashflow
- $-167
Break-even live
UW: 25.0% down · 7.5% · 30yr · 1.5% tax · 5.0% vac · 8.0% maint · 8.0% mgmt
Financing live
Cash to close
- Down payment
- $63,998
- Closing costs
- $7,680
- Reserves months
- —
- Total cash needed
- —
Loan-product check · same deal, 3 products live
Conventional
25% down · 7.5% · 30yr
- Down + closing
- —
- Monthly P&I
- —
- Monthly cashflow
- —
- DSCR
- —
- Eligible?
- —
Personal DTI + credit; lowest rate.
DSCR
20% down · 8.5% · 30yr
- Down + closing
- —
- Monthly P&I
- —
- Monthly cashflow
- —
- DSCR
- —
- Eligible?
- —
No personal income docs; deal must DSCR.
Hard money
10% down · 12.0% · 12mo
- Down + closing
- —
- Monthly P&I
- —
- Monthly cashflow
- —
- DSCR
- —
- Eligible?
- —
Short-term bridge; refi at stabilization.
Rent comps 16 comps
| Address | Beds | Baths | Sqft | Rent | $/sqft | DOM | Units | Dist |
|---|---|---|---|---|---|---|---|---|
| 2440 Limerick Dr Princeton, TX | 4.0 | 2.0 | 1783 | $1,998 | $1.12 | 24d | 1 | 0.53mi |
| 1008 Honey Maple St Princeton, TX | 4.0 | 2.0 | 1825 | $1,995 | $1.09 | 24d | 1 | 0.97mi |
| 1006 Honey Maple St Princeton, TX | 4.0 | 2.0 | 1842 | $1,950 | $1.06 | 43d | 1 | 0.98mi |
| 1412 Chestnut Cove Dr Princeton, TX | 3.0 | 2.0 | 1633 | $2,000 | $1.22 | 20d | 1 | 1.08mi |
| 2230 Currents Rd Princeton, TX | 3.0 | 2.0 | 1836 | $2,099 | $1.14 | 43d | 1 | 1.13mi |
| 627 Willow View Way Princeton, TX | 4.0 | 2.0 | 1664 | $2,000 | $1.20 | 43d | 1 | 1.26mi |
| 603 Smokey Trl Princeton, TX | 3.0 | 2.0 | 1622 | $2,100 | $1.29 | 18d | 1 | 1.36mi |
| 611 Saddle Club Way Princeton, TX | 4.0 | 2.0 | 1828 | $2,100 | $1.15 | 43d | 1 | 1.37mi |
| 513 Spur Rdg Princeton, TX | 3.0 | 2.0 | 1622 | $2,200 | $1.36 | 17d | 1 | 1.40mi |
| 604 Saddle Club Way Princeton, TX | 4.0 | 2.0 | 1592 | $2,050 | $1.29 | 43d | 1 | 1.41mi |
| 1208 Sequoia Ln Princeton, TX | 4.0 | 2.0 | 1828 | $2,000 | $1.09 | 43d | 1 | 1.42mi |
| 1242 Tupelo Trl Princeton, TX | 3.0 | 2.0 | 1600 | $1,800 | $1.12 | 24d | 1 | 1.44mi |
| 1230 Cherry Bark Dr Princeton, TX | 3.0 | 2.0 | 1436 | $1,925 | $1.34 | 7d | 1 | 1.45mi |
| 508 Poplar St Princeton, TX | 4.0 | 2.0 | 1835 | $1,995 | $1.09 | 16d | 1 | 1.45mi |
| 1205 Catclaw Rd Princeton, TX | 3.0 | 2.0 | 1474 | $1,900 | $1.29 | 43d | 1 | 1.47mi |
| 1201 Catclaw Rd Princeton, TX | 4.0 | 2.0 | 1774 | $1,900 | $1.07 | 43d | 1 | 1.49mi |
HOA detail
- Monthly dues
- $54 · $648/yr
Listing history 16 events
-
2026-06-18status $255,990 Pending 56 DOM
-
2026-06-18days on market $255,990 Active 56 DOM
-
2026-06-17days on market $255,990 Active 55 DOM
-
2026-06-16days on market $255,990 Active 54 DOM
-
2026-06-15days on market $255,990 Active 53 DOM
-
2026-06-13days on market $255,990 Active 51 DOM
-
2026-06-13days on market $255,990 Active 50 DOM
-
2026-06-09days on market $255,990 Active 47 DOM
-
2026-06-08days on market $255,990 Active 46 DOM
-
2026-06-07days on market $255,990 Active 45 DOM
-
2026-06-04days on market $255,990 Active 42 DOM
-
2026-06-03days on market $255,990 Active 41 DOM
-
2026-06-02days on market $255,990 Active 40 DOM
-
2026-06-01days on market $255,990 Active 39 DOM
-
2026-05-31days on market $255,990 Active 38 DOM
-
2026-04-23$255,990 Active 729-char remark
ⓘ Source: listings_history table (triggers on properties + properties_extension) + one-shot
backfill from property_details.listing_events for pre-trigger history.
Climate risk First Street
- Flood 1/10 Low FEMA zone X (unshaded) · 0% chance over 30 yrs
- Wildfire 4/10 Moderate
- Heat 7/10 Severe 6 d/yr ≥111°F today · 19 d/yr by 30 yrs out
- Wind 6/10 Major 27% chance of damaging wind over 30 yrs
- Air quality 3/10 Moderate 3 unhealthy d/yr today · 3 by 30 yrs out
Nearby sold comps map
Loading sold comps map…
Walkable amenities ~0.75 mi
Loading nearby amenities…
Taxation est. · year 1
- Rental income
- $25,163
- − Mortgage interest
- −$14,339
- − Property taxes
- −$3,840
- − Insurance
- −$1,280
- − Repairs & maintenance
- −$2,013
- − Management
- −$2,013
- − HOA
- −$648
- − Depreciation
- −$7,447
- Taxable loss
- −$6,417
- Est. tax savings @ 24.0%
- +$1,540
- After-tax cash flow
- $-458/yr
For passive investors: Depreciation is non-cash, so a rental often shows a tax loss while cash-flowing — sheltering income. Rental losses are passive: they offset passive income freely, and up to $25,000/yr can offset ordinary (W-2) income if you actively participate and your MAGI is under $100k (phasing out to $0 by $150k); unused losses carry forward. On sale, claimed depreciation is recaptured at up to 25%, and gains may owe capital-gains tax (a 1031 exchange can defer both). Figures are a year-1 estimate at your 24.0% rate — not tax advice; consult a CPA.
Condition & rehab AI · 6 photos
This home is in excellent condition with a modern kitchen and well-maintained exterior. It has the potential to be a move-in-ready property with minor updates to the exterior and interior aesthetics.
Value-add opportunities
- Both Painting the exterior and interior walls — Fresh paint can enhance curb appeal and interior aesthetics.
- Both Landscaping improvements — Enhanced landscaping can increase curb appeal and property value.
- Both Adding smart home features — Smart home features can increase property value and attract tech-savvy buyers/tenants.
- Both Upgrading the kitchen appliances — Modern appliances can make the kitchen more functional and appealing to potential buyers/tenants.
Renovation cost estimate screening
Value-add ROI direction
- Both Painting the exterior and interior walls — Fresh paint can enhance curb appeal and interior aesthetics. ↑
- Both Landscaping improvements — Enhanced landscaping can increase curb appeal and property value. ↑
- Both Adding smart home features — Smart home features can increase property value and attract tech-savvy buyers/tenants. ↑
- Both Upgrading the kitchen appliances — Modern appliances can make the kitchen more functional and appealing to potential buyers/tenants. ↑
ⓘ Cost ranges are severity-bucket heuristics (US national rule-of-thumb). Get contractor quotes + a written scope before underwriting a rehab budget.
Schools (NCES district)
- District
- Princeton ISD
- NCES district ID
- 4835850
- Math proficiency
- 51% ▼ -8.00%
- Reading proficiency
- 47% ▬ 0.00%
- Median HH income
- $54,827
- Composite
- 42.44/100
- National rank
- #3226
- State rank
- #188 of 826 in TX
Livability — Lowry Crossing
- Score
- 65/100
- State rank
- #718
- US rank
- #13398
Category grades
Schools grade is shown separately in the Schools card above.
Census & demographics
- County
- Collin County · 1,159,394 people
- Metro
- Dallas-Fort Worth-Arlington, TX
- Population (ZIP)
- 34,171
- Household income
- $100,037
- Rent vs Own
- Severe rent burden
- 368.0
Population outlook (Collin County) Hauer SSP2
- Today (2025)
- 1,210,074 people
- By 2030
- 1,358,201 · +12.2%
- By 2040
- 1,654,061 · +36.7%
- By 2050
- 1,937,359 · +60.1%
- By 2075
- 2,567,039 · +112.1%
- By 2100
- 2,952,048 · +144.0%
Race, ethnicity, and origin ACS 2023
- Neighborhood character
- Diverse neighborhood (Simpson 0.66)
- Race & ethnicity
- White 47% Hispanic / Latino 30% Black 17% Two or more races 10% Asian 4% Native American 1%
- Hispanic origin (detail)
- Mexican 26%
- Common ancestry
- Lithuanian 2% Romanian 1% Russian 1%
- Foreign-born
- 15% · Canada, China, Mexico
- Languages at home
- 70% English-only · Spanish 22% Other Indo-European 2% Other Asian/Pacific 1%
Political lean MEDSL · Collin
- 2024 margin
- R (+11.1) · D 43.1% · R 54.3% · Other 2.6%
- 2008→2024 swing
- +14.4pp toward D · 2008: -25.6pp · 2024: -11.1pp
- All cycles
- 2024: R+11.1 2020: R+4.3 2016: R+17.0 2012: R+31.6 2008: R+25.6
Not yet ingested
- Civics
- —
Market trends
- HPI YoY
- ▼ -103.99%
- Current HPI
- 238.9373
- Rent YoY
- ▼ -1.02%
- Metro
- Dallas-Fort Worth-Arlington, TX
- State GDP YoY
- ▲ 3.95%
- F500 in state
- 110
Industry mix (Fortune 500 HQ in TX)
| Industry | F500 HQs | Revenue |
|---|---|---|
| Energy | 16 | $1,198B |
|
||
| Technology | 5 | $198B |
|
||
| Engineering / Construction | 4 | $72B |
|
||
| Energy Services | 3 | $60B |
|
||
| Utilities | 3 | $41B |
|
||
| Healthcare | 2 | $330B |
|
||
Price history
2 events — show timeline
- 2026-06-18 Pending — NTREIS
- 2026-04-23 Listed $255,990 NTREIS
Cash-flow waterfall
monthlySold comps — $/sqft
last 12 mo · ≤1 miLoading sold comps…