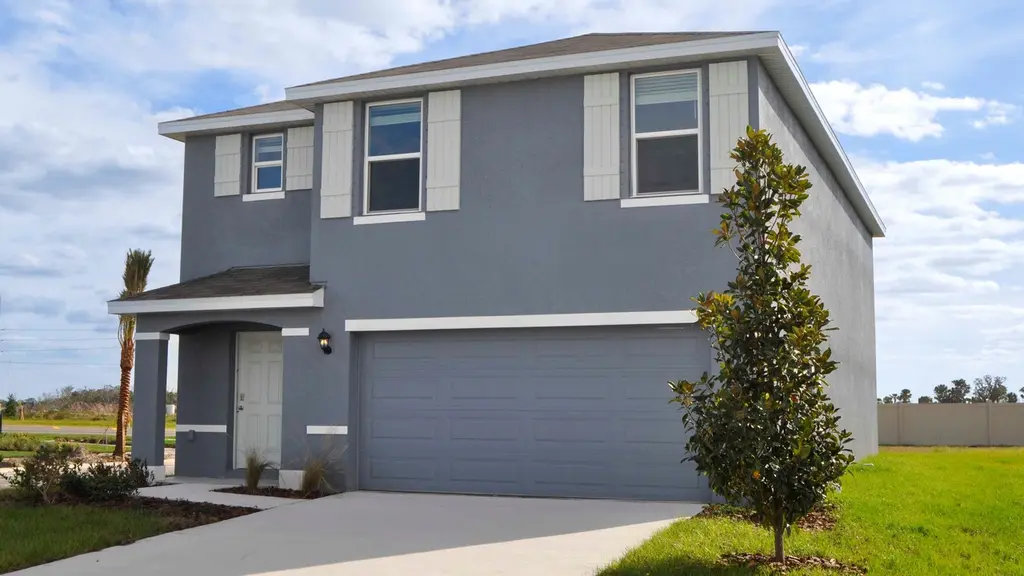
 🏗️ New Construction
Robie Plan · Ruskin, FL
Flood risk 1/10 · Minimal
- FEMA flood zone
- X (unshaded)
- Chance of flooding over 30 yrs
- 0.0%
- Est. flood insurance / yr
- $507 – $1,088
Fire risk 5/10 · Moderate
- Est. fire insurance / yr
- $947 – $1,759
Heat risk 10/10 · Severe
- Hot days now (above 108°F)
- 7 days/yr
- Hot days in 30 yrs
- 28 days/yr
Wind risk 10/10 · Severe
- Chance of severe wind over 30 yrs
- 99.0%
Air-quality risk 3/10 · Minor
- Unhealthy air days now
- 3 days/yr
- Unhealthy air days in 30 yrs
- 3 days/yr
Risk factors via First Street. Map © Google.
Why this score? — see what drove the D- grade
The composite is a weighted blend of 9 inputs, each scored 0–100. Each bar is that input's sub-score; the figure is the points it added to the 100-point composite (weight × sub-score).
- Cash flow +11.8/30.0
- ARV discount +7.5/15.0
- Schools +4.4/10.0
- Livability +3.6/5.0
- DSCR +3.5/10.0
- 1% rule +3.4/10.0
- Condition / age +2.5/5.0
- Rent growth +2.3/5.0
- Appreciation +0.0/10.0
$377,990
🖨 Deal sheet (PDF) 📄 Offer letter ✓ Due diligence
Key facts
- 2 garage spots
- Listed 964 days
Property features AI
Finance
- Financial info: List price $376,990
Exterior
- Parking: 2 total parking spaces; 2-car garage
- Home design: Single-family plan home; Listed as new construction (Plan)
Interior
- Bedrooms: 5 bedrooms
- Bathrooms: 3 full bathrooms
- Interior features: Plan home (Robie plan); Living area 2447
Neighborhood map
What this means for you Summary
Snapshot
- This is a 5-bed/3.0-bath single-family listed at $378k.
Deal economics
- At list price, monthly cash flow is $-107 ($-1k/yr) — negative.
- To cash-flow at today's rent, offer at most $364k (3.7% below list).
- To meet the 1% rule (rent ≥ 1% of price), the offer needs to be $318k (15.8% below list).
- Recommended offer: $318k (15.8% below list) — sets the bar for 1% rule.
- Cap rate 6.0% vs local median 4.7% in Ruskin — meaningfully above typical; check what's discounted (condition, days-on-market, listing class) to confirm the premium yield is real.
Location & tenants
- Location reads 71/100 on livability (#392 in FL) — a middle-class / working-renter tenant base. Strengths: cost of living A+, housing A+, commute B+; Watch: amenities F, health & safety F.
- Manatee (suburban): math 54% / reading 50% proficiency, ranked #26 of 73 in FL (top 36%) — acceptable for families but not a draw, mixed tenant base, ~2y average lease.
- Zoned schools: Virgil Mills Elementary School (math 69% / reading 65%, grade B+, #450 of 2,144 statewide, top 22%, 818 students, 43% FRL); Buffalo Creek Middle School (math 59% / reading 51%, grade B-, #180 of 571 statewide, top 32%, 1,127 students, 44% FRL); Palmetto High School (math 22% / reading 36%, grade F, #456 of 667 statewide, top 68%, 2,100 students, 61% FRL) — zoned schools at 50% FRL track the district average.
- Market conditions: Rents soft (-0.9%/yr); 2204 active listings in the ZIP; 10 comparable units currently listed for rent nearby; rentals leasing fast (median 13d on market — plan ~1-2 weeks tenant-placement turnaround); high-income renter base; 7,472 units permitted in Manatee County in 2024 (1,782 in 5+ unit buildings).
- This rent runs 34% of the median local income ($114k/yr) — at the standard rent-burdened threshold; future hikes will face affordability resistance.
Forward outlook
- Local home prices are declining (-3.0%/yr); year-one equity from $3k of loan paydown is wiped out by about $11k of value loss. Plan a longer hold.
- Manatee County population projected at +43% by 2050 — long-run rental-demand tailwind backs the buy-and-hold thesis.
Negotiation context
- It's been on market 964 days — a 12% lower offer ($333k) is reasonable based on typical stale-listing flexibility.
Risks & watch-outs
- Climate carrying-cost: severe wind risk, 99% chance of damaging wind over 30y; moderate wildfire risk; extreme-heat days projected 7→28/yr by 2055 (HVAC capex compounding) — expect insurance premiums to compound above CPI over the hold.
Questions for the listing agent
- What do current leases actually rent for vs. the listed asking? Can we see a recent rent roll and the last 12 months of T-12 income?
- It's been on market 964 days. Have you received any prior offers? Is the seller open to a 16% concession, seller financing, or rate buy-down credit?
- Why hasn't it sold? Are there any deal-killer items the seller is aware of (foundation, flood, title, zoning, code violations)?
- Is there a deadline driving the sale (1031 exchange, divorce, estate, relocation)? That informs how much negotiation room exists.
- Schools are F-rated, which usually means shorter tenancies and higher turnover. Who's the typical renter profile here, and what's been the actual vacancy rate?
- The area grade is low — what's the realistic commute time and amenity access for the typical tenant pool here? Any planned neighborhood developments (good or bad) we should know about?
- What's the average days-on-market for RENTAL listings here right now (not sales)? A rising rental-DOM trend means longer vacancies and softer asking-rent achievability than the comps imply.
- What's the recent tenant-quality profile in this submarket — average credit score on applications, eviction rate, late-payment / NSF rate, and stable-employment percentage? A property-management company in the area should have these aggregated.
- How much new for-sale + rental construction is in the pipeline within 1–3 miles? Heavy new supply typically softens prices + rents 12–24 months out; constrained supply supports both.
Investment metrics
- 1% rule
- 0.84% ✗
- Cap rate
- 5.96%
- Cash-on-cash
- -1.21%
- DSCR
- 0.95
- GRM
- 9.9
CMA / ARV
- ARV (on-the-fly)
- $379,285
- Comps found
- 12
Show comp detail 12 sales within ~0.75 mi
| Address | Dist | Beds/Ba | Sqft | Sold | Price | $/sf | Match |
|---|---|---|---|---|---|---|---|
| 12127 Kingsley Trl | 0.48mi | 5/3.0 | 2,605 (+6%) | 0mo | $408,000 | $157 | 67 |
| 12105 Mountain Island Trl | 0.63mi | 5/3.0 | 2,605 (+6%) | 3mo | $395,100 | $152 | 57 |
| 12063 Mountain Island Trl | 0.68mi | 5/3.0 | 2,605 (+6%) | 4mo | $376,010 | $144 | 54 |
| 12051 Mountain Island Trl | 0.71mi | 5/3.0 | 2,605 (+6%) | 5mo | $405,000 | $155 | 52 |
| 12154 Mountain Island Trl | 0.59mi | 4/2.5 (-1) | 2,248 (-8%) | 0mo | $375,000 | $167 | 52 |
| 12038 Mountain Island Trl | 0.74mi | 5/3.0 | 2,605 (+6%) | 4mo | $385,000 | $148 | 52 |
| 12035 Mountain Island Trl | 0.75mi | 5/3.0 | 2,605 (+6%) | 3mo | $408,325 | $157 | 52 |
| 12030 Mountain Island Trl | 0.75mi | 5/3.0 | 2,605 (+6%) | 5mo | $409,000 | $157 | 50 |
| 12178 Mountain Island Trl | 0.59mi | 4/2.5 (-1) | 2,260 (-8%) | 3mo | $362,000 | $160 | 50 |
| 10803 Manawa Ter | 0.67mi | 4/3.0 (-1) | 2,756 (+13%) | 4mo | $421,990 | $153 | 40 |
| 12015 Kingsley Trl | 0.67mi | 4/3.0 (-1) | 2,756 (+13%) | 4mo | $407,220 | $148 | 39 |
| 11987 Kingsley Trl | 0.71mi | 4/3.0 (-1) | 2,756 (+13%) | 3mo | $409,000 | $148 | 38 |
Match score weights: distance 35% · size 25% · config 20% · recency 20%. Top-matched comps best support the ARV.
Projected returns pro-forma
-3.0% appreciation · 0.0% rent growth · sell at horizon
- IRR
- -21.7%
- Equity multiple
- 0.27×
- Total profit
- $-77,542
- Equity at exit
- $56,553
- IRR
- -24.9%
- Equity multiple
- -0.06×
- Total profit
- $-112,132
- Equity at exit
- $32,794
Cash invested: $106,200 (down + closing). Projections, not guarantees.
Landlord ↔ Tenant lean methodology
- Overall (STATE)
- 87 Strongly Landlord-Friendly
- State Florida
- 87 Strongly Landlord-Friendly · R+3
- County
- — inherits STATE
- City
- — inherits STATE
ZIP-level market 34219
- Home prices YoY
- -23.7%
- Rents YoY
- -0.9%
- Active inventory
- 2204
- Price-to-rent
- 9.9×
Monthly cashflow live
- Estimated rent
- $3,183 high interval (Pro) →
- Mortgage (P&I)
- −$1,989
- Tax est. 1.5%
- −$474 /mo · $5,689/yr
- Insurance
- −$158
- HOA
- −$0
- Lot rent
- −$0
- Vacancy / Maint / Mgmt
- −$668
- Net cashflow
- $-107
Break-even live
Sensitivity live
| Price | -10% $155 | -5% $24 | +0% $-107 | +5% $-238 | +10% $-369 |
|---|---|---|---|---|---|
| Rent | -10% $-358 | -5% $-233 | +0% $-107 | +5% $19 | +10% $145 |
| Rate | -1.0pp $84 | -0.5pp $-10 | base $-107 | +0.5pp $-205 | +1.0pp $-305 |
UW: 25.0% down · 7.5% · 30yr · 1.5% tax · 5.0% vac · 8.0% maint · 8.0% mgmt
Financing live
Cash to close
- Down payment
- $94,821
- Closing costs
- $11,379
- Reserves months
- —
- Total cash needed
- —
Loan-product check · same deal, 3 products live
Conventional
25% down · 7.5% · 30yr
- Down + closing
- —
- Monthly P&I
- —
- Monthly cashflow
- —
- DSCR
- —
- Eligible?
- —
Personal DTI + credit; lowest rate.
DSCR
20% down · 8.5% · 30yr
- Down + closing
- —
- Monthly P&I
- —
- Monthly cashflow
- —
- DSCR
- —
- Eligible?
- —
No personal income docs; deal must DSCR.
Hard money
10% down · 12.0% · 12mo
- Down + closing
- —
- Monthly P&I
- —
- Monthly cashflow
- —
- DSCR
- —
- Eligible?
- —
Short-term bridge; refi at stabilization.
Rent comps 10 comps
| Address | Beds | Baths | Sqft | Rent | $/sqft | DOM | Units | Dist |
|---|---|---|---|---|---|---|---|---|
| 10832 Charlotte Dr Parrish, FL | 5.0 | 3.0 | 2964 | $2,899 | $0.98 | 14d | 1 | 0.18mi |
| 12456 Nantahala Run Parrish, FL | 4.0 | 2.5 | 2045 | $2,699 | $1.32 | 0d | 1 | 0.23mi |
| 10757 Chippewa Dr Parrish, FL | 5.0 | 3.0 | 2605 | $2,995 | $1.15 | 0d | 1 | 0.25mi |
| 11007 Tamarack Pl Unit NA Duette, FL | 4.0 | 3.0 | 2537 | $3,000 | $1.18 | 14d | 1 | 0.41mi |
| 12067 Kingsley Trl Parrish, FL | 4.0 | 2.5 | 2045 | $2,495 | $1.22 | 5d | 1 | 0.55mi |
| 10225 Kalamazoo Pl Unit NA Parrish, FL | 4.0 | 2.5 | 2260 | $2,689 | $1.19 | 13d | 1 | 0.69mi |
| 10225 Kalamazoo Pl Parrish, FL | 4.0 | 2.5 | 2260 | $2,789 | $1.23 | 5d | 1 | 0.69mi |
| 12215 Radiant Gem Trl Parrish, FL | 4.0 | 2.5 | 2584 | $3,000 | $1.16 | 18d | 1 | 1.13mi |
| 12227 Radiant Gem Trl Parrish, FL | 5.0 | 3.0 | 3326 | $3,500 | $1.05 | 5d | 1 | 1.16mi |
| 11880 Little River Way Parrish, FL | 4.0 | 2.0 | 1635 | $2,650 | $1.62 | 26d | 1 | 1.49mi |
Listing history 16 events
-
2026-06-22days on market $377,990 Active 964 DOM
-
2026-06-22days on market $377,990 Active 963 DOM
-
2026-06-18days on market $377,990 Active 960 DOM
-
2026-06-17days on market $377,990 Active 959 DOM
-
2026-06-16pricedays on market $377,990 Active 958 DOM
-
2026-06-15days on market $376,990 Active 957 DOM
-
2026-06-13days on market $376,990 Active 955 DOM
-
2026-06-13days on market $376,990 Active 954 DOM
-
2026-06-10days on market $376,990 Active 952 DOM
-
2026-06-09days on market $376,990 Active 951 DOM
-
2026-06-08days on market $376,990 Active 950 DOM
-
2026-06-08days on market $376,990 Active 949 DOM
-
2026-06-03days on market $376,990 Active 945 DOM
-
2026-06-02days on market $376,990 Active 944 DOM
-
2026-06-01days on market $376,990 Active 943 DOM
-
2026-05-31days on market $376,990 Active 942 DOM
ⓘ Source: listings_history table (triggers on properties + properties_extension) + one-shot
backfill from property_details.listing_events for pre-trigger history.
Climate risk First Street
- Flood 1/10 Low FEMA zone X (unshaded) · 0% chance over 30 yrs
- Wildfire 5/10 Major
- Heat 10/10 Extreme 7 d/yr ≥108°F today · 28 d/yr by 30 yrs out
- Wind 10/10 Extreme 99% chance of damaging wind over 30 yrs
- Air quality 3/10 Moderate 3 unhealthy d/yr today · 3 by 30 yrs out
Nearby sold comps map
Loading sold comps map…
Walkable amenities ~0.75 mi
Loading nearby amenities…
Taxation est. · year 1
- Rental income
- $38,193
- − Mortgage interest
- −$21,246
- − Property taxes
- −$5,689
- − Insurance
- −$1,896
- − Repairs & maintenance
- −$3,055
- − Management
- −$3,055
- − Depreciation
- −$11,034
- Taxable loss
- −$7,783
- Est. tax savings @ 24.0%
- +$1,868
- After-tax cash flow
- $586/yr
For passive investors: Depreciation is non-cash, so a rental often shows a tax loss while cash-flowing — sheltering income. Rental losses are passive: they offset passive income freely, and up to $25,000/yr can offset ordinary (W-2) income if you actively participate and your MAGI is under $100k (phasing out to $0 by $150k); unused losses carry forward. On sale, claimed depreciation is recaptured at up to 25%, and gains may owe capital-gains tax (a 1031 exchange can defer both). Figures are a year-1 estimate at your 24.0% rate — not tax advice; consult a CPA.
Schools (NCES district)
- District
- Manatee
- NCES district ID
- 1201230
- Math proficiency
- 54% ▼ -6.00%
- Reading proficiency
- 50% ▼ -2.00%
- Median HH income
- $49,607
- Composite
- 44.43/100
- National rank
- #2806
- State rank
- #26 of 73 in FL
Livability — Ruskin
- Score
- 71/100
- State rank
- #392
- US rank
- #6879
Category grades
Schools grade is shown separately in the Schools card above.
Census & demographics
- County
- Manatee County · 416,364 people
- City population
- 33,319
- Metro
- North Port-Sarasota-Bradenton, FL
- Population (ZIP)
- 33,296
- Household income
- $113,773
- Rent vs Own
- Severe rent burden
- 219.0
Population outlook (Manatee County) Hauer SSP2
- Today (2025)
- 447,342 people
- By 2030
- 488,911 · +9.3%
- By 2040
- 567,934 · +27.0%
- By 2050
- 637,995 · +42.6%
- By 2075
- 781,970 · +74.8%
- By 2100
- 848,272 · +89.6%
Race, ethnicity, and origin ACS 2023
- Neighborhood character
- Predominantly White (75%)
- Race & ethnicity
- White 75% Hispanic / Latino 11% Two or more races 8% Black 8% Asian 2%
- Hispanic origin (detail)
- Mexican 2% Puerto Rican 3%
- Common ancestry
- Romanian 4% Hispanic 2% Russian 2%
- Foreign-born
- 10% · Canada, Dominican Republic, Jamaica
- Languages at home
- 88% English-only · Spanish 7% French/Haitian/Cajun 2% Other Asian/Pacific 1%
Political lean MEDSL · Manatee
- 2024 margin
- Strong R (+23.5) · D 37.9% · R 61.4%
- 2008→2024 swing
- -16.5pp toward R · 2008: -7.0pp · 2024: -23.5pp
- All cycles
- 2024: R+23.5 2020: R+16.1 2016: R+17.1 2012: R+12.5 2008: R+7.0
Not yet ingested
- Civics
- —
Market trends
- HPI YoY
- ▼ -84.45%
- Current HPI
- 271.7131
- Rent YoY
- ▼ -0.95%
- Metro
- North Port-Sarasota-Bradenton, FL
- State GDP YoY
- ▲ 3.28%
- F500 in state
- 36
Industry mix (Fortune 500 HQ in FL)
| Industry | F500 HQs | Revenue |
|---|---|---|
| Industrial Technology | 2 | $29B |
|
||
| Insurance | 2 | $17B |
|
||
| Retail | 1 | $60B |
|
||
| Technology Distribution | 1 | $58B |
|
||
| Homebuilding | 1 | $35B |
|
||
| Technology Manufacturing | 1 | $35B |
|
||
Cash-flow waterfall
monthlySold comps — $/sqft
last 12 mo · ≤1 miLoading sold comps…