 Multi-family
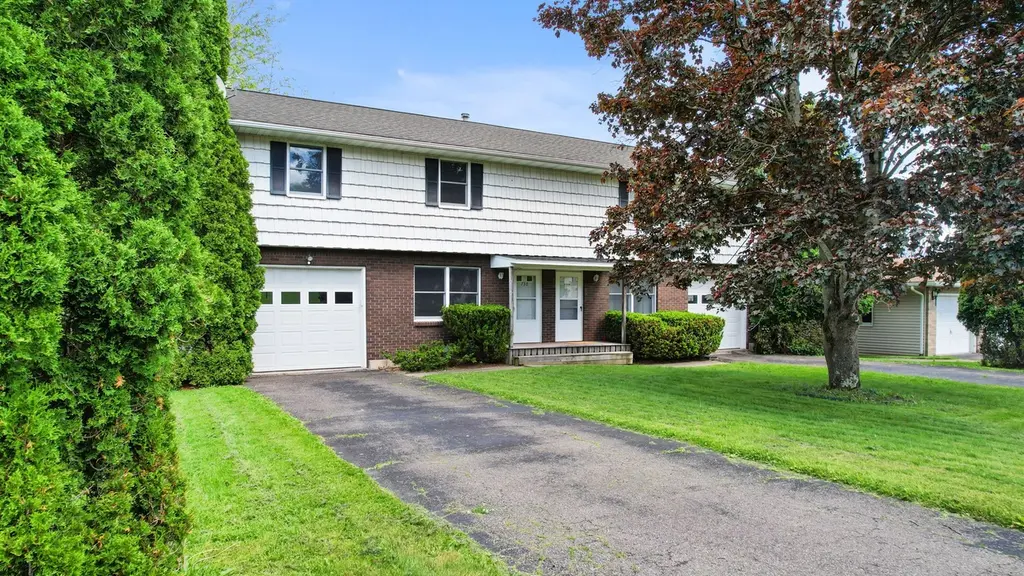
728 Prescott Ave · Endicott, NY
Flood risk 1/10 · Minimal
- FEMA flood zone
- X
- Chance of flooding over 30 yrs
- 0.0%
- Est. flood insurance / yr
- $473 – $860
Fire risk 2/10 · Minimal
- Est. fire insurance / yr
- $691 – $1,283
Heat risk 3/10 · Minor
- Hot days now (above 94°F)
- 7 days/yr
- Hot days in 30 yrs
- 16 days/yr
Wind risk 2/10 · Minimal
- Chance of severe wind over 30 yrs
- 2.0%
Air-quality risk 2/10 · Minimal
- Unhealthy air days now
- 0 days/yr
- Unhealthy air days in 30 yrs
- 1 days/yr
Risk factors via First Street. Map © Google.
Why this score? — see what drove the C+ grade
The composite is a weighted blend of 9 inputs, each scored 0–100. Each bar is that input's sub-score; the figure is the points it added to the 100-point composite (weight × sub-score).
- Cash flow +24.8/30.0
- DSCR +8.0/10.0
- 1% rule +7.8/10.0
- ARV discount +7.5/15.0
- Rent growth +4.3/5.0
- Schools +4.3/10.0
- Livability +3.5/5.0
- Condition / age +2.5/5.0
- Appreciation +0.0/10.0
$299,500
🖨 Deal sheet 📄 Offer letter ✓ Due diligence
Multi-family units
County records classify this as Multi-Family (2-4 Unit). Listing-text estimate: 1 unit. estimate disagrees with records
Listing remarks
Excellent investment opportunity in the heart of Endicott This property is a spacious, well-maintained multi-family property and a proven money maker with strong income potential all located on the north side of Endicott. Enjoy a large rear deck with beautiful views providing the perfect place to relax or entertain. This property features three large bedrooms oversized kitchen, comforting living rooms and one and a half bathrooms. Both have dry basements ideal for storage, separate utilities, and the added convenience of each unit having its own garage. Conveniently located near schools, shopping, restaurants, parks, and major roadways, this versatile property is perfect for owner-occupants
Key facts
- Own garage
- Separate utilities
- Conveniently located
Tags
Property features AI
Exterior
- Parking: Attached 2-car garage
- Utilities: Public water; Public sewer; Cable available
- Home design: Duplex residential income property; Facing with above-grade finished living area; Entry level information not provided
- Construction: Brick and vinyl siding exterior
- Exterior features: Deck; Level lot; Views
Interior
- Kitchen: Gas water heater
- Flooring: Carpet; Tile; Vinyl
- Bathrooms: 2 full bathrooms; 2 half bathrooms
- Heating & cooling: Baseboard heating; No central air
- Interior features: Insulated windows; Storm door(s)
Neighborhood map
What this means for you Summary
Snapshot
- This is a 6-bed/3.0-bath multifamily listed at $300k.
Deal economics
- At list price, monthly cash flow is $631 ($8k/yr) — positive.
- The deal already cash-flows at list — no discount required.
- Meets the 1% rule at list price ($4k rent vs $300k).
- Cap rate 8.8% vs local median 5.5% in Endicott — top-decile yield for the area; either an underpriced asset or a hidden risk that comps aren't pricing in. Stress-test before assuming the spread holds.
Location & tenants
- Location reads 70/100 on livability (#438 in NY) — a middle-class / working-renter tenant base. Strengths: cost of living A+, health & safety A+, housing A; Watch: amenities D, crime F, commute F.
- Union-Endicott Central School District (suburban): math 43% / reading 57% proficiency, ranked #387 of 590 in NY (top 66%) — acceptable for families but not a draw, mixed tenant base, ~2y average lease.
- Zoned schools: George F Johnson Elementary School (math 35% / reading 47%, grade F, #1,410 of 2,108 statewide, top 67%, 596 students, 44% FRL) — zoned schools at 44% FRL track the district average.
- Market conditions: Rents rising fast (+7.1%/yr); 213 active listings in the ZIP; 1 comparable units currently listed for rent nearby; 340 units permitted in Broome County in 2024 (269 in 5+ unit buildings).
- At $3,839/mo this rent would consume 70% of the median local household income ($66k/yr) (locally 1480% of renters already pay >50% of income on rent) — very limited rent-growth headroom before tenants either downsize or default.
Forward outlook
- Local home prices are declining (-3.0%/yr); year-one equity from $2k of loan paydown is wiped out by about $9k of value loss. Plan a longer hold.
- Broome County population projected at -13% by 2050 — secular population decline; favor cash flow + early exit over multi-decade hold.
- At projected returns (-3.0% appreciation + 7.1% rent growth), your $84k cash investment doubles in ~8 years — after that, you're playing with house money.
Negotiation context
- Only 13 days on market — expect competitive offers; lowballing is unlikely to land.
- Current owner paid $105k; list at $300k implies a 185% gain — meaningful room to come down on a strong offer.
Risks & watch-outs
- Watch-outs: property tax is 2.8% of price.
Questions for the listing agent
- Built in 1976 — when were the roof, HVAC, electrical panel, plumbing, and water heater last replaced?
- Property tax is high relative to price — has the assessment been appealed recently, and will the sale trigger a re-assessment?
- Is there a deadline driving the sale (1031 exchange, divorce, estate, relocation)? That informs how much negotiation room exists.
- Schools are D-rated, which usually means shorter tenancies and higher turnover. Who's the typical renter profile here, and what's been the actual vacancy rate?
- Crime grade is F in this area — have there been break-ins, vandalism, or insurance claims at this property in the last 3 years? What carrier currently insures it and at what premium?
- What's the average days-on-market for RENTAL listings here right now (not sales)? A rising rental-DOM trend means longer vacancies and softer asking-rent achievability than the comps imply.
- What's the recent tenant-quality profile in this submarket — average credit score on applications, eviction rate, late-payment / NSF rate, and stable-employment percentage? A property-management company in the area should have these aggregated.
- How much new apartment / multifamily construction is in the pipeline within 1–3 miles? Heavy new supply (>2% of stock underway) typically softens rents 12–24 months out; light construction supports rent growth.
Investment metrics
- 1% rule
- 1.28% ✓
- Cap rate
- 8.82%
- Cash-on-cash
- 9.03%
- DSCR
- 1.40
- GRM
- 6.5
CMA / ARV
- ARV (on-the-fly)
- $193,228
- Comps found
- 5
Show comp detail 5 sales within ~0.75 mi
| Address | Dist | Beds/Ba | Sqft | Sold | Price | $/sf | Match |
|---|---|---|---|---|---|---|---|
| 818 Milan Ave | 0.13mi | 6/3.5 | 2,869 (-0%) | 16mo | $295,000 | $103 | 78 |
| 108 Robble Ave | 0.70mi | 7/4.0 (+1) | 3,012 (+4%) | 3mo | $310,000 | $103 | 48 |
| 819 Pine St | 0.35mi | 5/2.0 (-1) | 2,592 (-10%) | 17mo | $117,000 | $45 | 44 |
| 804 N Mckinley Ave | 0.45mi | 6/3.0 | 2,464 (-15%) | 20mo | $160,000 | $65 | 39 |
| 314 Rogers Ave N | 0.61mi | 5/3.0 (-1) | 2,464 (-15%) | 21mo | $165,000 | $67 | 25 |
Match score weights: distance 35% · size 25% · config 20% · recency 20%. Top-matched comps best support the ARV.
Projected returns pro-forma
-3.0% appreciation · 7.09% rent growth · sell at horizon
- IRR
- 2.5%
- Equity multiple
- 1.10×
- Total profit
- $8,354
- Equity at exit
- $44,656
- IRR
- 16.1%
- Equity multiple
- 2.59×
- Total profit
- $133,512
- Equity at exit
- $25,895
Cash invested: $83,860 (down + closing). Projections, not guarantees.
Landlord ↔ Tenant lean methodology
- Overall (STATE)
- 15 Strongly Tenant-Friendly
- State New York
- 15 Strongly Tenant-Friendly · D+10
- County
- — inherits STATE
- City
- — inherits STATE
ZIP-level market 13760
- Home prices YoY
- -32.7%
- Rents YoY
- 7.1%
- Active inventory
- 213
- Price-to-rent
- 19.5×
Monthly cashflow live
- Estimated rent
- $3,839 high interval (Pro) →
- Mortgage (P&I)
- −$1,571
- Tax from tax record
- −$707 /mo · $8,479/yr
- Insurance
- −$125
- HOA
- −$0
- Vacancy / Maint / Mgmt
- −$806
- Net cashflow
- $631
Break-even live
3-unit breakdown (identical units grouped — click to expand)
| Units | Beds | Baths | Est. rent |
|---|---|---|---|
| 3× units | 2 | 1.5 | $3,840 |
| #1 | 2 | 1.5 | $1,280 |
| #2 | 2 | 1.5 | $1,280 |
| #3 | 2 | 1.5 | $1,280 |
| Total (3 units) | $3,839 | ||
UW: 25.0% down · 7.5% · 30yr · 1.5% tax · 5.0% vac · 8.0% maint · 8.0% mgmt
Financing live
Cash to close
- Down payment
- $74,875
- Closing costs
- $8,985
- Reserves months
- —
- Total cash needed
- —
Loan-product check · same deal, 3 products live
Conventional
25% down · 7.5% · 30yr
- Down + closing
- —
- Monthly P&I
- —
- Monthly cashflow
- —
- DSCR
- —
- Eligible?
- —
Personal DTI + credit; lowest rate.
DSCR
20% down · 8.5% · 30yr
- Down + closing
- —
- Monthly P&I
- —
- Monthly cashflow
- —
- DSCR
- —
- Eligible?
- —
No personal income docs; deal must DSCR.
Hard money
10% down · 12.0% · 12mo
- Down + closing
- —
- Monthly P&I
- —
- Monthly cashflow
- —
- DSCR
- —
- Eligible?
- —
Short-term bridge; refi at stabilization.
Rent comps 1 comps
| Address | Beds | Baths | Sqft | Rent | $/sqft | DOM | Units | Dist |
|---|---|---|---|---|---|---|---|---|
| 409 Milan Ave Endicott, NY | 5.0 | 2.0 | 2240 | $2,350 | $1.05 | 43d | 1 | 0.33mi |
Listing history 13 events
-
2026-06-14statusdays on market $299,500 Pending 13 DOM
-
2026-06-13days on market $299,500 Active 12 DOM
-
2026-06-10days on market $299,500 Active 10 DOM
-
2026-06-09days on market $299,500 Active 9 DOM
-
2026-06-08days on market $299,500 Active 8 DOM
-
2026-06-07days on market $299,500 Active 7 DOM
-
2026-06-05days on market $299,500 Active 4 DOM
-
2026-06-03status $299,500 Active 3 DOM
-
2026-06-02status $299,500 Pending 3 DOM
-
2026-06-01days on market $299,500 Active 3 DOM
-
2026-05-31days on market $299,500 Active 2 DOM
-
2026-05-29$299,500 Active
-
2002-06-28soldstatus $105,000
ⓘ Source: listings_history table (triggers on properties + properties_extension) + one-shot
backfill from property_details.listing_events for pre-trigger history.
Tax reassessment forecast NY · Partial reset (capped growth)
- Current annual tax
- $8,479 · $707/mo
- Projected year-2 tax
- $8,479 · $707/mo
- Expected delta
- $0/yr ($0/mo · 0.0%)
ⓘ Screening estimate from a state-policy table — verify with the county assessor before closing.
Climate risk First Street
- Flood 1/10 Low FEMA zone X · 0% chance over 30 yrs
- Wildfire 2/10 Low
- Heat 3/10 Moderate 7 d/yr ≥94°F today · 16 d/yr by 30 yrs out
- Wind 2/10 Low 2% chance of damaging wind over 30 yrs
- Air quality 2/10 Low 0 unhealthy d/yr today · 1 by 30 yrs out
Nearby sold comps map
Loading sold comps map…
Walkable amenities ~0.75 mi
Loading nearby amenities…
Taxation est. · year 1
- Rental income
- $46,068
- − Mortgage interest
- −$16,777
- − Property taxes
- −$8,479
- − Insurance
- −$1,498
- − Repairs & maintenance
- −$3,685
- − Management
- −$3,685
- − Depreciation
- −$8,713
- Taxable income
- $3,231
- Est. tax owed @ 24.0%
- −$775
- After-tax cash flow
- $6,794/yr
For passive investors: Depreciation is non-cash, so a rental often shows a tax loss while cash-flowing — sheltering income. Rental losses are passive: they offset passive income freely, and up to $25,000/yr can offset ordinary (W-2) income if you actively participate and your MAGI is under $100k (phasing out to $0 by $150k); unused losses carry forward. On sale, claimed depreciation is recaptured at up to 25%, and gains may owe capital-gains tax (a 1031 exchange can defer both). Figures are a year-1 estimate at your 24.0% rate — not tax advice; consult a CPA.
Schools (NCES district)
- District
- Union-Endicott Central School District
- NCES district ID
- 3610710
- Math proficiency
- 43% ▼ -9.00%
- Reading proficiency
- 57% ▲ 11.00%
- Median HH income
- $49,265
- Composite
- 42.66/100
- National rank
- #3176
- State rank
- #387 of 590 in NY
Livability — Endicott
- Score
- 70/100
- State rank
- #438
- US rank
- #7657
Category grades
Schools grade is shown separately in the Schools card above.
Census & demographics
- County
- Broome County · 126,805 people
- City population
- 42,896
- Metro
- Binghamton, NY
- Population (ZIP)
- 42,896
- Household income
- $66,095
- Rent vs Own
- Severe rent burden
- 1480.0
Population outlook (Broome County) Hauer SSP2
- Today (2025)
- 187,989 people
- By 2030
- 183,066 · -2.6%
- By 2040
- 172,228 · -8.4%
- By 2050
- 163,161 · -13.2%
- By 2075
- 153,641 · -18.3%
- By 2100
- 140,851 · -25.1%
Race, ethnicity, and origin ACS 2023
- Neighborhood character
- Predominantly White (84%)
- Race & ethnicity
- White 84% Two or more races 7% Hispanic / Latino 6% Black 4% Asian 2%
- Hispanic origin (detail)
- Puerto Rican 2%
- Common ancestry
- Romanian 6% Lithuanian 2% Slovak 2%
- Foreign-born
- 5% · Canada, China
- Languages at home
- 94% English-only · Spanish 2% Other Indo-European 1% Russian/Polish/Slavic 1%
Political lean MEDSL · Broome
- 2024 margin
- Toss-up / Even · D 50.2% · R 49.8%
- 2008→2024 swing
- -7.6pp toward R · 2008: 8.0pp · 2024: 0.4pp
- All cycles
- 2024: D+0.4 2020: D+3.5 2016: R+3.7 2012: D+4.6 2008: D+8.0
Not yet ingested
- Civics
- —
Market trends
- HPI YoY
- ▼ -131.29%
- Current HPI
- 270.2661
- Rent YoY
- ▲ 7.09%
- Metro
- Binghamton, NY
- State GDP YoY
- ▲ 2.60%
- F500 in state
- 92
Industry mix (Fortune 500 HQ in NY)
| Industry | F500 HQs | Revenue |
|---|---|---|
| Financial Services | 10 | $950B |
|
||
| Consumer Goods | 9 | $162B |
|
||
| Insurance | 4 | $225B |
|
||
| Telecommunications | 2 | $144B |
|
||
| Pharmaceuticals | 2 | $112B |
|
||
| Media / Entertainment | 2 | $69B |
|
||
Price history
+185.2% since first listed2 events — show timeline
- 2026-05-29 Listed $299,500 GBAOR
- 2002-06-28 Sold (Public Records) $105,000 Public Records
Property tax history
+2.0%/yrLatest (2025): $8,479 · +3.7% YoY. Source: county tax records.
Cash-flow waterfall
monthlySold comps — $/sqft
last 12 mo · ≤1 miLoading sold comps…