4742 Bloomfield Rd · Macon-Bibb County, GA
Flood risk 1/10 · Minimal
- FEMA flood zone
- X (unshaded)
- Chance of flooding over 30 yrs
- 0.0%
- Est. flood insurance / yr
- $507 – $1,088
Fire risk 3/10 · Minor
- Est. fire insurance / yr
- $963 – $1,789
Heat risk 6/10 · Moderate
- Hot days now (above 109°F)
- 7 days/yr
- Hot days in 30 yrs
- 17 days/yr
Wind risk 6/10 · Moderate
- Chance of severe wind over 30 yrs
- 66.0%
Air-quality risk 3/10 · Minor
- Unhealthy air days now
- 3 days/yr
- Unhealthy air days in 30 yrs
- 4 days/yr
Risk factors via First Street. Map © Google.
Why this score? — see what drove the C- grade
The composite is a weighted blend of 9 inputs, each scored 0–100. Each bar is that input's sub-score; the figure is the points it added to the 100-point composite (weight × sub-score).
- Cash flow +26.7/30.0
- DSCR +9.2/10.0
- 1% rule +5.9/10.0
- Rent growth +3.8/5.0
- Livability +2.5/5.0
- Condition / age +2.5/5.0
- Schools +1.2/10.0
- ARV discount +0.0/15.0
- Appreciation +0.0/10.0
$90,000
🖨 Deal sheet 📄 Offer letter ✓ Due diligence
Listing remarks MLS
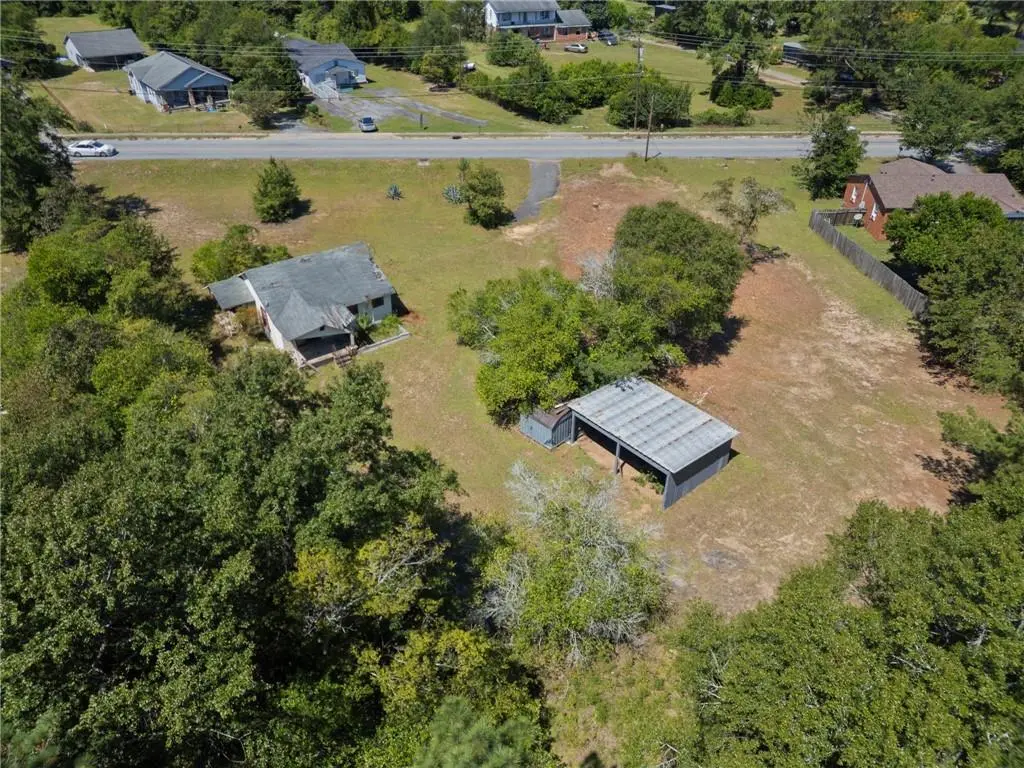
Great potential awaits at 4742 Bloomfield Road. This property is sold as is with no disclosures, making it ideal for investors or buyers ready to renovate. Situated on a generous 3.6-acre lot (156,816 sq ft), the parcel offers room to split and build a second home - use part of the land now and develop the rest later.
Key facts
- Room to split
- Generous lot
- Build a second home
Tags
Neighborhood map
What this means for you Summary
Snapshot
- This is a 2-bed/1.0-bath single-family listed at $90k.
Deal economics
- At list price, monthly cash flow is $244 ($3k/yr) — positive.
- The deal already cash-flows at list — no discount required.
- Meets the 1% rule at list price ($985 rent vs $90k).
- Recommended offer: $79k (12.0% below list) — sets the bar for market timing.
- Cap rate 9.5% vs local median 5.4% in Macon-Bibb County — top-decile yield for the area; either an underpriced asset or a hidden risk that comps aren't pricing in. Stress-test before assuming the spread holds.
Location & tenants
- Location reads: area grade C — affects rentability + tenant quality, not the cash-flow math above.
- Bibb County (urban): math 11% / reading 18% proficiency, ranked #161 of 174 in GA (top 92%) — low school quality limits family demand, transient renter base, plan for 1-2y turnover; 75% free/reduced lunch — lower-income household profile, screen leases tightly.
- Market conditions: Rents rising fast (+5.0%/yr); 207 active listings in the ZIP; 9 comparable units currently listed for rent nearby; rentals lingering (median 44d on market — plan ~5-8 weeks vacancy on turnover, expect pricing pressure); 56% of comp listings sitting > 30 days — soft ceiling on asking rent; lower-income renter base — watch delinquency; 154 units permitted in Bibb County in 2024 (0 in 5+ unit buildings).
- This rent runs 39% of the median local income ($30k/yr) — at the standard rent-burdened threshold; future hikes will face affordability resistance.
Forward outlook
- Local home prices are declining (-3.0%/yr); year-one equity from $622 of loan paydown is wiped out by about $3k of value loss. Plan a longer hold.
- Bibb County population projected at -12% by 2050 — secular population decline; favor cash flow + early exit over multi-decade hold.
- At projected returns (-3.0% appreciation + 5.0% rent growth), your $25k cash investment doubles in ~9 years — after that, you're playing with house money.
Negotiation context
- It's been on market 266 days — a 12% lower offer ($79k) is reasonable based on typical stale-listing flexibility.
- 3 sale attempts since 5y ago; this cycle's ask has dropped $40k (31%) from the opening price — seller is motivated, your offer sets the floor, not the list.
- Current owner paid $22k; list at $90k implies a 309% gain — meaningful room to come down on a strong offer.
Risks & watch-outs
- Watch-outs: built in 1948 — expect roof / HVAC / electrical / plumbing capex.
- Climate carrying-cost: major wind risk, 66% chance of damaging wind over 30y; extreme-heat days projected 7→17/yr by 2055 (HVAC capex compounding) — expect insurance premiums to compound above CPI over the hold.
Questions for the listing agent
- It's been on market 266 days. Have you received any prior offers? Is the seller open to a 12% concession, seller financing, or rate buy-down credit?
- Built in 1948 — when were the roof, HVAC, electrical panel, plumbing, and water heater last replaced?
- Why hasn't it sold? Are there any deal-killer items the seller is aware of (foundation, flood, title, zoning, code violations)?
- Is there a deadline driving the sale (1031 exchange, divorce, estate, relocation)? That informs how much negotiation room exists.
- What's the average days-on-market for RENTAL listings here right now (not sales)? A rising rental-DOM trend means longer vacancies and softer asking-rent achievability than the comps imply.
- What's the recent tenant-quality profile in this submarket — average credit score on applications, eviction rate, late-payment / NSF rate, and stable-employment percentage? A property-management company in the area should have these aggregated.
- How much new for-sale + rental construction is in the pipeline within 1–3 miles? Heavy new supply typically softens prices + rents 12–24 months out; constrained supply supports both.
Investment metrics
- 1% rule
- 1.09% ✓
- Cap rate
- 9.54%
- Cash-on-cash
- 11.60%
- DSCR
- 1.52
- GRM
- 7.6
CMA / ARV
- ARV (median comp)
- $76,325
- List price
- $90,000
- Delta
- 17.92%
- Verdict
- OVERPRICED
- Comps
- 20 within 1.0 mi
Show comp detail 2 sales within ~0.75 mi
| Address | Dist | Beds/Ba | Sqft | Sold | Price | $/sf | Match |
|---|---|---|---|---|---|---|---|
| 4167 Pershing Ave | 0.42mi | 3/1.0 (+1) | 762 (-3%) | 7mo | $92,000 | $121 | 64 |
| 4229 Lafayette Dr | 0.61mi | 3/1.0 (+1) | 828 (+6%) | 12mo | $70,000 | $85 | 48 |
Match score weights: distance 35% · size 25% · config 20% · recency 20%. Top-matched comps best support the ARV.
Projected returns pro-forma
-3.0% appreciation · 5.03% rent growth · sell at horizon
- IRR
- 3.0%
- Equity multiple
- 1.12×
- Total profit
- $2,947
- Equity at exit
- $13,419
- IRR
- 14.2%
- Equity multiple
- 2.24×
- Total profit
- $31,170
- Equity at exit
- $7,782
Cash invested: $25,200 (down + closing). Projections, not guarantees.
Landlord ↔ Tenant lean methodology
- Overall (STATE)
- 90 Strongly Landlord-Friendly
- State Georgia
- 90 Strongly Landlord-Friendly · R+3
- County
- — inherits STATE
- City
- — inherits STATE
ZIP-level market 31206
- Rents YoY
- 5.0%
- Active inventory
- 207
- Price-to-rent
- 7.6×
Monthly cashflow live
- Estimated rent
- $985 high interval (Pro) →
- Mortgage (P&I)
- −$472
- Tax from tax record
- −$25 /mo · $302/yr
- Insurance
- −$38
- HOA
- −$0
- Vacancy / Maint / Mgmt
- −$207
- Net cashflow
- $244
Break-even live
UW: 25.0% down · 7.5% · 30yr · 1.5% tax · 5.0% vac · 8.0% maint · 8.0% mgmt
Financing live
Cash to close
- Down payment
- $22,500
- Closing costs
- $2,700
- Reserves months
- —
- Total cash needed
- —
Loan-product check · same deal, 3 products live
Conventional
25% down · 7.5% · 30yr
- Down + closing
- —
- Monthly P&I
- —
- Monthly cashflow
- —
- DSCR
- —
- Eligible?
- —
Personal DTI + credit; lowest rate.
DSCR
20% down · 8.5% · 30yr
- Down + closing
- —
- Monthly P&I
- —
- Monthly cashflow
- —
- DSCR
- —
- Eligible?
- —
No personal income docs; deal must DSCR.
Hard money
10% down · 12.0% · 12mo
- Down + closing
- —
- Monthly P&I
- —
- Monthly cashflow
- —
- DSCR
- —
- Eligible?
- —
Short-term bridge; refi at stabilization.
Rent comps 9 comps
| Address | Beds | Baths | Sqft | Rent | $/sqft | DOM | Units | Dist |
|---|---|---|---|---|---|---|---|---|
| 4995 Bloomfield Rd Macon, GA | 2.0 | 1.5 | 900 | $997 | $1.11 | 21d | 1 | 0.32mi |
| 4406 Chambers Rd Unit B-06 Macon, GA | 2.0 | 1.0 | 925 | $899 | $0.97 | 44d | 1 | 0.72mi |
| 4406 Chambers Rd Apt E16 Macon, GA | 2.0 | 1.0 | 925 | $899 | $0.97 | 21d | 1 | 0.72mi |
| 4069 Blair Ct Macon, GA | 3.0 | 1.0 | 864 | $850 | $0.98 | 44d | 1 | 0.82mi |
| 5161 Nisbet Dr Macon, GA | 2.0 | 1.5 | 1040 | $975 | $0.94 | 44d | 1 | 0.83mi |
| 1655 N Atwood Dr Unit 5 Macon, GA | 1.0 | 1.0 | 750 | $850 | $1.13 | 21d | 1 | 1.12mi |
| 3645 Mercer University Dr Macon, GA | 1.0–2.0 | 1.0 | 874 | $850 | $0.97 | 44d | 4 | 1.21mi |
| 5487 Bloomfield Rd Macon, GA | 3.0 | 2.0 | 1050 | $1,200 | $1.14 | 21d | 1 | 1.26mi |
| 1835 Bethlea Ave Macon, GA | 2.0 | 1.0 | 800 | $900 | $1.12 | 44d | 1 | 1.35mi |
Listing history 26 events
-
2026-06-19days on market $90,000 Active 266 DOM
-
2026-06-18days on market $90,000 Active 265 DOM
-
2026-06-17days on market $90,000 Active 264 DOM
-
2026-06-16days on market $90,000 Active 263 DOM
-
2026-06-15days on market $90,000 Active 262 DOM
-
2026-06-14days on market $90,000 Active 260 DOM
-
2026-06-13days on market $90,000 Active 259 DOM
-
2026-06-10days on market $90,000 Active 257 DOM
-
2026-06-09days on market $90,000 Active 256 DOM
-
2026-06-09days on market $90,000 Active 255 DOM
-
2026-06-07days on market $90,000 Active 254 DOM
-
2026-06-03days on market $90,000 Active 250 DOM
-
2026-06-02days on market $90,000 Active 249 DOM
-
2026-06-01days on market $90,000 Active 248 DOM
-
2026-05-31days on market $90,000 Active 247 DOM
-
2026-05-30days on market $90,000 Active 246 DOM
-
2026-01-21price $90,000 319-char remark
Show marketing remark (325 chars)
Great potential awaits at 4742 Bloomfield Road. This property is sold as is with no disclosures, making it ideal for investors or buyers ready to renovate. Situated on a generous 3.6-acre lot (156,816 sq ft), the parcel offers room to split and build a second home — use part of the land now and develop the rest later.
-
2026-01-21price $90,000 325-char remark
Show marketing remark (325 chars)
Great potential awaits at 4742 Bloomfield Road. This property is sold as is with no disclosures, making it ideal for investors or buyers ready to renovate. Situated on a generous 3.6-acre lot (156,816 sq ft), the parcel offers room to split and build a second home — use part of the land now and develop the rest later.
-
2025-11-14price $99,000 319-char remark
Show marketing remark (325 chars)
Great potential awaits at 4742 Bloomfield Road. This property is sold as is with no disclosures, making it ideal for investors or buyers ready to renovate. Situated on a generous 3.6-acre lot (156,816 sq ft), the parcel offers room to split and build a second home — use part of the land now and develop the rest later.
-
2025-11-14price $99,000 325-char remark
Show marketing remark (325 chars)
Great potential awaits at 4742 Bloomfield Road. This property is sold as is with no disclosures, making it ideal for investors or buyers ready to renovate. Situated on a generous 3.6-acre lot (156,816 sq ft), the parcel offers room to split and build a second home — use part of the land now and develop the rest later.
-
2025-10-22price $124,500 319-char remark
Show marketing remark (325 chars)
Great potential awaits at 4742 Bloomfield Road. This property is sold as is with no disclosures, making it ideal for investors or buyers ready to renovate. Situated on a generous 3.6-acre lot (156,816 sq ft), the parcel offers room to split and build a second home — use part of the land now and develop the rest later.
-
2025-10-22price $124,500 325-char remark
Show marketing remark (325 chars)
Great potential awaits at 4742 Bloomfield Road. This property is sold as is with no disclosures, making it ideal for investors or buyers ready to renovate. Situated on a generous 3.6-acre lot (156,816 sq ft), the parcel offers room to split and build a second home — use part of the land now and develop the rest later.
-
2025-09-26$129,500 New 319-char remark
Show marketing remark (325 chars)
Great potential awaits at 4742 Bloomfield Road. This property is sold as is with no disclosures, making it ideal for investors or buyers ready to renovate. Situated on a generous 3.6-acre lot (156,816 sq ft), the parcel offers room to split and build a second home — use part of the land now and develop the rest later.
-
2025-09-26$129,500 Active 325-char remark
Show marketing remark (325 chars)
Great potential awaits at 4742 Bloomfield Road. This property is sold as is with no disclosures, making it ideal for investors or buyers ready to renovate. Situated on a generous 3.6-acre lot (156,816 sq ft), the parcel offers room to split and build a second home — use part of the land now and develop the rest later.
-
2021-11-22soldstatus $22,000
-
2021-11-05$25,000
ⓘ Source: listings_history table (triggers on properties + properties_extension) + one-shot
backfill from property_details.listing_events for pre-trigger history.
Tax reassessment forecast GA · Resets to sale price
- Current annual tax
- $302 · $25/mo
- Projected year-2 tax
- $828 · $69/mo
- Expected delta
- +$526/yr (+$44/mo · 173.7%)
ⓘ Screening estimate from a state-policy table — verify with the county assessor before closing.
Climate risk First Street
- Flood 1/10 Low FEMA zone X (unshaded) · 0% chance over 30 yrs
- Wildfire 3/10 Moderate
- Heat 6/10 Major 7 d/yr ≥109°F today · 17 d/yr by 30 yrs out
- Wind 6/10 Major 66% chance of damaging wind over 30 yrs
- Air quality 3/10 Moderate 3 unhealthy d/yr today · 4 by 30 yrs out
Nearby sold comps map
Loading sold comps map…
Walkable amenities ~0.75 mi
Loading nearby amenities…
Taxation est. · year 1
- Rental income
- $11,822
- − Mortgage interest
- −$5,041
- − Property taxes
- −$302
- − Insurance
- −$450
- − Repairs & maintenance
- −$946
- − Management
- −$946
- − Depreciation
- −$2,618
- Taxable income
- $1,519
- Est. tax owed @ 24.0%
- −$364
- After-tax cash flow
- $2,559/yr
For passive investors: Depreciation is non-cash, so a rental often shows a tax loss while cash-flowing — sheltering income. Rental losses are passive: they offset passive income freely, and up to $25,000/yr can offset ordinary (W-2) income if you actively participate and your MAGI is under $100k (phasing out to $0 by $150k); unused losses carry forward. On sale, claimed depreciation is recaptured at up to 25%, and gains may owe capital-gains tax (a 1031 exchange can defer both). Figures are a year-1 estimate at your 24.0% rate — not tax advice; consult a CPA.
Schools (NCES district)
- District
- Bibb County
- NCES district ID
- 1300420
- Math proficiency
- 11% ▼ -14.00%
- Reading proficiency
- 18% ▼ -11.00%
- Median HH income
- $37,426
- Composite
- 12.13/100
- National rank
- #9654
- State rank
- #161 of 174 in GA
Livability — Macon-Bibb County
No livability data for this city. (Only ~50 U.S. cities are tracked.)
Census & demographics
- Census place
- Macon-Bibb County, GA
- County
- Bibb County · 164,332 people
- City population
- 143,186
- Metro
- Macon-Bibb County, GA
- Population (ZIP)
- 24,310
- Household income
- $30,042
- Rent vs Own
- Severe rent burden
- 1335.0
Population outlook (Bibb County) Hauer SSP2
- Today (2025)
- 148,772 people
- By 2030
- 145,904 · -1.9%
- By 2040
- 139,404 · -6.3%
- By 2050
- 131,603 · -11.5%
- By 2075
- 111,050 · -25.4%
- By 2100
- 83,346 · -44.0%
Race, ethnicity, and origin ACS 2023
- Neighborhood character
- Predominantly Black (76%)
- Race & ethnicity
- Black 76% White 12% Hispanic / Latino 8% Two or more races 4%
- Hispanic origin (detail)
- Mexican 5% Puerto Rican 1%
- Common ancestry
- Lithuanian 1% Italian 1%
- Foreign-born
- 4% · Canada
- Languages at home
- 91% English-only · Spanish 8%
Political lean MEDSL · Bibb
- 2024 margin
- Strong D (+22.4) · D 61.0% · R 38.5%
- 2008→2024 swing
- +4.4pp toward D · 2008: 18.0pp · 2024: 22.4pp
- All cycles
- 2024: D+22.4 2020: D+23.8 2016: D+20.2 2012: D+20.0 2008: D+18.0
Not yet ingested
- Civics
- —
Market trends
- HPI YoY
- ▼ -80.17%
- Current HPI
- 148.6765
- Rent YoY
- ▲ 5.03%
- Metro
- Macon-Bibb County, GA
- State GDP YoY
- ▲ 2.66%
- F500 in state
- 28
Industry mix (Fortune 500 HQ in GA)
| Industry | F500 HQs | Revenue |
|---|---|---|
| Paper / Packaging | 2 | $29B |
|
||
| Retail | 1 | $160B |
|
||
| Transportation / Logistics | 1 | $91B |
|
||
| Airlines | 1 | $62B |
|
||
| Consumer Goods | 1 | $47B |
|
||
| Utilities | 1 | $25B |
|
||
Price history
+260.0% since first listed10 events — show timeline
- 2026-01-21 Price Changed $90,000 GAMLS
- 2026-01-21 Price Changed $90,000 FMLS
- 2025-11-14 Price Changed $99,000 GAMLS
- 2025-11-14 Price Changed $99,000 FMLS
- 2025-10-22 Price Changed $124,500 GAMLS
- 2025-10-22 Price Changed $124,500 FMLS
- 2025-09-26 Listed $129,500 FMLS
- 2025-09-26 Listed $129,500 GAMLS
- 2021-11-22 Sold (MLS) $22,000 MGMLS
- 2021-11-05 Listed $25,000 MGMLS
Property tax history
+2.3%/yrLatest (2025): $302 · -1.3% YoY. Source: county tax records.
Cash-flow waterfall
monthlySold comps — $/sqft
last 12 mo · ≤1 miLoading sold comps…