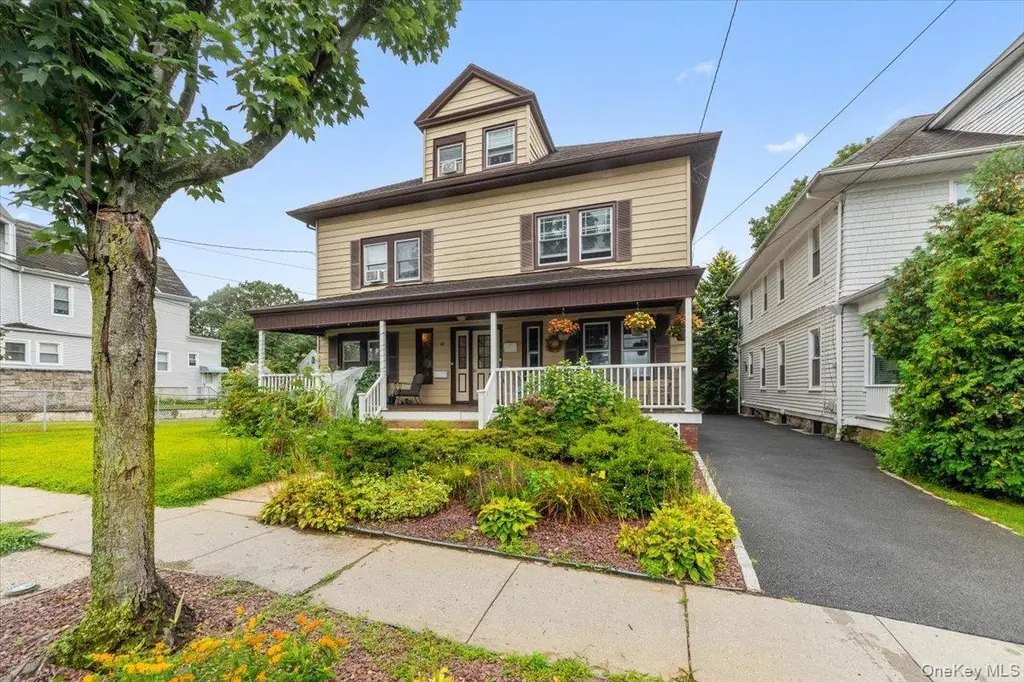
60 Underhill St · Tuckahoe, NY
Flood risk 1/10 · Minimal
- FEMA flood zone
- X (unshaded)
- Chance of flooding over 30 yrs
- 0.0%
- Est. flood insurance / yr
- $507 – $1,088
Fire risk 1/10 · Minimal
- Est. fire insurance / yr
- $691 – $1,283
Heat risk 6/10 · Moderate
- Hot days now (above 99°F)
- 7 days/yr
- Hot days in 30 yrs
- 15 days/yr
Wind risk 6/10 · Moderate
- Chance of severe wind over 30 yrs
- 27.0%
Air-quality risk 4/10 · Minor
- Unhealthy air days now
- 3 days/yr
- Unhealthy air days in 30 yrs
- 5 days/yr
Risk factors via First Street. Map © Google.
Why this score? — see what drove the D grade
The composite is a weighted blend of 9 inputs, each scored 0–100. Each bar is that input's sub-score; the figure is the points it added to the 100-point composite (weight × sub-score).
- ARV discount +15.0/15.0
- Cash flow +8.0/30.0
- Schools +6.4/10.0
- Livability +4.0/5.0
- 1% rule +2.9/10.0
- Rent growth +2.5/5.0
- Condition / age +2.5/5.0
- DSCR +2.1/10.0
- Appreciation +0.0/10.0
$799,000
🖨 Deal sheet (PDF) 📄 Offer letter ✓ Due diligence
Listing remarks
Charming single attached home 5-bedroom, 2.5-bath home offers the perfect blend of character and convenience. Features include a bright kitchen with stainless steel appliances, hardwood floors and a welcoming front porch. The backyard is made for entertaining with both a porch and patio, plus a detached garage for extra storage. Located in the heart of Tuckahoe and short distance to the train, this home is a rare find!
Key facts
- Bright kitchen
- Hardwood floors
- Detached garage
Tags
Property features AI
Exterior
- Parking: Driveway; 1-car garage
- Utilities: Con-Edison electric; Public sewer; Public trash collection
- Home design: Single family residence; Updated/remodeled condition
- Construction: Vinyl siding
- Exterior features: Awning(s); Partial backyard fencing; Garage structure on property
Interior
- Kitchen: Dishwasher; Gas oven; Microwave; Refrigerator
- Bedrooms: Three or more levels (home has multiple stories)
- Flooring: Carpet; Ceramic tile; Hardwood; Laminate; Vinyl
- Bathrooms: 2 full bathrooms; 1 half bathroom
- Heating & cooling: Hot water heating; Oil heating; Wall/window air conditioning units
- Interior features: Eat-in kitchen; Patio; Porch; Unfinished walk-out basement; Crawl attic
- Laundry & utility: Washer; Dryer; Laundry located in kitchen
Neighborhood map
What this means for you Summary
Snapshot
- This is a 5-bed/2.5-bath single-family listed at $799k.
Deal economics
- At list price, monthly cash flow is $-805 ($-10k/yr) — negative.
- To cash-flow at today's rent, offer at most $657k (17.8% below list).
- To meet the 1% rule (rent ≥ 1% of price), the offer needs to be $630k (21.1% below list).
- Recommended offer: $630k (21.1% below list) — sets the bar for 1% rule.
- Cap rate 5.1% vs local median 2.9% in Tuckahoe — top-decile yield for the area; either an underpriced asset or a hidden risk that comps aren't pricing in. Stress-test before assuming the spread holds.
Location & tenants
- Location reads 79/100 on livability (#125 in NY, #2,013 nationally) — a middle-class / working-renter tenant base. Strengths: crime A+, commute A+, employment A+; Watch: amenities C-, cost of living F.
- Tuckahoe Union Free School District (suburban): math 71% / reading 69% proficiency, ranked #133 of 755 in NY (top 18%) — strong family-tenant draw, lease renewals of 3-5y typical; only 12% free/reduced lunch — higher-income household profile.
- Zoned schools: William E Cottle School (math 84% / reading 74%, grade A, #188 of 2,108 statewide, top 11%, 528 students, 17% FRL); Tuckahoe Middle School (math 50% / reading 70%, grade B, #161 of 729 statewide, top 24%, 278 students, 18% FRL); Tuckahoe High School (math 95%, 292 students, 23% FRL).
- Market conditions: 44 active listings in the ZIP; 4 comparable units currently listed for rent nearby; rentals leasing fast (median 5d on market — plan ~1-2 weeks tenant-placement turnaround); high-income renter base; 954 units permitted in Westchester County in 2024 (649 in 5+ unit buildings).
- At $6,304/mo this rent would consume 58% of the median local household income ($131k/yr) (locally 363% of renters already pay >50% of income on rent) — very limited rent-growth headroom before tenants either downsize or default.
Forward outlook
- Local home prices are declining (-3.0%/yr); year-one equity from $6k of loan paydown is wiped out by about $24k of value loss. Plan a longer hold.
- Westchester County population projected at +10% by 2050 — modest demand growth; plan on rents tracking national, not racing it.
Negotiation context
- It's been on market 30 days — a 2% lower offer ($787k) is reasonable based on typical stale-listing flexibility.
- 2 sale attempts with the ask held roughly flat each time — persistent listings suggest the price (not the market) is what's stuck; bring a comps-based counter.
- Current owner paid $160k; list at $799k implies a 399% gain — meaningful room to come down on a strong offer.
Risks & watch-outs
- Watch-outs: built in 1890 — expect roof / HVAC / electrical / plumbing capex.
- Climate carrying-cost: major wind risk, 27% chance of damaging wind over 30y; extreme-heat days projected 7→15/yr by 2055 (HVAC capex compounding) — expect insurance premiums to compound above CPI over the hold.
Questions for the listing agent
- What do current leases actually rent for vs. the listed asking? Can we see a recent rent roll and the last 12 months of T-12 income?
- Built in 1890 — when were the roof, HVAC, electrical panel, plumbing, and water heater last replaced?
- Is there a deadline driving the sale (1031 exchange, divorce, estate, relocation)? That informs how much negotiation room exists.
- Schools are A-rated — typically a magnet for longer-tenancy family renters. What's the average tenant stay here, and is there a school-zone premium baked into asking?
- The area grade is low — what's the realistic commute time and amenity access for the typical tenant pool here? Any planned neighborhood developments (good or bad) we should know about?
- What's the average days-on-market for RENTAL listings here right now (not sales)? A rising rental-DOM trend means longer vacancies and softer asking-rent achievability than the comps imply.
- What's the recent tenant-quality profile in this submarket — average credit score on applications, eviction rate, late-payment / NSF rate, and stable-employment percentage? A property-management company in the area should have these aggregated.
- How much new for-sale + rental construction is in the pipeline within 1–3 miles? Heavy new supply typically softens prices + rents 12–24 months out; constrained supply supports both.
Investment metrics
- 1% rule
- 0.79% ✗
- Cap rate
- 5.08%
- Cash-on-cash
- -4.32%
- DSCR
- 0.81
- GRM
- 10.6
CMA / ARV
- ARV (median comp)
- $1,234,355
- List price
- $799,000
- Delta
- -35.27%
- Verdict
- UNDERPRICED
- Comps
- 20 within 1.0 mi
Show comp detail 12 sales within ~0.75 mi
| Address | Dist | Beds/Ba | Sqft | Sold | Price | $/sf | Match |
|---|---|---|---|---|---|---|---|
| 70 Howard Ave | 0.50mi | 4/2.0 (-1) | 2,000 (0%) | 6mo | $840,000 | $420 | 65 |
| 325 Marbledale Rd | 0.73mi | 4/2.0 (-1) | 2,000 (0%) | 6mo | $825,000 | $413 | 54 |
| 94 Overlook Ave | 0.62mi | 4/2.0 (-1) | 1,955 (-2%) | 14mo | $982,500 | $503 | 49 |
| 36 Sagamore Rd | 0.67mi | 6/2.0 (+1) | 2,126 (+6%) | 3mo | $1,750,000 | $823 | 49 |
| 72 Pilgrim Ave | 0.66mi | 4/2.5 (-1) | 2,145 (+7%) | 9mo | $770,000 | $359 | 44 |
| 7 Park Avenue Ter | 0.61mi | 4/2.0 (-1) | 1,836 (-8%) | 9mo | $1,725,000 | $940 | 43 |
| 93 Pennsylvania Ave | 0.60mi | 5/4.0 | 2,204 (+10%) | 7mo | $950,000 | $431 | 43 |
| 9 Bacon Ct | 0.57mi | 4/3.0 (-1) | 2,216 (+11%) | 8mo | $1,435,000 | $648 | 42 |
| 90 Joyce Rd | 0.57mi | 5/2.0 | 1,700 (-15%) | 11mo | $999,000 | $588 | 38 |
| 11 Park Avenue Ter | 0.62mi | 4/2.5 (-1) | 1,740 (-13%) | 12mo | $1,721,000 | $989 | 34 |
| 4 Morningside Cir | 0.48mi | 4/4.0 (-1) | 2,295 (+15%) | 10mo | $2,075,000 | $904 | 34 |
| 94 Joyce Rd | 0.55mi | 4/2.0 (-1) | 1,700 (-15%) | 16mo | $950,000 | $559 | 29 |
Match score weights: distance 35% · size 25% · config 20% · recency 20%. Top-matched comps best support the ARV.
Projected returns pro-forma
-3.0% appreciation · 3.0% rent growth · sell at horizon
- IRR
- -23.5%
- Equity multiple
- 0.19×
- Total profit
- $-180,495
- Equity at exit
- $119,133
- IRR
- -18.3%
- Equity multiple
- 0.01×
- Total profit
- $-222,158
- Equity at exit
- $69,083
Cash invested: $223,720 (down + closing). Projections, not guarantees.
Landlord ↔ Tenant lean methodology
- Overall (STATE)
- 15 Strongly Tenant-Friendly
- State New York
- 15 Strongly Tenant-Friendly · D+10
- County
- — inherits STATE
- City
- — inherits STATE
ZIP-level market 10707
- Active inventory
- 44
- Price-to-rent
- 10.6×
Monthly cashflow live
- Estimated rent
- $6,304 medium interval (Pro) →
- Mortgage (P&I)
- −$4,190
- Tax from tax record
- −$1,263 /mo · $15,153/yr
- Insurance
- −$333
- HOA
- −$0
- Vacancy / Maint / Mgmt
- −$1,324
- Net cashflow
- $-805
Break-even live
Sensitivity live
| Price | -10% $-353 | -5% $-579 | +0% $-805 | +5% $-1,031 | +10% $-1,257 |
|---|---|---|---|---|---|
| Rent | -10% $-1,303 | -5% $-1,054 | +0% $-805 | +5% $-556 | +10% $-307 |
| Rate | -1.0pp $-403 | -0.5pp $-602 | base $-805 | +0.5pp $-1,012 | +1.0pp $-1,223 |
UW: 25.0% down · 7.5% · 30yr · 1.5% tax · 5.0% vac · 8.0% maint · 8.0% mgmt
Financing live
Cash to close
- Down payment
- $199,750
- Closing costs
- $23,970
- Reserves months
- —
- Total cash needed
- —
Loan-product check · same deal, 3 products live
Conventional
25% down · 7.5% · 30yr
- Down + closing
- —
- Monthly P&I
- —
- Monthly cashflow
- —
- DSCR
- —
- Eligible?
- —
Personal DTI + credit; lowest rate.
DSCR
20% down · 8.5% · 30yr
- Down + closing
- —
- Monthly P&I
- —
- Monthly cashflow
- —
- DSCR
- —
- Eligible?
- —
No personal income docs; deal must DSCR.
Hard money
10% down · 12.0% · 12mo
- Down + closing
- —
- Monthly P&I
- —
- Monthly cashflow
- —
- DSCR
- —
- Eligible?
- —
Short-term bridge; refi at stabilization.
Rent comps 4 comps
| Address | Beds | Baths | Sqft | Rent | $/sqft | DOM | Units | Dist |
|---|---|---|---|---|---|---|---|---|
| 9 Franklin St Eastchester, NY | 4.0 | 2.0 | 1800 | $4,800 | $2.67 | 6d | 1 | 0.23mi |
| 45 Fisher Ave Tuckahoe, NY | 4.0 | 2.5 | 2850 | $8,500 | $2.98 | 4d | 1 | 0.57mi |
| 30 Cassilis Ave Bronxville, NY | 4.0 | 2.5 | 2808 | $6,250 | $2.23 | 0d | 1 | 0.87mi |
| 15 Hillside Rd Bronxville, NY | 5.0 | 3.5 | 2750 | $13,500 | $4.91 | 4d | 1 | 1.33mi |
Listing history 3 events
-
2026-04-20$799,000 Active 422-char remark
-
2025-08-27$799,000 Active
-
1997-08-13soldstatus $160,000
ⓘ Source: listings_history table (triggers on properties + properties_extension) + one-shot
backfill from property_details.listing_events for pre-trigger history.
Tax reassessment forecast NY · Partial reset (capped growth)
- Current annual tax
- $15,153 · $1,263/mo
- Projected year-2 tax
- $15,153 · $1,263/mo
- Expected delta
- $0/yr ($0/mo · 0.0%)
ⓘ Screening estimate from a state-policy table — verify with the county assessor before closing.
Climate risk First Street
- Flood 1/10 Low FEMA zone X (unshaded) · 0% chance over 30 yrs
- Wildfire 1/10 Low
- Heat 6/10 Major 7 d/yr ≥99°F today · 15 d/yr by 30 yrs out
- Wind 6/10 Major 27% chance of damaging wind over 30 yrs
- Air quality 4/10 Moderate 3 unhealthy d/yr today · 5 by 30 yrs out
Nearby sold comps map
Loading sold comps map…
Walkable amenities ~0.75 mi
Loading nearby amenities…
Taxation est. · year 1
- Rental income
- $75,654
- − Mortgage interest
- −$44,756
- − Property taxes
- −$15,153
- − Insurance
- −$3,995
- − Repairs & maintenance
- −$6,052
- − Management
- −$6,052
- − Depreciation
- −$23,244
- Taxable loss
- −$23,599
- Est. tax savings @ 24.0%
- +$5,664
- After-tax cash flow
- $-3,998/yr
For passive investors: Depreciation is non-cash, so a rental often shows a tax loss while cash-flowing — sheltering income. Rental losses are passive: they offset passive income freely, and up to $25,000/yr can offset ordinary (W-2) income if you actively participate and your MAGI is under $100k (phasing out to $0 by $150k); unused losses carry forward. On sale, claimed depreciation is recaptured at up to 25%, and gains may owe capital-gains tax (a 1031 exchange can defer both). Figures are a year-1 estimate at your 24.0% rate — not tax advice; consult a CPA.
Schools (NCES district)
- District
- Tuckahoe Union Free School District
- NCES district ID
- 3629040
- Math proficiency
- 71% ▼ -2.00%
- Reading proficiency
- 69% ▲ 2.00%
- Median HH income
- $88,563
- Composite
- 64.25/100
- National rank
- #1168
- State rank
- #133 of 755 in NY
Livability — Tuckahoe
- Score
- 79/100
- State rank
- #125
- US rank
- #2013
Category grades
Schools grade is shown separately in the Schools card above.
Census & demographics
- Census place
- Tuckahoe, NY
- County
- Westchester County · 709,332 people
- City population
- 9,688
- Metro
- New York-Newark-Jersey City, NY-NJ-PA
- Population (ZIP)
- 9,688
- Household income
- $130,957
- Rent vs Own
- Severe rent burden
- 363.0
Population outlook (Westchester County) Hauer SSP2
- Today (2025)
- 1,028,035 people
- By 2030
- 1,051,636 · +2.3%
- By 2040
- 1,098,520 · +6.9%
- By 2050
- 1,136,044 · +10.5%
- By 2075
- 1,196,925 · +16.4%
- By 2100
- 1,175,147 · +14.3%
Race, ethnicity, and origin ACS 2023
- Neighborhood character
- Majority White (64%)
- Race & ethnicity
- White 64% Hispanic / Latino 17% Asian 12% Two or more races 7% Black 4%
- Hispanic origin (detail)
- Mexican 7% Puerto Rican 4% Dominican 1%
- Common ancestry
- Romanian 4% Scotch-Irish 3%
- Foreign-born
- 21% · Canada, South Korea
- Languages at home
- 69% English-only · Spanish 13% Korean 5% Other Indo-European 5%
Political lean MEDSL · Westchester
- 2024 margin
- Strong D (+26.3) · D 63.1% · R 36.9%
- 2008→2024 swing
- -1.3pp toward R · 2008: 27.6pp · 2024: 26.3pp
- All cycles
- 2024: D+26.3 2020: D+36.3 2016: D+32.8 2012: D+22.2 2008: D+27.6
Not yet ingested
- Civics
- —
Market trends
- HPI YoY
- ▼ -479.55%
- Current HPI
- 261.5898
- Rent YoY
- —
- Metro
- New York-Newark-Jersey City, NY-NJ-PA
- State GDP YoY
- ▲ 2.60%
- F500 in state
- 92
Industry mix (Fortune 500 HQ in NY)
| Industry | F500 HQs | Revenue |
|---|---|---|
| Financial Services | 10 | $950B |
|
||
| Consumer Goods | 9 | $162B |
|
||
| Insurance | 4 | $225B |
|
||
| Telecommunications | 2 | $144B |
|
||
| Pharmaceuticals | 2 | $112B |
|
||
| Media / Entertainment | 2 | $69B |
|
||
Price history
+399.4% since first listed4 events — show timeline
- 2026-05-20 Pending — OneKey® MLS as Distributed by MLS Grid
- 2026-04-20 Listed $799,000 OneKey® MLS as Distributed by MLS Grid
- 2025-08-27 Listed $799,000 OneKey® MLS as Distributed by MLS Grid
- 1997-08-13 Sold (Public Records) $160,000 Public Records
Property tax history
+2.6%/yrLatest (2025): $15,153 · +4.5% YoY. Source: county tax records.
Cash-flow waterfall
monthlySold comps — $/sqft
last 12 mo · ≤1 miLoading sold comps…