211 Pollock St · Pollocksville, NC
Flood risk 1/10 · Minimal
- FEMA flood zone
- X (shaded)
- Chance of flooding over 30 yrs
- 0.0%
- Est. flood insurance / yr
- $507 – $1,088
Fire risk 4/10 · Minor
- Est. fire insurance / yr
- $906 – $1,684
Heat risk 8/10 · Major
- Hot days now (above 106°F)
- 7 days/yr
- Hot days in 30 yrs
- 19 days/yr
Wind risk 8/10 · Major
- Chance of severe wind over 30 yrs
- 98.0%
Air-quality risk 2/10 · Minimal
- Unhealthy air days now
- 1 days/yr
- Unhealthy air days in 30 yrs
- 1 days/yr
Risk factors via First Street. Map © Google.
Why this score? — see what drove the B- grade
The composite is a weighted blend of 9 inputs, each scored 0–100. Each bar is that input's sub-score; the figure is the points it added to the 100-point composite (weight × sub-score).
- Cash flow +29.9/30.0
- DSCR +10.0/10.0
- 1% rule +8.0/10.0
- ARV discount +7.5/15.0
- Schools +3.2/10.0
- Livability +3.1/5.0
- Rent growth +2.5/5.0
- Condition / age +2.5/5.0
- Appreciation +0.0/10.0
$105,000
🖨 Deal sheet 📄 Offer letter ✓ Due diligence
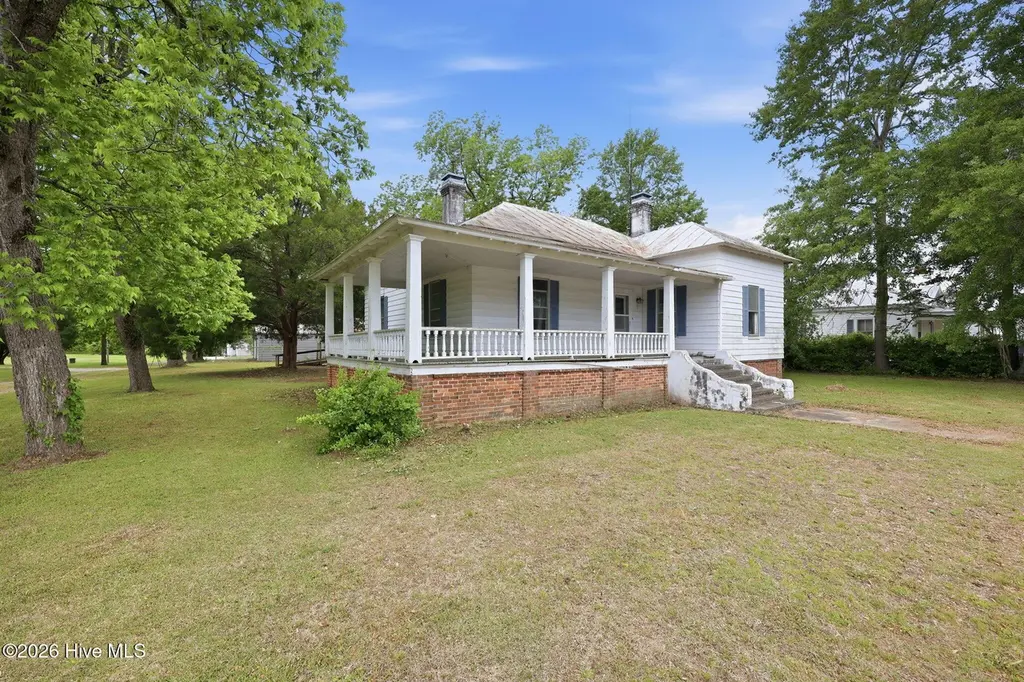
Listing remarks
* * * Motivated Seller * * * Check out this diamond in the rough! This 3-bedroom, 1-bath home offers over 2,000 heated square feet and endless potential. Situated on a beautiful lot with mature pecan trees, the property features a huge wrap-around covered front porch, a handicap-accessible ramp, and a spacious 30x32 shelter/carport. With plenty of indoor space and character waiting to be lived in or restored, this is the perfect fixer-upper opportunity you don't want to miss!
Key facts
- Mature pecan trees
- 6,534 sq ft lot
- Parking
Tags
Property features AI
Exterior
- Parking: Has carport (1 space); Covered parking; paved and unpaved areas
- Utilities: Public water; Sewer available; Water available
- Home design: Single-family residence; One story; Entry level is 1
- Construction: Aluminum siding and frame construction; Metal roof
- Exterior features: Covered wrap-around porch with front and rear porch; Chain link fencing around back yard; Has view
Interior
- Bedrooms: 6 total rooms (includes bedrooms and living spaces)
- Flooring: Carpet; Vinyl; Wood
- Bathrooms: 1 full bathroom
- Heating & cooling: Heat pump; Propane heating; Electric heating; Space heater; Wall/window cooling units
- Interior features: Entrance foyer; Crawl space basement
- Laundry & utility: Washer hookup
Neighborhood map
What this means for you Summary
Snapshot
- This is a 3-bed/1.0-bath single-family listed at $105k.
Deal economics
- At list price, monthly cash flow is $389 ($5k/yr) — positive.
- The deal already cash-flows at list — no discount required.
- Meets the 1% rule at list price ($1k rent vs $105k).
- Recommended offer: $102k (3.0% below list) — sets the bar for market timing.
Location & tenants
- Location reads 61/100 on livability (#498 in NC) — a middle-class / working-renter tenant base. Strengths: cost of living A+, health & safety B; Watch: crime F, amenities F, commute F.
- Jones County Schools (rural): math 34% / reading 43% proficiency, ranked #121 of 178 in NC (top 68%) — families likely to look elsewhere, expect single-tenant / working-renter base with shorter leases; 70% free/reduced lunch — lower-income household profile, screen leases tightly.
- Zoned schools: Pollocksville Elementary (math 42% / reading 57%, grade D, #417 of 1,410 statewide, top 32%, 119 students, 98% FRL); Jones Senior High School (math 35% / reading 47%, grade F, #385 of 535 statewide, top 72%, 557 students, 100% FRL) — zoned schools average 98% FRL vs 70% district-wide (29 pts higher); higher-poverty schools than district average — tighter screening recommended.
- Market conditions: 13 active listings in the ZIP; 39 units permitted in Jones County in 2024 (0 in 5+ unit buildings).
Forward outlook
- Local home prices are declining (-3.0%/yr); year-one equity from $726 of loan paydown is wiped out by about $3k of value loss. Plan a longer hold.
- Jones County population projected at -18% by 2050 — secular population decline; favor cash flow + early exit over multi-decade hold.
- At projected returns (-3.0% appreciation + 3.0% rent growth), your $29k cash investment doubles in ~8 years — after that, you're playing with house money.
Negotiation context
- It's been on market 49 days — a 3% lower offer ($102k) is reasonable based on typical stale-listing flexibility.
Risks & watch-outs
- Climate carrying-cost: severe wind risk, 98% chance of damaging wind over 30y; extreme-heat days projected 7→19/yr by 2055 (HVAC capex compounding) — expect insurance premiums to compound above CPI over the hold.
Questions for the listing agent
- It's been on market 49 days. Have you received any prior offers? Is the seller open to a 3% concession, seller financing, or rate buy-down credit?
- Built in 1975 — when were the roof, HVAC, electrical panel, plumbing, and water heater last replaced?
- Is there a deadline driving the sale (1031 exchange, divorce, estate, relocation)? That informs how much negotiation room exists.
- Schools are D-rated, which usually means shorter tenancies and higher turnover. Who's the typical renter profile here, and what's been the actual vacancy rate?
- Crime grade is F in this area — have there been break-ins, vandalism, or insurance claims at this property in the last 3 years? What carrier currently insures it and at what premium?
- What's the average days-on-market for RENTAL listings here right now (not sales)? A rising rental-DOM trend means longer vacancies and softer asking-rent achievability than the comps imply.
- What's the recent tenant-quality profile in this submarket — average credit score on applications, eviction rate, late-payment / NSF rate, and stable-employment percentage? A property-management company in the area should have these aggregated.
- How much new for-sale + rental construction is in the pipeline within 1–3 miles? Heavy new supply typically softens prices + rents 12–24 months out; constrained supply supports both.
Investment metrics
- 1% rule
- 1.30% ✓
- Cap rate
- 10.74%
- Cash-on-cash
- 15.87%
- DSCR
- 1.71
- GRM
- 6.4
CMA / ARV
- ARV (on-the-fly)
- $304,444
- Comps found
- 1
Show comp detail 1 sale within ~0.75 mi
| Address | Dist | Beds/Ba | Sqft | Sold | Price | $/sf | Match |
|---|---|---|---|---|---|---|---|
| 233 Beaufort Rd | 0.57mi | 3/2.0 | 2,546 (+10%) | 3mo | $334,000 | $131 | 50 |
Match score weights: distance 35% · size 25% · config 20% · recency 20%. Top-matched comps best support the ARV.
Projected returns pro-forma
-3.0% appreciation · 3.0% rent growth · sell at horizon
- IRR
- 6.8%
- Equity multiple
- 1.26×
- Total profit
- $7,755
- Equity at exit
- $15,656
- IRR
- 16.1%
- Equity multiple
- 2.31×
- Total profit
- $38,641
- Equity at exit
- $9,078
Cash invested: $29,400 (down + closing). Projections, not guarantees.
Landlord ↔ Tenant lean methodology
- Overall (STATE)
- 85 Strongly Landlord-Friendly
- State North Carolina
- 85 Strongly Landlord-Friendly · R+3
- County
- — inherits STATE
- City
- — inherits STATE
ZIP-level market 28573
- Home prices YoY
- -29.5%
- Active inventory
- 13
- Price-to-rent
- 6.4×
Monthly cashflow live
- Estimated rent
- $1,364 medium interval (Pro) →
- Mortgage (P&I)
- −$551
- Tax from tax record
- −$94 /mo · $1,132/yr
- Insurance
- −$44
- HOA
- −$0
- Vacancy / Maint / Mgmt
- −$286
- Net cashflow
- $389
Break-even live
UW: 25.0% down · 7.5% · 30yr · 1.5% tax · 5.0% vac · 8.0% maint · 8.0% mgmt
Financing live
Cash to close
- Down payment
- $26,250
- Closing costs
- $3,150
- Reserves months
- —
- Total cash needed
- —
Loan-product check · same deal, 3 products live
Conventional
25% down · 7.5% · 30yr
- Down + closing
- —
- Monthly P&I
- —
- Monthly cashflow
- —
- DSCR
- —
- Eligible?
- —
Personal DTI + credit; lowest rate.
DSCR
20% down · 8.5% · 30yr
- Down + closing
- —
- Monthly P&I
- —
- Monthly cashflow
- —
- DSCR
- —
- Eligible?
- —
No personal income docs; deal must DSCR.
Hard money
10% down · 12.0% · 12mo
- Down + closing
- —
- Monthly P&I
- —
- Monthly cashflow
- —
- DSCR
- —
- Eligible?
- —
Short-term bridge; refi at stabilization.
Listing history 18 events
-
2026-06-19days on market $105,000 Active 49 DOM
-
2026-06-18days on market $105,000 Active 48 DOM
-
2026-06-17days on market $105,000 Active 47 DOM
-
2026-06-16days on market $105,000 Active 46 DOM
-
2026-06-15days on market $105,000 Active 45 DOM
-
2026-06-14days on market $105,000 Active 43 DOM
-
2026-06-13days on market $105,000 Active 42 DOM
-
2026-06-10days on market $105,000 Active 40 DOM
-
2026-06-09days on market $105,000 Active 39 DOM
-
2026-06-08days on market $105,000 Active 38 DOM
-
2026-06-07days on market $105,000 Active 37 DOM
-
2026-06-02days on market $105,000 Active 32 DOM
-
2026-06-01days on market $105,000 Active 31 DOM
-
2026-05-31days on market $105,000 Active 30 DOM
-
2026-05-30days on market $105,000 Active 29 DOM
-
2026-05-19price $109,000
-
2026-05-13price $115,000
-
2026-04-30$119,000 Active
ⓘ Source: listings_history table (triggers on properties + properties_extension) + one-shot
backfill from property_details.listing_events for pre-trigger history.
Tax reassessment forecast NC · Resets to sale price
- Current annual tax
- $1,132 · $94/mo
- Projected year-2 tax
- $1,132 · $94/mo
- Expected delta
- $0/yr ($0/mo · 0.0%)
ⓘ Screening estimate from a state-policy table — verify with the county assessor before closing.
Climate risk First Street
- Flood 1/10 Low FEMA zone X (shaded) · 0% chance over 30 yrs
- Wildfire 4/10 Moderate
- Heat 8/10 Severe 7 d/yr ≥106°F today · 19 d/yr by 30 yrs out
- Wind 8/10 Severe 98% chance of damaging wind over 30 yrs
- Air quality 2/10 Low 1 unhealthy d/yr today · 1 by 30 yrs out
Nearby sold comps map
Loading sold comps map…
Walkable amenities ~0.75 mi
Loading nearby amenities…
Taxation est. · year 1
- Rental income
- $16,369
- − Mortgage interest
- −$5,882
- − Property taxes
- −$1,132
- − Insurance
- −$525
- − Repairs & maintenance
- −$1,309
- − Management
- −$1,309
- − Depreciation
- −$3,055
- Taxable income
- $3,157
- Est. tax owed @ 24.0%
- −$758
- After-tax cash flow
- $3,910/yr
For passive investors: Depreciation is non-cash, so a rental often shows a tax loss while cash-flowing — sheltering income. Rental losses are passive: they offset passive income freely, and up to $25,000/yr can offset ordinary (W-2) income if you actively participate and your MAGI is under $100k (phasing out to $0 by $150k); unused losses carry forward. On sale, claimed depreciation is recaptured at up to 25%, and gains may owe capital-gains tax (a 1031 exchange can defer both). Figures are a year-1 estimate at your 24.0% rate — not tax advice; consult a CPA.
Schools (NCES district)
- District
- Jones County Schools
- NCES district ID
- 3702400
- Math proficiency
- 34% ▼ -4.00%
- Reading proficiency
- 43% ▼ -3.00%
- Median HH income
- $36,517
- Composite
- 31.93/100
- National rank
- #5849
- State rank
- #121 of 178 in NC
Livability — Pollocksville
- Score
- 61/100
- State rank
- #498
- US rank
- #18244
Category grades
Schools grade is shown separately in the Schools card above.
Census & demographics
- Census place
- Pollocksville, NC
- Population (ZIP)
- 1,808
Population outlook (Jones County) Hauer SSP2
- Today (2025)
- 9,892 people
- By 2030
- 9,720 · -1.7%
- By 2040
- 9,043 · -8.6%
- By 2050
- 8,128 · -17.8%
- By 2075
- 6,419 · -35.1%
- By 2100
- 5,454 · -44.9%
Race, ethnicity, and origin ACS 2023
- Neighborhood character
- Diverse neighborhood (Simpson 0.56)
- Race & ethnicity
- White 52% Black 42% Two or more races 4% Hispanic / Latino 4%
- Common ancestry
- Scandinavian 4% Slovak 2% Lithuanian 2%
- Foreign-born
- 1% · Canada
- Languages at home
- 97% English-only · Spanish 2%
Political lean MEDSL · Jones
- 2024 margin
- Strong R (+25.7) · D 36.8% · R 62.5%
- 2008→2024 swing
- -17.3pp toward R · 2008: -8.4pp · 2024: -25.7pp
- All cycles
- 2024: R+25.7 2020: R+19.6 2016: R+17.9 2012: R+9.4 2008: R+8.4
Not yet ingested
- Civics
- —
Market trends
- HPI YoY
- ▼ -57.29%
- Current HPI
- 137.1228
- Rent YoY
- —
- Metro
- —
- State GDP YoY
- ▲ 3.28%
- F500 in state
- 26
Industry mix (Fortune 500 HQ in NC)
| Industry | F500 HQs | Revenue |
|---|---|---|
| Financial Services | 2 | $213B |
|
||
| Retail | 2 | $95B |
|
||
| Industrial Conglomerate | 1 | $38B |
|
||
| Metals / Steel | 1 | $35B |
|
||
| Utilities | 1 | $30B |
|
||
| Industrial Machinery | 1 | $19B |
|
||
Price history
-8.4% since first listed3 events — show timeline
- 2026-05-19 Price Changed $109,000 Hive MLS
- 2026-05-13 Price Changed $115,000 Hive MLS
- 2026-04-30 Listed $119,000 Hive MLS
Property tax history
+4.0%/yrLatest (2025): $1,132 · +0.0% YoY. Source: county tax records.
Cash-flow waterfall
monthlySold comps — $/sqft
last 12 mo · ≤1 miLoading sold comps…