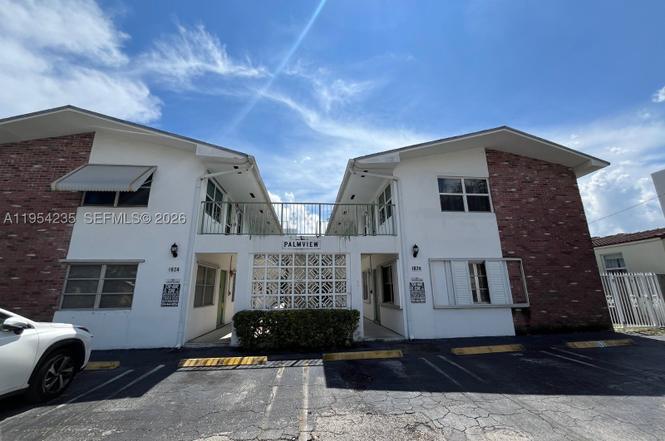
1824 Monroe St #1 · Hollywood, FL
Flood risk No data
- FEMA flood zone
- —
- Chance of flooding over 30 yrs
- —
- Est. flood insurance / yr
- —
Fire risk No data
- Est. fire insurance / yr
- —
Heat risk No data
- Hot days now (above threshold)
- —
- Hot days in 30 yrs
- —
Wind risk No data
- Chance of severe wind over 30 yrs
- —
Air-quality risk No data
- Unhealthy air days now
- —
- Unhealthy air days in 30 yrs
- —
Risk factors via First Street. Map © Google.
Why this score? — see what drove the C- grade
The composite is a weighted blend of 9 inputs, each scored 0–100. Each bar is that input's sub-score; the figure is the points it added to the 100-point composite (weight × sub-score).
- Cash flow +18.4/30.0
- ARV discount +7.5/15.0
- 1% rule +7.0/10.0
- DSCR +5.8/10.0
- Schools +4.1/10.0
- Livability +3.8/5.0
- Rent growth +2.6/5.0
- Condition / age +2.5/5.0
- Appreciation +0.0/10.0
$179,900
🖨 Deal sheet 📄 Offer letter ✓ Due diligence
Listing remarks MLS
Excellent investor opportunity, unit rented for $1550 monthly until 8/31/2024 low Maintenace fees and excellent location. unit will only be shown to serious buyers with offer in hands.
Key facts
- $232 HOA
- Parking
- Built 1970
Property features AI
Finance
- Financial info: Pets allowed with restrictions
- HOA & community: Association fee $1,393 semi-annually; Association fee includes common areas
Exterior
- Parking: Has carport (1 space); One covered parking space
- Utilities: Central heating and cooling; Electric water heater
- Home design: Attached property; 2 stories; Entry level 1
- Construction: Brick and block construction; Effective year built
- Exterior features: Fruit trees
Interior
- Kitchen: Electric range; Refrigerator
- Bedrooms: Bedroom located on the main level
- Flooring: Ceramic tile
- Bathrooms: 1 full bathroom
- Heating & cooling: Central heating (electric); Central air conditioning
- Interior features: Blinds; Bedroom on main level; First floor entry
- Laundry & utility: Electric water heater
Neighborhood map
What this means for you Summary
Snapshot
- This is a 1-bed/1.0-bath condo listed at $180k.
Deal economics
- At list price, monthly cash flow is $169 ($2k/yr) — positive.
- The deal already cash-flows at list — no discount required.
- Meets the 1% rule at list price ($2k rent vs $180k).
- Recommended offer: $158k (12.0% below list) — sets the bar for market timing.
- Cap rate 7.4% vs local median 3.2% in Hollywood — top-decile yield for the area; either an underpriced asset or a hidden risk that comps aren't pricing in. Stress-test before assuming the spread holds.
Location & tenants
- Location reads 76/100 on livability (#232 in FL, #3,548 nationally) — a middle-class / working-renter tenant base. Strengths: commute A+, housing A+, crime B+; Watch: amenities D.
- Broward (suburban): math 42% / reading 53% proficiency, ranked #46 of 73 in FL (top 63%) — families likely to look elsewhere, expect single-tenant / working-renter base with shorter leases.
- Market conditions: Rents flat; 589 active listings in the ZIP; 40 comparable units currently listed for rent nearby; rentals at typical pace (median 15d on market — plan ~3-4 weeks tenant-placement turnaround); 2,111 units permitted in Broward County in 2024 (1,265 in 5+ unit buildings).
- At $2,154/mo this rent would consume 46% of the median local household income ($56k/yr) (locally 3948% of renters already pay >50% of income on rent) — very limited rent-growth headroom before tenants either downsize or default.
Forward outlook
- Local home prices are declining (-3.0%/yr); year-one equity from $1k of loan paydown is wiped out by about $5k of value loss. Plan a longer hold.
- Broward County population projected at +34% by 2050 — long-run rental-demand tailwind backs the buy-and-hold thesis.
Negotiation context
- It's been on market 141 days — a 12% lower offer ($158k) is reasonable based on typical stale-listing flexibility.
- 3 sale attempts since 3y ago with the ask held roughly flat each time — persistent listings suggest the price (not the market) is what's stuck; bring a comps-based counter.
Questions for the listing agent
- It's been on market 141 days. Have you received any prior offers? Is the seller open to a 12% concession, seller financing, or rate buy-down credit?
- Built in 1970 — when were the roof, HVAC, electrical panel, plumbing, and water heater last replaced?
- What does the HOA fee cover, when was the last increase, and are there any pending special assessments or reserve-fund shortfalls?
- Any open or pending special assessments — roof, HVAC, plumbing, elevator, façade? What's the per-unit balance and payoff schedule, and is the seller paying it off at close or rolling it to the buyer?
- Why hasn't it sold? Are there any deal-killer items the seller is aware of (foundation, flood, title, zoning, code violations)?
- Is there a deadline driving the sale (1031 exchange, divorce, estate, relocation)? That informs how much negotiation room exists.
- What's the average days-on-market for RENTAL listings here right now (not sales)? A rising rental-DOM trend means longer vacancies and softer asking-rent achievability than the comps imply.
- What's the recent tenant-quality profile in this submarket — average credit score on applications, eviction rate, late-payment / NSF rate, and stable-employment percentage? A property-management company in the area should have these aggregated.
- How much new apartment / multifamily construction is in the pipeline within 1–3 miles? Heavy new supply (>2% of stock underway) typically softens rents 12–24 months out; light construction supports rent growth.
Investment metrics
- 1% rule
- 1.20% ✓
- Cap rate
- 7.42%
- Cash-on-cash
- 4.02%
- DSCR
- 1.18
- GRM
- 7.0
CMA / ARV
No comps found within radius.
Projected returns pro-forma
-3.0% appreciation · 0.43% rent growth · sell at horizon
- IRR
- -13.4%
- Equity multiple
- 0.53×
- Total profit
- $-23,612
- Equity at exit
- $26,824
- IRR
- -10.2%
- Equity multiple
- 0.46×
- Total profit
- $-27,019
- Equity at exit
- $15,554
Cash invested: $50,372 (down + closing). Projections, not guarantees.
Landlord ↔ Tenant lean methodology
- Overall (STATE)
- 87 Strongly Landlord-Friendly
- State Florida
- 87 Strongly Landlord-Friendly · R+3
- County
- — inherits STATE
- City
- — inherits STATE
ZIP-level market 33020
- Rents YoY
- 0.4%
- Active inventory
- 589
- Price-to-rent
- 7.0×
Monthly cashflow live
- Estimated rent
- $2,154 high interval (Pro) →
- Mortgage (P&I)
- −$943
- Tax from tax record
- −$282 /mo · $3,389/yr
- Insurance
- −$75
- HOA
- −$232
- Vacancy / Maint / Mgmt
- −$452
- Net cashflow
- $169
Break-even live
UW: 25.0% down · 7.5% · 30yr · 1.5% tax · 5.0% vac · 8.0% maint · 8.0% mgmt
Financing live
Cash to close
- Down payment
- $44,975
- Closing costs
- $5,397
- Reserves months
- —
- Total cash needed
- —
Loan-product check · same deal, 3 products live
Conventional
25% down · 7.5% · 30yr
- Down + closing
- —
- Monthly P&I
- —
- Monthly cashflow
- —
- DSCR
- —
- Eligible?
- —
Personal DTI + credit; lowest rate.
DSCR
20% down · 8.5% · 30yr
- Down + closing
- —
- Monthly P&I
- —
- Monthly cashflow
- —
- DSCR
- —
- Eligible?
- —
No personal income docs; deal must DSCR.
Hard money
10% down · 12.0% · 12mo
- Down + closing
- —
- Monthly P&I
- —
- Monthly cashflow
- —
- DSCR
- —
- Eligible?
- —
Short-term bridge; refi at stabilization.
Rent comps 40 comps
| Address | Beds | Baths | Sqft | Rent | $/sqft | DOM | Units | Dist |
|---|---|---|---|---|---|---|---|---|
| 320 S Federal Hwy Hollywood, FL | 2.0 | 1.0–2.0 | 742 | $2,758 | $3.72 | 24d | 9 | 0.08mi |
| 303 S Federal Hwy Hollywood, FL | 1.0–3.0 | 1.0–3.0 | 992 | $2,175 | $2.19 | 2d | 35 | 0.12mi |
| 1770 S Young Cir Hollywood, FL | 2.0 | 1.0–2.0 | 881 | $3,652 | $4.15 | 1d | 42 | 0.16mi |
| 1818 Hollywood Blvd Hollywood, FL | 3.0 | 1.0–2.5 | 1089 | $2,764 | $2.54 | 1d | 17 | 0.22mi |
| 2001 Van Buren St Hollywood, FL | 2.0 | 1.0–2.0 | 788 | $2,801 | $3.55 | 15d | 171 | 0.23mi |
| 1776 Polk St Hollywood, FL | 1.0–2.0 | 1.0–2.0 | 954 | $2,843 | $2.98 | 15d | 25 | 0.38mi |
| 2165 Van Buren St Hollywood, FL | 3.0 | 1.0–3.0 | 1072 | $2,797 | $2.61 | 1d | 14 | 0.44mi |
| 2233 Hollywood Blvd Hollywood, FL | 1.0–2.0 | 1.0–2.0 | 913 | $2,540 | $2.78 | 15d | 94 | 0.57mi |
| 200 E Pembroke Rd Hallandale Beach, FL | 3.0 | 1.0–2.0 | 1006 | $2,840 | $2.82 | 1d | 62 | 0.83mi |
| 2630 Madison St Hollywood, FL | 1.0 | 1.0 | 400 | $1,500 | $3.75 | 24d | 1 | 1.01mi |
| 2630 Madison St Unit b Hollywood, FL | 1.0 | 1.0 | 400 | $1,500 | $3.75 | 24d | 1 | 1.01mi |
| 1927 Cleveland St Unit 1542853P Hollywood, FL | — | 1.0 | 570 | $2,722 | $4.78 | 2d | 1 | 1.10mi |
| 1710 McKinley St #5 Hollywood, FL | 1.0 | 1.0 | 573 | $1,450 | $2.53 | 18d | 1 | 1.12mi |
| 1710 McKinley St #5 Hollywood, FL | 1.0 | 1.0 | 573 | $1,400 | $2.44 | 24d | 1 | 1.12mi |
| 1533 Cleveland St Hollywood, FL | 1.0 | 1.0 | 512 | $1,200 | $2.34 | 24d | 1 | 1.14mi |
| 1815 McKinley St Unit 9 Hollywood, FL | 2.0 | 1.0 | 650 | $1,750 | $2.69 | 16d | 1 | 1.15mi |
| 1425 Arthur St Unit 414B Hollywood, FL | 1.0 | 1.5 | 597 | $1,750 | $2.93 | 18d | 1 | 1.16mi |
| 1560 McKinley St Unit 115w Hollywood, FL | 1.0 | 1.5 | 665 | $1,500 | $2.26 | 3d | 1 | 1.17mi |
| 1520 McKinley St Unit 107E Hollywood, FL | 1.0 | 1.5 | 665 | $1,700 | $2.56 | 17d | 1 | 1.19mi |
| 2204 McKinley St #2 Hollywood, FL | 1.0 | 1.0 | 635 | $1,850 | $2.91 | 17d | 1 | 1.20mi |
| 2204 McKinley St #2 Hollywood, FL | 1.0 | 1.0 | 635 | $1,800 | $2.83 | 1d | 1 | 1.20mi |
| 1816 Taft St Unit 8 Hollywood, FL | 1.0 | 1.0 | 500 | $1,399 | $2.80 | 2d | 1 | 1.24mi |
| 1944 Taft St Unit 2 Hollywood, FL | 2.0 | 2.0 | 750 | $1,800 | $2.40 | 7d | 1 | 1.25mi |
| 401 N Federal Hwy Hallandale Beach, FL | 1.0–3.0 | 1.0–2.0 | 973 | $1,892 | $1.94 | 15d | 48 | 1.25mi |
| 2111 Roosevelt St Unit 3 Hollywood, FL | 1.0 | 1.0 | 600 | $1,425 | $2.38 | 24d | 1 | 1.27mi |
| 2829 Van Buren St #208 Hollywood, FL | — | 1.0 | 460 | $1,300 | $2.83 | 13d | 1 | 1.28mi |
| 1947 Taft St Unit 0 Hollywood, FL | 2.0 | 2.0 | 650 | $1,900 | $2.92 | 24d | 1 | 1.28mi |
| 2806 Taylor St Hollywood, FL | — | 1.0 | 450 | $1,449 | $3.22 | 7d | 1 | 1.28mi |
| 2806 Taylor St Apt C Hollywood, FL | 2.0 | 2.0 | 650 | $2,295 | $3.53 | 24d | 1 | 1.28mi |
| 2806 Taylor St Apt C Hollywood, FL | 2.0 | 2.0 | 650 | $2,295 | $3.53 | 7d | 1 | 1.28mi |
| 1521 N 23rd Ave Hollywood, FL | 2.0 | 2.0 | 750 | $2,000 | $2.67 | 24d | 1 | 1.29mi |
| 1301 N 12th Ct Hollywood, FL | 1.0 | 1.0 | 465 | $1,588 | $3.41 | 12d | 2 | 1.30mi |
| 1301 N 12th Ct Unit 12A Hollywood, FL | 1.0 | 1.0 | 450 | $1,475 | $3.28 | 24d | 1 | 1.32mi |
| 2840 Taylor St #28 Hollywood, FL | 1.0 | 1.0 | 560 | $1,800 | $3.21 | 24d | 1 | 1.34mi |
| 2443 Cleveland St Unit 2 Hollywood, FL | 1.0 | 1.0 | 600 | $1,500 | $2.50 | 24d | 1 | 1.34mi |
| 836 NW 10th St Unit 4 Hallandale Beach, FL | — | 1.0 | 423 | $1,250 | $2.96 | 24d | 1 | 1.36mi |
| 2830 Fillmore St Unit 2 Hollywood, FL | 1.0 | 1.0 | 750 | $1,450 | $1.93 | 7d | 1 | 1.36mi |
| 2830 Fillmore St Unit 5 Hollywood, FL | 1.0 | 1.0 | 700 | $1,450 | $2.07 | 24d | 1 | 1.36mi |
| 2918 Jackson St Hollywood, FL | 2.0 | 1.0 | 750 | $1,700 | $2.27 | 3d | 1 | 1.36mi |
| 2918 Jackson St Unit 1 Hollywood, FL | 2.0 | 1.0 | 750 | $1,700 | $2.27 | 7d | 1 | 1.36mi |
HOA detail condo
- Monthly dues
- $232 · $2,784/yr
- Assessments
- None detected in remarks — confirm with the listing agent.
Listing history 23 events
-
2026-06-18days on market $179,900 Active 141 DOM
-
2026-06-17days on market $179,900 Active 140 DOM
-
2026-06-16days on market $179,900 Active 139 DOM
-
2026-06-15days on market $179,900 Active 138 DOM
-
2026-06-13days on market $179,900 Active 136 DOM
-
2026-06-09days on market $179,900 Active 132 DOM
-
2026-06-07days on market $179,900 Active 130 DOM
-
2026-06-04days on market $179,900 Active 127 DOM
-
2026-06-03days on market $179,900 Active 126 DOM
-
2026-06-02days on market $179,900 Active 125 DOM
-
2026-06-01days on market $179,900 Active 124 DOM
-
2026-05-31days on market $179,900 Active 123 DOM
-
2026-01-28$179,900 Active
-
2025-12-31historical
-
2025-04-03$179,900 Active
-
2024-01-24soldstatus $159,900
-
2024-01-01soldstatus $155,000 Closed 184-char remark
Show marketing remark (184 chars)
Excellent investor opportunity, unit rented for $1550 monthly until 8/31/2024 low Maintenace fees and excellent location. unit will only be shown to serious buyers with offer in hands.
-
2023-12-13status Pending 184-char remark
Show marketing remark (184 chars)
Excellent investor opportunity, unit rented for $1550 monthly until 8/31/2024 low Maintenace fees and excellent location. unit will only be shown to serious buyers with offer in hands.
-
2023-11-27price $159,900 184-char remark
Show marketing remark (184 chars)
Excellent investor opportunity, unit rented for $1550 monthly until 8/31/2024 low Maintenace fees and excellent location. unit will only be shown to serious buyers with offer in hands.
-
2023-11-17$169,900 Active 184-char remark
Show marketing remark (184 chars)
Excellent investor opportunity, unit rented for $1550 monthly until 8/31/2024 low Maintenace fees and excellent location. unit will only be shown to serious buyers with offer in hands.
-
2018-08-06soldstatus $85,000
-
1985-12-01soldstatus $27,500
-
1982-11-01soldstatus $32,000
ⓘ Source: listings_history table (triggers on properties + properties_extension) + one-shot
backfill from property_details.listing_events for pre-trigger history.
Tax reassessment forecast FL · Resets to sale price
- Current annual tax
- $3,389 · $282/mo
- Projected year-2 tax
- $3,389 · $282/mo
- Expected delta
- $0/yr ($0/mo · 0.0%)
ⓘ Screening estimate from a state-policy table — verify with the county assessor before closing.
Nearby sold comps map
Loading sold comps map…
Walkable amenities ~0.75 mi
Loading nearby amenities…
Taxation est. · year 1
- Rental income
- $25,849
- − Mortgage interest
- −$10,077
- − Property taxes
- −$3,389
- − Insurance
- −$900
- − Repairs & maintenance
- −$2,068
- − Management
- −$2,068
- − HOA
- −$2,784
- − Depreciation
- −$5,233
- Taxable loss
- −$670
- Est. tax savings @ 24.0%
- +$161
- After-tax cash flow
- $2,188/yr
For passive investors: Depreciation is non-cash, so a rental often shows a tax loss while cash-flowing — sheltering income. Rental losses are passive: they offset passive income freely, and up to $25,000/yr can offset ordinary (W-2) income if you actively participate and your MAGI is under $100k (phasing out to $0 by $150k); unused losses carry forward. On sale, claimed depreciation is recaptured at up to 25%, and gains may owe capital-gains tax (a 1031 exchange can defer both). Figures are a year-1 estimate at your 24.0% rate — not tax advice; consult a CPA.
Schools (NCES district)
- District
- Broward
- NCES district ID
- 1200180
- Math proficiency
- 42% ▼ -18.00%
- Reading proficiency
- 53% ▼ -5.00%
- Median HH income
- $52,139
- Composite
- 40.88/100
- National rank
- #3621
- State rank
- #46 of 73 in FL
Livability — Hollywood
- Score
- 76/100
- State rank
- #232
- US rank
- #3548
Category grades
Schools grade is shown separately in the Schools card above.
Census & demographics
- Census place
- Hollywood, FL
- County
- Broward County · 1,963,430 people
- City population
- 109,079
- Metro
- Miami-Fort Lauderdale-Pompano Beach, FL
- Population (ZIP)
- 46,322
- Household income
- $56,473
- Rent vs Own
- Severe rent burden
- 3948.0
Population outlook (Broward County) Hauer SSP2
- Today (2025)
- 2,207,033 people
- By 2030
- 2,360,704 · +7.0%
- By 2040
- 2,661,208 · +20.6%
- By 2050
- 2,946,698 · +33.5%
- By 2075
- 3,602,273 · +63.2%
- By 2100
- 3,970,984 · +79.9%
Race, ethnicity, and origin ACS 2023
- Neighborhood character
- Diverse neighborhood (Simpson 0.68)
- Race & ethnicity
- Hispanic / Latino 43% Two or more races 31% White 28% Black 24% Asian 1%
- Hispanic origin (detail)
- Mexican 1% Puerto Rican 4% Cuban 9% Dominican 3% Salvadoran 3%
- Common ancestry
- Hispanic 5% Lithuanian 2% Scotch-Irish 1%
- Foreign-born
- 41% · Canada, Jamaica, Dominican Republic
- Languages at home
- 48% English-only · Spanish 38% French/Haitian/Cajun 6% Russian/Polish/Slavic 2%
Political lean MEDSL · Broward
- 2024 margin
- D (+17.0) · D 58.0% · R 41.0%
- 2008→2024 swing
- -17.8pp toward R · 2008: 34.7pp · 2024: 17.0pp
- All cycles
- 2024: D+17.0 2020: D+29.8 2016: D+35.0 2012: D+34.9 2008: D+34.7
Not yet ingested
- Civics
- —
Market trends
- HPI YoY
- ▼ -406.34%
- Current HPI
- 524.7664
- Rent YoY
- ▲ 0.43%
- Metro
- Miami-Fort Lauderdale-Pompano Beach, FL
- State GDP YoY
- ▲ 3.28%
- F500 in state
- 36
Industry mix (Fortune 500 HQ in FL)
| Industry | F500 HQs | Revenue |
|---|---|---|
| Industrial Technology | 2 | $29B |
|
||
| Insurance | 2 | $17B |
|
||
| Retail | 1 | $60B |
|
||
| Technology Distribution | 1 | $58B |
|
||
| Homebuilding | 1 | $35B |
|
||
| Technology Manufacturing | 1 | $35B |
|
||
Price history
+462.2% since first listed11 events — show timeline
- 2026-01-28 Listed $179,900 MARMLS
- 2025-12-31 Listing Removed — MARMLS
- 2025-04-03 Listed $179,900 MARMLS
- 2024-01-24 Sold (Public Records) $159,900 Public Records
- 2024-01-01 Sold (MLS) $155,000 MARMLS
- 2023-12-13 Pending — MARMLS
- 2023-11-27 Price Changed $159,900 MARMLS
- 2023-11-17 Listed $169,900 MARMLS
- 2018-08-06 Sold (Public Records) $85,000 Public Records
- 1985-12-01 Sold (Public Records) $27,500 Public Records
- 1982-11-01 Sold (Public Records) $32,000 Public Records
Property tax history
+12.4%/yrLatest (2025): $3,389 · +11.0% YoY. Source: county tax records.
Cash-flow waterfall
monthlySold comps — $/sqft
last 12 mo · ≤1 miLoading sold comps…