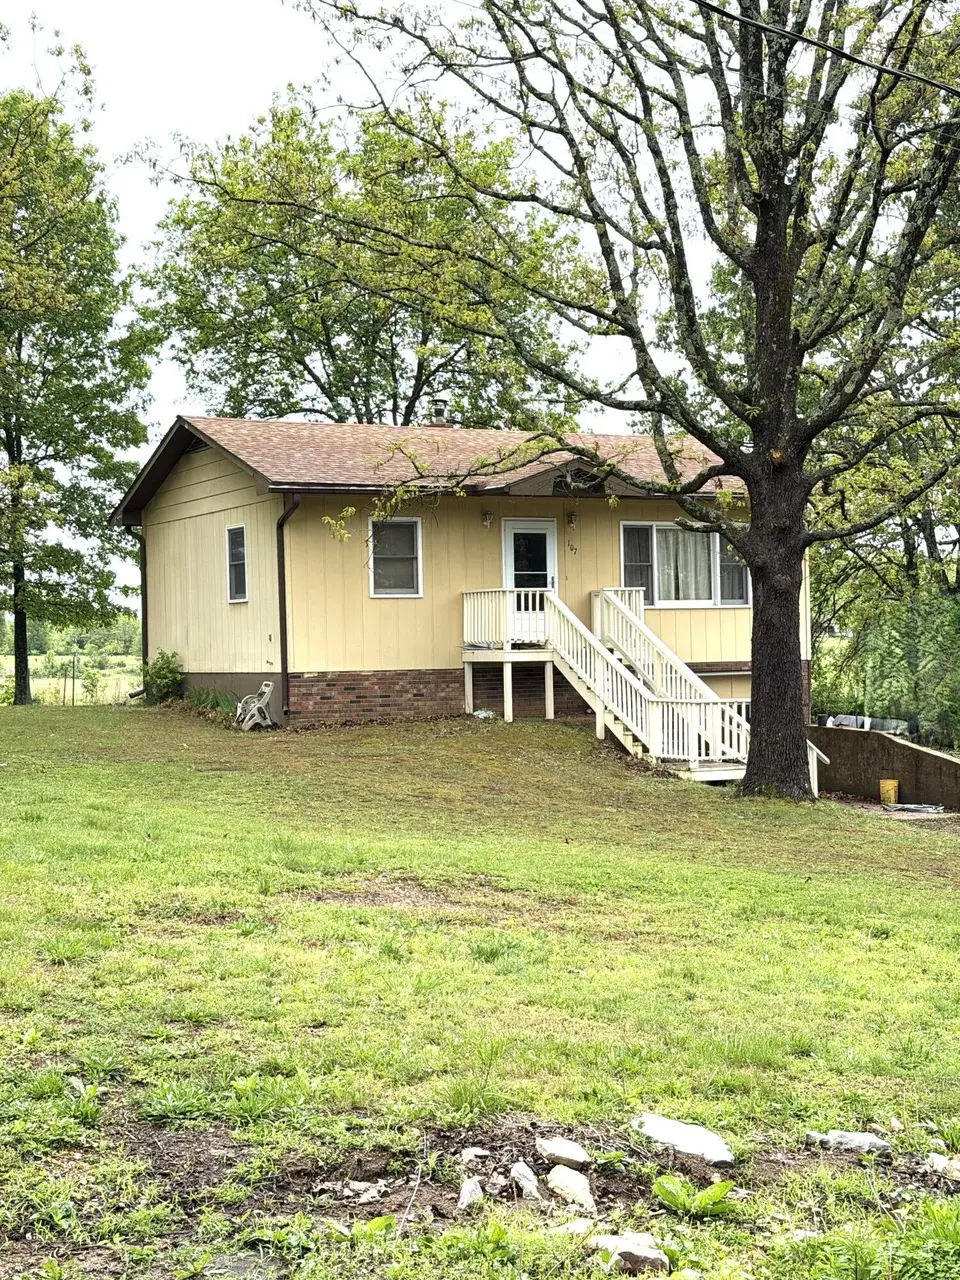
107 Angelica St · Mountain View, MO
Flood risk 1/10 · Minimal
- FEMA flood zone
- X (unshaded)
- Chance of flooding over 30 yrs
- 0.0%
- Est. flood insurance / yr
- $473 – $860
Fire risk 5/10 · Moderate
- Est. fire insurance / yr
- $1,054 – $1,958
Heat risk 5/10 · Moderate
- Hot days now (above 105°F)
- 7 days/yr
- Hot days in 30 yrs
- 19 days/yr
Wind risk 2/10 · Minimal
- Chance of severe wind over 30 yrs
- 1.0%
Air-quality risk 2/10 · Minimal
- Unhealthy air days now
- 0 days/yr
- Unhealthy air days in 30 yrs
- 1 days/yr
Risk factors via First Street. Map © Google.
Why this score? — see what drove the D- grade
The composite is a weighted blend of 9 inputs, each scored 0–100. Each bar is that input's sub-score; the figure is the points it added to the 100-point composite (weight × sub-score).
- Cash flow +11.4/30.0
- ARV discount +7.5/15.0
- Livability +3.4/5.0
- DSCR +3.3/10.0
- Schools +3.3/10.0
- Rent growth +2.5/5.0
- Condition / age +2.5/5.0
- 1% rule +2.2/10.0
- Appreciation +0.0/10.0
$114,900
🖨 Deal sheet (PDF) 📄 Offer letter ✓ Due diligence
Listing remarks
Charming Mountain View Starter Home - Double Lot & Cozy Amenities!Discover this delightful 1-bedroom home built in 1981, perfectly situated on a generous double lot in Mountain View, MO. Ready for its new chapter, this cozy residence offers comfort and convenience. The inviting interior features a cute kitchen complete with an island, electric stove, and refrigerator - ideal for casual dining and entertaining. Enjoy year-round comfort with central AC and central electric heat. Downstairs, the basement provides extra living space with an additional room and a convenient unfinished half-bath, offering flexibility for a guest area, home office, or hobby space. Car enthusiasts and DIYers
Key facts
- Central ac
- Extra living space
- Double lot
Tags
Property features AI
Exterior
- Parking: Driveway; 1-car garage
- Security: Smoke detector(s)
- Utilities: Public water; Public sewer
- Home design: Single family residence; One story
- Construction: Lap siding; Composition roof
- Exterior features: Deck; Front porch; Partial fencing; Has view; Asphalt road surface; Public maintained road; City street frontage; Lot approximately 0.47 acres (145 x 140)
Interior
- Kitchen: Electric oven; Free-standing electric oven; Refrigerator
- Bedrooms: Bedrooms located on main level
- Flooring: Carpet
- Bathrooms: 1 full bathroom
- Heating & cooling: Central heating; Electric heating; Wood heating; Central air; Ceiling fan(s)
- Interior features: High speed internet; Smoke detector(s)
- Laundry & utility: Laundry in basement; Basement has bath stubbed and partially finished areas; Basement includes concrete floor, storage space, and walk-up access; Full basement
Neighborhood map
What this means for you Summary
Snapshot
- This is a 1-bed/1.0-bath other listed at $115k.
Deal economics
- At list price, monthly cash flow is $-40 ($-482/yr) — negative.
- To cash-flow at today's rent, offer at most $108k (6.2% below list).
- To meet the 1% rule (rent ≥ 1% of price), the offer needs to be $82k (28.5% below list).
- Recommended offer: $82k (28.5% below list) — sets the bar for 1% rule.
- Cap rate 5.9% vs local median 3.9% in Mountain View — top-decile yield for the area; either an underpriced asset or a hidden risk that comps aren't pricing in. Stress-test before assuming the spread holds.
Location & tenants
- Location reads 67/100 on livability (#212 in MO) — a middle-class / working-renter tenant base. Strengths: cost of living A+, housing A+, crime B+; Watch: employment C-, amenities F, commute F.
- Mountain View-Birch Tree R-III (rural): math 41% / reading 41% proficiency, ranked #158 of 324 in MO (top 49%) — families likely to look elsewhere, expect single-tenant / working-renter base with shorter leases.
- Zoned schools: Mountain View Elem. (math 40% / reading 41%, grade F, #525 of 1,115 statewide, top 47%, 404 students, 55% FRL); Liberty Middle (math 37% / reading 38%, grade F, #215 of 391 statewide, top 56%, 301 students, 67% FRL); Liberty Sr. High (math 67% / reading 57%, grade B-, #28 of 521 statewide, top 6%, 341 students, 59% FRL) — zoned schools at 60% FRL track the district average.
- Market conditions: 62 active listings in the ZIP; 53 units permitted in Howell County in 2024 (0 in 5+ unit buildings).
Forward outlook
- Local home prices are declining (-3.0%/yr); year-one equity from $794 of loan paydown is wiped out by about $3k of value loss. Plan a longer hold.
- Howell County population projected at -18% by 2050 — secular population decline; favor cash flow + early exit over multi-decade hold.
Negotiation context
- It's been on market 36 days — a 3% lower offer ($111k) is reasonable based on typical stale-listing flexibility.
Risks & watch-outs
- Climate carrying-cost: moderate wildfire risk; extreme-heat days projected 7→19/yr by 2055 (HVAC capex compounding) — expect insurance premiums to compound above CPI over the hold.
Questions for the listing agent
- What do current leases actually rent for vs. the listed asking? Can we see a recent rent roll and the last 12 months of T-12 income?
- It's been on market 36 days. Have you received any prior offers? Is the seller open to a 28% concession, seller financing, or rate buy-down credit?
- Is there a deadline driving the sale (1031 exchange, divorce, estate, relocation)? That informs how much negotiation room exists.
- Schools are F-rated, which usually means shorter tenancies and higher turnover. Who's the typical renter profile here, and what's been the actual vacancy rate?
- The area grade is low — what's the realistic commute time and amenity access for the typical tenant pool here? Any planned neighborhood developments (good or bad) we should know about?
- What's the average days-on-market for RENTAL listings here right now (not sales)? A rising rental-DOM trend means longer vacancies and softer asking-rent achievability than the comps imply.
- What's the recent tenant-quality profile in this submarket — average credit score on applications, eviction rate, late-payment / NSF rate, and stable-employment percentage? A property-management company in the area should have these aggregated.
- How much new for-sale + rental construction is in the pipeline within 1–3 miles? Heavy new supply typically softens prices + rents 12–24 months out; constrained supply supports both.
Investment metrics
- 1% rule
- 0.72% ✗
- Cap rate
- 5.87%
- Cash-on-cash
- -1.50%
- DSCR
- 0.93
- GRM
- 11.6
CMA / ARV
No comps found within radius.
Projected returns pro-forma
-3.0% appreciation · 3.0% rent growth · sell at horizon
- IRR
- -18.8%
- Equity multiple
- 0.34×
- Total profit
- $-21,226
- Equity at exit
- $17,132
- IRR
- -11.4%
- Equity multiple
- 0.32×
- Total profit
- $-21,985
- Equity at exit
- $9,934
Cash invested: $32,172 (down + closing). Projections, not guarantees.
Landlord ↔ Tenant lean methodology
- Overall (STATE)
- 81 Strongly Landlord-Friendly
- State Missouri
- 81 Strongly Landlord-Friendly · R+10
- County
- — inherits STATE
- City
- — inherits STATE
ZIP-level market 65548
- Home prices YoY
- -9.3%
- Active inventory
- 62
- Price-to-rent
- 11.6×
Monthly cashflow live
- Estimated rent
- $822 medium interval (Pro) →
- Mortgage (P&I)
- −$603
- Tax from tax record
- −$39 /mo · $469/yr
- Insurance
- −$48
- HOA
- −$0
- Vacancy / Maint / Mgmt
- −$173
- Net cashflow
- $-40
Break-even live
Sensitivity live
| Price | -10% $25 | -5% $-8 | +0% $-40 | +5% $-73 | +10% $-105 |
|---|---|---|---|---|---|
| Rent | -10% $-105 | -5% $-73 | +0% $-40 | +5% $-8 | +10% $25 |
| Rate | -1.0pp $18 | -0.5pp $-11 | base $-40 | +0.5pp $-70 | +1.0pp $-100 |
UW: 25.0% down · 7.5% · 30yr · 1.5% tax · 5.0% vac · 8.0% maint · 8.0% mgmt
Financing live
Cash to close
- Down payment
- $28,725
- Closing costs
- $3,447
- Reserves months
- —
- Total cash needed
- —
Loan-product check · same deal, 3 products live
Conventional
25% down · 7.5% · 30yr
- Down + closing
- —
- Monthly P&I
- —
- Monthly cashflow
- —
- DSCR
- —
- Eligible?
- —
Personal DTI + credit; lowest rate.
DSCR
20% down · 8.5% · 30yr
- Down + closing
- —
- Monthly P&I
- —
- Monthly cashflow
- —
- DSCR
- —
- Eligible?
- —
No personal income docs; deal must DSCR.
Hard money
10% down · 12.0% · 12mo
- Down + closing
- —
- Monthly P&I
- —
- Monthly cashflow
- —
- DSCR
- —
- Eligible?
- —
Short-term bridge; refi at stabilization.
Listing history 12 events
-
2026-06-22days on market $114,900 Active 36 DOM
-
2026-06-21days on market $114,900 Active 35 DOM
-
2026-06-21days on market $114,900 Active 34 DOM
-
2026-06-18days on market $114,900 Active 32 DOM
-
2026-06-17days on market $114,900 Active 31 DOM
-
2026-06-16days on market $114,900 Active 30 DOM
-
2026-06-16status $114,900 Active 29 DOM
-
2026-05-23status Pending
-
2026-04-29historical Active Under Contract
-
2026-04-24$114,900 Active
-
2016-06-20soldstatus
-
1990-11-14soldstatus
ⓘ Source: listings_history table (triggers on properties + properties_extension) + one-shot
backfill from property_details.listing_events for pre-trigger history.
Tax reassessment forecast MO · Resets to sale price
- Current annual tax
- $469 · $39/mo
- Projected year-2 tax
- $1,115 · $93/mo
- Expected delta
- +$646/yr (+$54/mo · 137.9%)
ⓘ Screening estimate from a state-policy table — verify with the county assessor before closing.
Climate risk First Street
- Flood 1/10 Low FEMA zone X (unshaded) · 0% chance over 30 yrs
- Wildfire 5/10 Major
- Heat 5/10 Major 7 d/yr ≥105°F today · 19 d/yr by 30 yrs out
- Wind 2/10 Low 100% chance of damaging wind over 30 yrs
- Air quality 2/10 Low 0 unhealthy d/yr today · 1 by 30 yrs out
Nearby sold comps map
Loading sold comps map…
Walkable amenities ~0.75 mi
Loading nearby amenities…
Taxation est. · year 1
- Rental income
- $9,863
- − Mortgage interest
- −$6,436
- − Property taxes
- −$469
- − Insurance
- −$574
- − Repairs & maintenance
- −$789
- − Management
- −$789
- − Depreciation
- −$3,343
- Taxable loss
- −$2,537
- Est. tax savings @ 24.0%
- +$609
- After-tax cash flow
- $127/yr
For passive investors: Depreciation is non-cash, so a rental often shows a tax loss while cash-flowing — sheltering income. Rental losses are passive: they offset passive income freely, and up to $25,000/yr can offset ordinary (W-2) income if you actively participate and your MAGI is under $100k (phasing out to $0 by $150k); unused losses carry forward. On sale, claimed depreciation is recaptured at up to 25%, and gains may owe capital-gains tax (a 1031 exchange can defer both). Figures are a year-1 estimate at your 24.0% rate — not tax advice; consult a CPA.
Schools (NCES district)
- District
- Mountain View-Birch Tree R-III
- NCES district ID
- 2921540
- Math proficiency
- 41% ▲ 6.00%
- Reading proficiency
- 41% ▼ -1.00%
- Median HH income
- $28,871
- Composite
- 33.31/100
- National rank
- #5505
- State rank
- #158 of 324 in MO
Livability — Mountain View
- Score
- 67/100
- State rank
- #212
- US rank
- #10599
Category grades
Schools grade is shown separately in the Schools card above.
Census & demographics
- Census place
- Mountain View, MO
- City population
- 6,432
- Population (ZIP)
- 6,432
Population outlook (Howell County) Hauer SSP2
- Today (2025)
- 38,462 people
- By 2030
- 37,240 · -3.2%
- By 2040
- 34,495 · -10.3%
- By 2050
- 31,450 · -18.2%
- By 2075
- 23,660 · -38.5%
- By 2100
- 16,373 · -57.4%
Race, ethnicity, and origin ACS 2023
- Neighborhood character
- Predominantly White (93%)
- Race & ethnicity
- White 93% Two or more races 4% Hispanic / Latino 4%
- Common ancestry
- Lithuanian 6% Subsaharan African 3% Serbian 2%
- Foreign-born
- 1% · Canada
- Languages at home
- 99% English-only · Spanish 1%
Political lean MEDSL · Howell
- 2024 margin
- Solid R (+66.8) · D 16.2% · R 83.0%
- 2008→2024 swing
- -36.0pp toward R · 2008: -30.8pp · 2024: -66.8pp
- All cycles
- 2024: R+66.8 2020: R+64.2 2016: R+63.2 2012: R+43.8 2008: R+30.8
Not yet ingested
- Civics
- —
Market trends
- HPI YoY
- ▼ -21.62%
- Current HPI
- 211.4148
- Rent YoY
- —
- Metro
- —
- State GDP YoY
- ▲ 1.84%
- F500 in state
- 20
Industry mix (Fortune 500 HQ in MO)
| Industry | F500 HQs | Revenue |
|---|---|---|
| Healthcare | 1 | $163B |
|
||
| Insurance | 1 | $21B |
|
||
| Industrial Technology | 1 | $17B |
|
||
| Retail | 1 | $16B |
|
||
| Industrial Distribution | 1 | $10B |
|
||
| Utilities | 1 | $9B |
|
||
Price history
5 events — show timeline
- 2026-05-23 Pending — SOMO
- 2026-04-29 Contingent — SOMO
- 2026-04-24 Listed $114,900 SOMO
- 2016-06-20 Sold (Public Records) — Public Records
- 1990-11-14 Sold (Public Records) — Public Records
Property tax history
+1.4%/yrLatest (2025): $469 · +0.1% YoY. Source: county tax records.
Cash-flow waterfall
monthlySold comps — $/sqft
last 12 mo · ≤1 miLoading sold comps…