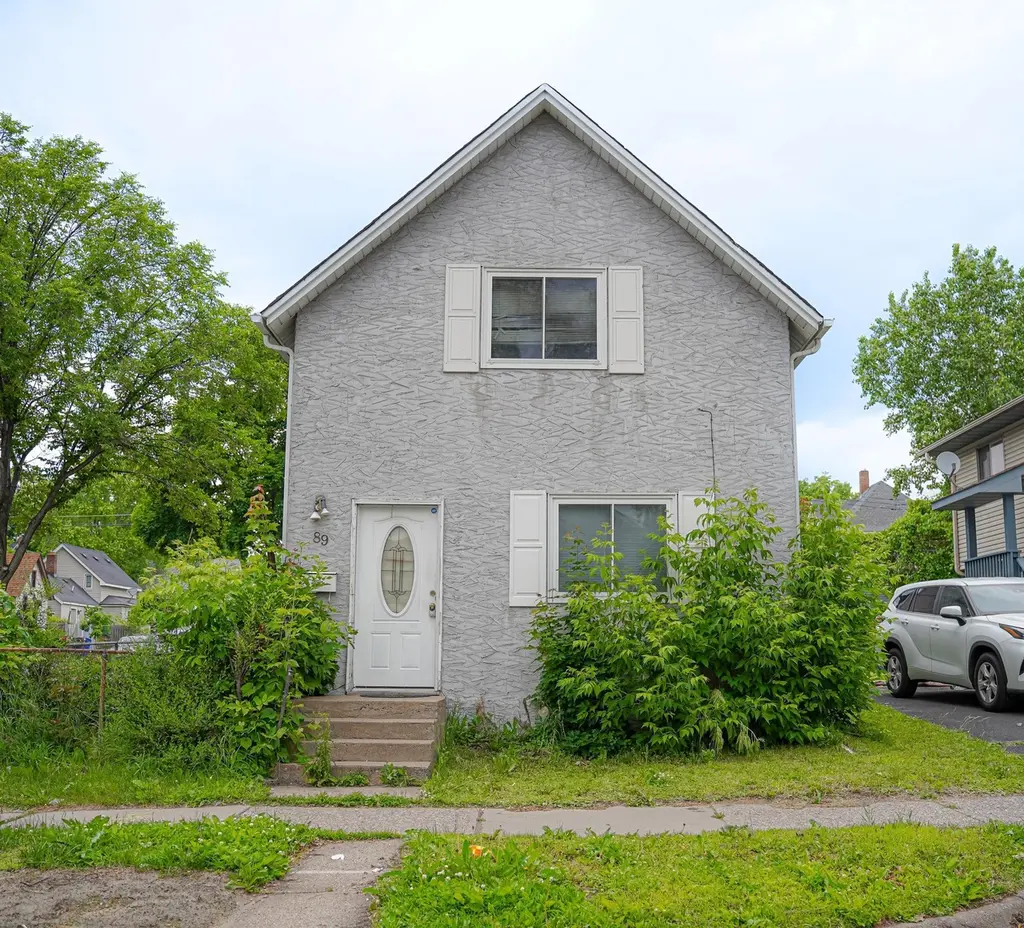
89 Winnipeg Ave · St. Paul, MN
Flood risk 1/10 · Minimal
- FEMA flood zone
- X (unshaded)
- Chance of flooding over 30 yrs
- 0.0%
- Est. flood insurance / yr
- $507 – $1,088
Fire risk 1/10 · Minimal
- Est. fire insurance / yr
- $888 – $1,650
Heat risk 2/10 · Minimal
- Hot days now (above 99°F)
- 7 days/yr
- Hot days in 30 yrs
- 14 days/yr
Wind risk 2/10 · Minimal
- Chance of severe wind over 30 yrs
- —
Air-quality risk 2/10 · Minimal
- Unhealthy air days now
- 1 days/yr
- Unhealthy air days in 30 yrs
- 1 days/yr
Risk factors via First Street. Map © Google.
Why this score? — see what drove the B- grade
The composite is a weighted blend of 9 inputs, each scored 0–100. Each bar is that input's sub-score; the figure is the points it added to the 100-point composite (weight × sub-score).
- Cash flow +29.2/30.0
- DSCR +10.0/10.0
- 1% rule +8.7/10.0
- ARV discount +7.5/15.0
- Rent growth +3.4/5.0
- Livability +2.5/5.0
- Condition / age +2.5/5.0
- Schools +2.4/10.0
- Appreciation +0.0/10.0
$189,900
🖨 Deal sheet 📄 Offer letter ✓ Due diligence
Listing remarks MLS
Great Starter Home. Close to the Capital, restaurants. Property is in a need of updating. Great opportunity to build equity. Cash or Conventional loan only.
Key facts
- 6,403 sq ft lot
- 2 garage spots
- Built 1879
Neighborhood map
What this means for you Summary
Snapshot
- This is a 4-bed/2.0-bath single-family listed at $190k.
Deal economics
- At list price, monthly cash flow is $663 ($8k/yr) — positive.
- The deal already cash-flows at list — no discount required.
- Meets the 1% rule at list price ($3k rent vs $190k).
- Recommended offer: $167k (12.0% below list) — sets the bar for market timing.
Location & tenants
- Location reads: area grade B — affects rentability + tenant quality, not the cash-flow math above.
- St. Paul Public School District (urban): math 21% / reading 33% proficiency, ranked #270 of 301 in MN (top 90%) — low school quality limits family demand, transient renter base, plan for 1-2y turnover; 64% free/reduced lunch — lower-income household profile, screen leases tightly.
- Market conditions: Rents rising (+3.6%/yr); 170 active listings in the ZIP; 2 comparable units currently listed for rent nearby; 1,202 units permitted in Ramsey County in 2024 (880 in 5+ unit buildings).
- This rent runs 44% of the median local income ($71k/yr) — at the standard rent-burdened threshold; future hikes will face affordability resistance.
Forward outlook
- Local home prices are declining (-3.0%/yr); year-one equity from $1k of loan paydown is wiped out by about $6k of value loss. Plan a longer hold.
- Ramsey County population projected at +27% by 2050 — long-run rental-demand tailwind backs the buy-and-hold thesis.
- At projected returns (-3.0% appreciation + 3.6% rent growth), your $53k cash investment doubles in ~8 years — after that, you're playing with house money.
Negotiation context
- It's been on market 287 days — a 12% lower offer ($167k) is reasonable based on typical stale-listing flexibility.
- 10 sale attempts since 26y ago; this cycle's ask has dropped $10k (5%) from the opening price — seller is motivated, your offer sets the floor, not the list.
- Current owner paid $140k; 36% above their basis — modest negotiation headroom, anchor on the comps not their cost.
Risks & watch-outs
- Watch-outs: built in 1879 — expect roof / HVAC / electrical / plumbing capex.
Questions for the listing agent
- It's been on market 287 days. Have you received any prior offers? Is the seller open to a 12% concession, seller financing, or rate buy-down credit?
- Built in 1879 — when were the roof, HVAC, electrical panel, plumbing, and water heater last replaced?
- Why hasn't it sold? Are there any deal-killer items the seller is aware of (foundation, flood, title, zoning, code violations)?
- Is there a deadline driving the sale (1031 exchange, divorce, estate, relocation)? That informs how much negotiation room exists.
- What's the average days-on-market for RENTAL listings here right now (not sales)? A rising rental-DOM trend means longer vacancies and softer asking-rent achievability than the comps imply.
- What's the recent tenant-quality profile in this submarket — average credit score on applications, eviction rate, late-payment / NSF rate, and stable-employment percentage? A property-management company in the area should have these aggregated.
- How much new for-sale + rental construction is in the pipeline within 1–3 miles? Heavy new supply typically softens prices + rents 12–24 months out; constrained supply supports both.
Investment metrics
- 1% rule
- 1.37% ✓
- Cap rate
- 10.48%
- Cash-on-cash
- 14.97%
- DSCR
- 1.67
- GRM
- 6.1
CMA / ARV
No comps found within radius.
Projected returns pro-forma
-3.0% appreciation · 3.6% rent growth · sell at horizon
- IRR
- 6.3%
- Equity multiple
- 1.25×
- Total profit
- $13,150
- Equity at exit
- $28,315
- IRR
- 16.3%
- Equity multiple
- 2.37×
- Total profit
- $72,796
- Equity at exit
- $16,419
Cash invested: $53,172 (down + closing). Projections, not guarantees.
Landlord ↔ Tenant lean methodology
- Overall (STATE)
- 46 Balanced
- State Minnesota
- 46 Balanced · D+2
- County
- — inherits STATE
- City
- — inherits STATE
ZIP-level market 55117
- Rents YoY
- 3.6%
- Active inventory
- 170
- Price-to-rent
- 6.1×
Monthly cashflow live
- Estimated rent
- $2,607 medium interval (Pro) →
- Mortgage (P&I)
- −$996
- Tax from tax record
- −$321 /mo · $3,852/yr
- Insurance
- −$79
- HOA
- −$0
- Vacancy / Maint / Mgmt
- −$547
- Net cashflow
- $663
Break-even live
UW: 25.0% down · 7.5% · 30yr · 1.5% tax · 5.0% vac · 8.0% maint · 8.0% mgmt
Financing live
Cash to close
- Down payment
- $47,475
- Closing costs
- $5,697
- Reserves months
- —
- Total cash needed
- —
Loan-product check · same deal, 3 products live
Conventional
25% down · 7.5% · 30yr
- Down + closing
- —
- Monthly P&I
- —
- Monthly cashflow
- —
- DSCR
- —
- Eligible?
- —
Personal DTI + credit; lowest rate.
DSCR
20% down · 8.5% · 30yr
- Down + closing
- —
- Monthly P&I
- —
- Monthly cashflow
- —
- DSCR
- —
- Eligible?
- —
No personal income docs; deal must DSCR.
Hard money
10% down · 12.0% · 12mo
- Down + closing
- —
- Monthly P&I
- —
- Monthly cashflow
- —
- DSCR
- —
- Eligible?
- —
Short-term bridge; refi at stabilization.
Rent comps 2 comps
| Address | Beds | Baths | Sqft | Rent | $/sqft | DOM | Units | Dist |
|---|---|---|---|---|---|---|---|---|
| 101 10th St E Saint Paul, MN | 3.0 | 1.0–2.0 | 887 | $2,490 | $2.81 | 2d | 25 | 1.22mi |
| 255 Western Ave N Saint Paul, MN | 3.0 | 1.0–2.0 | 1049 | $3,700 | $3.53 | 2d | 23 | 1.45mi |
Listing history 46 events
-
2026-06-18days on market $189,900 Active 287 DOM
-
2026-06-17days on market $189,900 Active 286 DOM
-
2026-06-16days on market $189,900 Active 285 DOM
-
2026-06-15days on market $189,900 Active 284 DOM
-
2026-06-13days on market $189,900 Active 282 DOM
-
2026-06-09days on market $189,900 Active 278 DOM
-
2026-06-08days on market $189,900 Active 277 DOM
-
2026-06-07days on market $189,900 Active 276 DOM
-
2026-06-04days on market $189,900 Active 273 DOM
-
2026-06-03days on market $189,900 Active 272 DOM
-
2026-06-02days on market $189,900 Active 271 DOM
-
2026-06-01days on market $189,900 Active 270 DOM
-
2026-05-31days on market $189,900 Active 269 DOM
-
2026-03-04status Active 160-char remark
Show marketing remark (160 chars)
Great Starter Home. Close to the Capital, restaurants. Property is in a need of updating. Great opportunity to build equity. Cash or Conventional loan only.
-
2026-03-04historical 160-char remark
Show marketing remark (160 chars)
Great Starter Home. Close to the Capital, restaurants. Property is in a need of updating. Great opportunity to build equity. Cash or Conventional loan only.
-
2025-09-18price $189,900 160-char remark
Show marketing remark (160 chars)
Great Starter Home. Close to the Capital, restaurants. Property is in a need of updating. Great opportunity to build equity. Cash or Conventional loan only.
-
2025-09-04$199,900 Active 160-char remark
Show marketing remark (160 chars)
Great Starter Home. Close to the Capital, restaurants. Property is in a need of updating. Great opportunity to build equity. Cash or Conventional loan only.
-
2025-09-02historical
-
2025-07-18historical Contingent - Inspection
-
2025-06-10$199,900 Active
-
2019-05-14soldstatus $140,000
-
2019-04-30soldstatus $140,000 Sold
-
2019-03-20status Pending
-
2019-03-08historical Contingent - Inspection
-
2019-02-04price $140,000
-
2019-01-17price $154,900
-
2018-12-21$170,000 Active
-
2011-04-19soldstatus $94,900
-
2011-03-15soldstatus $94,900
-
2011-01-15historical
-
2010-12-14$94,900
-
2010-08-25soldstatus $35,000
-
2010-08-17historical
-
2010-04-23$38,500
-
2006-11-23soldstatus $136,000
-
2006-10-20historical
-
2006-06-16historical
-
2006-04-14$154,900
-
2006-04-14$127,900
-
2005-08-15historical
-
2005-04-20$169,900
-
2001-06-27soldstatus $132,000
-
2001-03-23soldstatus $128,000
-
2001-01-11historical
-
2000-11-10$129,900
-
1999-05-10soldstatus $74,000
ⓘ Source: listings_history table (triggers on properties + properties_extension) + one-shot
backfill from property_details.listing_events for pre-trigger history.
Tax reassessment forecast MN · Partial reset (capped growth)
- Current annual tax
- $3,852 · $321/mo
- Projected year-2 tax
- $3,852 · $321/mo
- Expected delta
- $0/yr ($0/mo · 0.0%)
ⓘ Screening estimate from a state-policy table — verify with the county assessor before closing.
Climate risk First Street
- Flood 1/10 Low FEMA zone X (unshaded) · 0% chance over 30 yrs
- Wildfire 1/10 Low
- Heat 2/10 Low 7 d/yr ≥99°F today · 14 d/yr by 30 yrs out
- Wind 2/10 Low
- Air quality 2/10 Low 1 unhealthy d/yr today · 1 by 30 yrs out
Nearby sold comps map
Loading sold comps map…
Walkable amenities ~0.75 mi
Loading nearby amenities…
Taxation est. · year 1
- Rental income
- $31,281
- − Mortgage interest
- −$10,637
- − Property taxes
- −$3,852
- − Insurance
- −$950
- − Repairs & maintenance
- −$2,502
- − Management
- −$2,502
- − Depreciation
- −$5,524
- Taxable income
- $5,313
- Est. tax owed @ 24.0%
- −$1,275
- After-tax cash flow
- $6,685/yr
For passive investors: Depreciation is non-cash, so a rental often shows a tax loss while cash-flowing — sheltering income. Rental losses are passive: they offset passive income freely, and up to $25,000/yr can offset ordinary (W-2) income if you actively participate and your MAGI is under $100k (phasing out to $0 by $150k); unused losses carry forward. On sale, claimed depreciation is recaptured at up to 25%, and gains may owe capital-gains tax (a 1031 exchange can defer both). Figures are a year-1 estimate at your 24.0% rate — not tax advice; consult a CPA.
Schools (NCES district)
- District
- St. Paul Public School District
- NCES district ID
- 2733840
- Math proficiency
- 21% ▼ -11.00%
- Reading proficiency
- 33% ▼ -7.00%
- Median HH income
- $48,316
- Composite
- 23.51/100
- National rank
- #7868
- State rank
- #270 of 301 in MN
Livability — St. Paul
No livability data for this city. (Only ~50 U.S. cities are tracked.)
Census & demographics
- Census place
- St. Paul, MN
- County
- Ramsey County · 542,837 people
- City population
- 280,599
- Metro
- Minneapolis-St. Paul-Bloomington, MN-WI
- Population (ZIP)
- 44,697
- Household income
- $70,771
- Rent vs Own
- Severe rent burden
- 1588.0
Population outlook (Ramsey County) Hauer SSP2
- Today (2025)
- 603,431 people
- By 2030
- 636,459 · +5.5%
- By 2040
- 700,596 · +16.1%
- By 2050
- 765,819 · +26.9%
- By 2075
- 929,297 · +54.0%
- By 2100
- 1,053,924 · +74.7%
Race, ethnicity, and origin ACS 2023
- Neighborhood character
- Highly diverse neighborhood (Simpson 0.72)
- Race & ethnicity
- White 44% Asian 24% Black 15% Hispanic / Latino 10% Two or more races 10%
- Hispanic origin (detail)
- Mexican 7%
- Common ancestry
- Portuguese 6% Romanian 3% Lithuanian 2%
- Foreign-born
- 21% · Canada, Philippines, India
- Languages at home
- 68% English-only · Other Asian/Pacific 15% Spanish 8% Other Indo-European 2%
Political lean MEDSL · Ramsey
- 2024 margin
- Solid D (+43.3) · D 70.5% · R 27.2% · Other 2.3%
- 2008→2024 swing
- +9.4pp toward D · 2008: 33.9pp · 2024: 43.3pp
- All cycles
- 2024: D+43.3 2020: D+45.4 2016: D+39.4 2012: D+35.3 2008: D+33.9
Not yet ingested
- Civics
- —
Market trends
- HPI YoY
- ▼ -308.56%
- Current HPI
- 267.4216
- Rent YoY
- ▲ 3.60%
- Metro
- Minneapolis-St. Paul-Bloomington, MN-WI
- State GDP YoY
- ▲ 2.41%
- F500 in state
- 34
Industry mix (Fortune 500 HQ in MN)
| Industry | F500 HQs | Revenue |
|---|---|---|
| Healthcare | 2 | $407B |
|
||
| Retail | 2 | $150B |
|
||
| Consumer Goods | 2 | $32B |
|
||
| Industrial Machinery | 2 | $6B |
|
||
| Agriculture | 1 | $40B |
|
||
| Healthcare / Medical Devices | 1 | $32B |
|
||
Price history
+156.6% since first listed33 events — show timeline
- 2026-03-04 Relisted — NORTHSTARMLS as Distributed by MLS Grid
- 2026-03-04 Listing Removed — NORTHSTARMLS as Distributed by MLS Grid
- 2025-09-18 Price Changed $189,900 NORTHSTARMLS as Distributed by MLS Grid
- 2025-09-04 Listed $199,900 NORTHSTARMLS as Distributed by MLS Grid
- 2025-09-02 Listing Removed — NORTHSTARMLS as Distributed by MLS Grid
- 2025-07-18 Contingent — NORTHSTARMLS as Distributed by MLS Grid
- 2025-06-10 Listed $199,900 NORTHSTARMLS as Distributed by MLS Grid
- 2019-05-14 Sold (Public Records) $140,000 Public Records
- 2019-04-30 Sold (MLS) $140,000 NORTHSTARMLS as Distributed by MLS Grid
- 2019-03-20 Pending — NORTHSTARMLS as Distributed by MLS Grid
- 2019-03-08 Contingent — NORTHSTARMLS as Distributed by MLS Grid
- 2019-02-04 Price Changed $140,000 NORTHSTARMLS as Distributed by MLS Grid
- 2019-01-17 Price Changed $154,900 NORTHSTARMLS as Distributed by MLS Grid
- 2018-12-21 Listed $170,000 NORTHSTARMLS as Distributed by MLS Grid
- 2011-04-19 Sold (Public Records) $94,900 Public Records
- 2011-03-15 Sold (MLS) $94,900 NORTHSTARMLS as Distributed by MLS Grid
- 2011-01-15 Listing Removed — NORTHSTARMLS as Distributed by MLS Grid
- 2010-12-14 Listed $94,900 NORTHSTARMLS as Distributed by MLS Grid
- 2010-08-25 Sold (MLS) $35,000 NORTHSTARMLS as Distributed by MLS Grid
- 2010-08-17 Listing Removed — NORTHSTARMLS as Distributed by MLS Grid
- 2010-04-23 Listed $38,500 NORTHSTARMLS as Distributed by MLS Grid
- 2006-11-23 Sold (MLS) $136,000 NORTHSTARMLS as Distributed by MLS Grid
- 2006-10-20 Listing Removed — NORTHSTARMLS as Distributed by MLS Grid
- 2006-06-16 Listing Removed — NORTHSTARMLS as Distributed by MLS Grid
- 2006-04-14 Listed $127,900 NORTHSTARMLS as Distributed by MLS Grid
- 2006-04-14 Listed $154,900 NORTHSTARMLS as Distributed by MLS Grid
- 2005-08-15 Listing Removed — NORTHSTARMLS as Distributed by MLS Grid
- 2005-04-20 Listed $169,900 NORTHSTARMLS as Distributed by MLS Grid
- 2001-06-27 Sold (Public Records) $132,000 Public Records
- 2001-03-23 Sold (MLS) $128,000 NORTHSTARMLS as Distributed by MLS Grid
- 2001-01-11 Listing Removed — NORTHSTARMLS as Distributed by MLS Grid
- 2000-11-10 Listed $129,900 NORTHSTARMLS as Distributed by MLS Grid
- 1999-05-10 Sold (Public Records) $74,000 Public Records
Property tax history
+10.5%/yrLatest (2025): $3,852 · +21.3% YoY. Source: county tax records.
Cash-flow waterfall
monthlySold comps — $/sqft
last 12 mo · ≤1 miLoading sold comps…