5012 NE Tradewinds Cir · Port LaBelle, FL
Flood risk 1/10 · Minimal
- FEMA flood zone
- X (unshaded)
- Chance of flooding over 30 yrs
- 0.0%
- Est. flood insurance / yr
- $507 – $1,088
Fire risk 2/10 · Minimal
- Est. fire insurance / yr
- $947 – $1,759
Heat risk 9/10 · Severe
- Hot days now (above 108°F)
- 7 days/yr
- Hot days in 30 yrs
- 25 days/yr
Wind risk 10/10 · Severe
- Chance of severe wind over 30 yrs
- 99.0%
Air-quality risk 2/10 · Minimal
- Unhealthy air days now
- 0 days/yr
- Unhealthy air days in 30 yrs
- 1 days/yr
Risk factors via First Street. Map © Google.
Why this score? — see what drove the D grade
The composite is a weighted blend of 9 inputs, each scored 0–100. Each bar is that input's sub-score; the figure is the points it added to the 100-point composite (weight × sub-score).
- Appreciation +10.0/10.0
- Cash flow +8.4/30.0
- ARV discount +7.5/15.0
- Schools +3.1/10.0
- Livability +3.1/5.0
- 1% rule +2.6/10.0
- Rent growth +2.5/5.0
- Condition / age +2.5/5.0
- DSCR +2.3/10.0
$287,990
🖨 Deal sheet 📄 Offer letter ✓ Due diligence
Listing remarks MLS
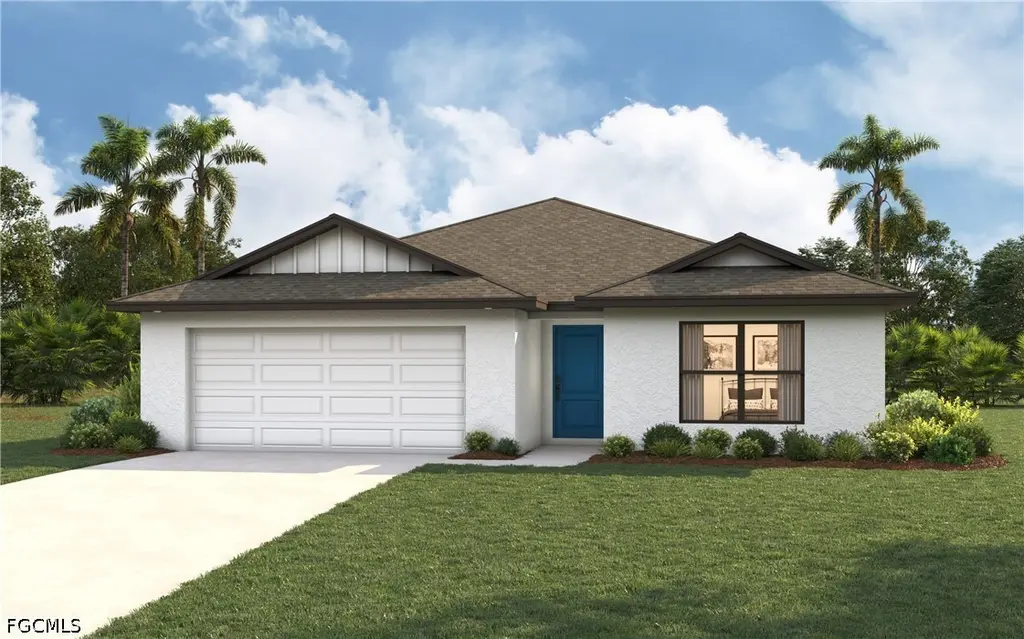
Beautiful Lot close to schools. Ready to Build!!
Key facts
- Dual vanities
- Walk-in closet
- Freestanding island
Tags
Property features AI
Finance
- Financial info: Pets allowed
- HOA & community: No association fee
Exterior
- Parking: Attached 2-car garage; Driveway; Paved parking; Garage door opener
- Security: Smoke detectors
- Utilities: Public water; Septic tank sewer; Cable available
- Home design: Single-story home; Entry level: 1; Faces northwest; Under construction
- Construction: Block, concrete and stucco construction; Shingle roof; Built on foundation (details not provided)
- Exterior features: Security/high-impact doors; Open patio and porch; Room for a pool; Patio; Porch
Interior
- Kitchen: Dishwasher; Icemaker; Microwave; Range; Refrigerator (with ice maker); Pantry; Breakfast bar
- Bedrooms: Guest quarters (additional bedroom space); Primary bedroom on main level
- Flooring: Carpet; Tile
- Bathrooms: 2 full bathrooms; Dual sinks; Separate shower
- Heating & cooling: Central heating (electric); Central air conditioning (electric)
- Interior features: Impact glass windows; Breakfast bar; Dual sinks; Main level primary bedroom; Pantry; Shower only (separate shower); Cable TV; Walk-in closets; Split bedroom floorplan
- Laundry & utility: Washer hookup inside; Dryer hookup inside
Neighborhood map
What this means for you Summary
Snapshot
- This is a 3-bed/2.0-bath land listed at $288k.
Deal economics
- At list price, monthly cash flow is $-260 ($-3k/yr) — negative.
- To cash-flow at today's rent, offer at most $250k (13.1% below list).
- To meet the 1% rule (rent ≥ 1% of price), the offer needs to be $219k (23.9% below list).
- Recommended offer: $219k (23.9% below list) — sets the bar for 1% rule.
Location & tenants
- Location reads 62/100 on livability (#750 in FL) — a middle-class / working-renter tenant base. Strengths: cost of living A+, housing A+; Watch: schools F, amenities F, commute F.
- Hendry (town): math 35% / reading 40% proficiency, ranked #65 of 73 in FL (top 89%) — families likely to look elsewhere, expect single-tenant / working-renter base with shorter leases; 75% free/reduced lunch — lower-income household profile, screen leases tightly.
- Market conditions: 942 active listings in the ZIP; 13 comparable units currently listed for rent nearby; rentals at typical pace (median 24d on market — plan ~3-4 weeks tenant-placement turnaround); 557 units permitted in Hendry County in 2024 (45 in 5+ unit buildings).
- At $2,191/mo this rent would consume 46% of the median local household income ($57k/yr) (locally 498% of renters already pay >50% of income on rent) — very limited rent-growth headroom before tenants either downsize or default.
Forward outlook
- In year one you build about $31k of equity ($2k loan paydown + $29k appreciation (10.0% local appreciation)).
- Hendry County population projected to shrink 7% by 2050 — rents likely to lag national; underwrite the cash flow, not the appreciation.
- By year 2, paydown + projected appreciation supports a ~$49k cash-out refi (75% LTV) — recoverable capital for the next deal without selling this one.
Negotiation context
- It's been on market 21 days — a 2% lower offer ($284k) is reasonable based on typical stale-listing flexibility.
- 2 sale attempts with the ask held roughly flat each time — persistent listings suggest the price (not the market) is what's stuck; bring a comps-based counter.
- Current owner paid $6k; list at $288k implies a 4700% gain — meaningful room to come down on a strong offer.
Risks & watch-outs
- Climate carrying-cost: severe wind risk, 99% chance of damaging wind over 30y; extreme-heat days projected 7→25/yr by 2055 (HVAC capex compounding) — expect insurance premiums to compound above CPI over the hold.
Questions for the listing agent
- What do current leases actually rent for vs. the listed asking? Can we see a recent rent roll and the last 12 months of T-12 income?
- Is there a deadline driving the sale (1031 exchange, divorce, estate, relocation)? That informs how much negotiation room exists.
- Schools are F-rated, which usually means shorter tenancies and higher turnover. Who's the typical renter profile here, and what's been the actual vacancy rate?
- The area grade is low — what's the realistic commute time and amenity access for the typical tenant pool here? Any planned neighborhood developments (good or bad) we should know about?
- What's the average days-on-market for RENTAL listings here right now (not sales)? A rising rental-DOM trend means longer vacancies and softer asking-rent achievability than the comps imply.
- What's the recent tenant-quality profile in this submarket — average credit score on applications, eviction rate, late-payment / NSF rate, and stable-employment percentage? A property-management company in the area should have these aggregated.
- How much new for-sale + rental construction is in the pipeline within 1–3 miles? Heavy new supply typically softens prices + rents 12–24 months out; constrained supply supports both.
Investment metrics
- 1% rule
- 0.76% ✗
- Cap rate
- 5.21%
- Cash-on-cash
- -3.87%
- DSCR
- 0.83
- GRM
- 11.0
CMA / ARV
No comps found within radius.
Projected returns pro-forma
10.0% appreciation · 3.0% rent growth · sell at horizon
- IRR
- 21.5%
- Equity multiple
- 2.74×
- Total profit
- $140,338
- Equity at exit
- $259,444
- IRR
- 19.4%
- Equity multiple
- 6.29×
- Total profit
- $426,346
- Equity at exit
- $559,501
Cash invested: $80,637 (down + closing). Projections, not guarantees.
Landlord ↔ Tenant lean methodology
- Overall (STATE)
- 87 Strongly Landlord-Friendly
- State Florida
- 87 Strongly Landlord-Friendly · R+3
- County
- — inherits STATE
- City
- — inherits STATE
ZIP-level market 33935
- Home prices YoY
- 16.3%
- Active inventory
- 942
- Price-to-rent
- 11.0×
Monthly cashflow live
- Estimated rent
- $2,191 high interval (Pro) →
- Mortgage (P&I)
- −$1,510
- Tax est. 1.5%
- −$360 /mo · $4,320/yr
- Insurance
- −$120
- HOA
- −$0
- Vacancy / Maint / Mgmt
- −$460
- Net cashflow
- $-260
Break-even live
UW: 25.0% down · 7.5% · 30yr · 1.5% tax · 5.0% vac · 8.0% maint · 8.0% mgmt
Financing live
Cash to close
- Down payment
- $71,998
- Closing costs
- $8,640
- Reserves months
- —
- Total cash needed
- —
Loan-product check · same deal, 3 products live
Conventional
25% down · 7.5% · 30yr
- Down + closing
- —
- Monthly P&I
- —
- Monthly cashflow
- —
- DSCR
- —
- Eligible?
- —
Personal DTI + credit; lowest rate.
DSCR
20% down · 8.5% · 30yr
- Down + closing
- —
- Monthly P&I
- —
- Monthly cashflow
- —
- DSCR
- —
- Eligible?
- —
No personal income docs; deal must DSCR.
Hard money
10% down · 12.0% · 12mo
- Down + closing
- —
- Monthly P&I
- —
- Monthly cashflow
- —
- DSCR
- —
- Eligible?
- —
Short-term bridge; refi at stabilization.
Rent comps 13 comps
| Address | Beds | Baths | Sqft | Rent | $/sqft | DOM | Units | Dist |
|---|---|---|---|---|---|---|---|---|
| 5029 S Rosebud Cir Labelle, FL | 3.0 | 2.0 | 1389 | $1,780 | $1.28 | 23d | 1 | 0.34mi |
| 801 SW Raintree Blvd Labelle, FL | 3.0 | 2.0 | 1285 | $1,700 | $1.32 | 23d | 1 | 0.72mi |
| 7016 Palpano Cir Labelle, FL | 3.0 | 2.5 | 1507 | $2,100 | $1.39 | 15d | 1 | 0.83mi |
| 7038 Lotus Cir Labelle, FL | 4.0 | 3.0 | 1680 | $2,200 | $1.31 | 15d | 1 | 0.91mi |
| 5029 W Hummingbird Dr Labelle, FL | 3.0 | 2.0 | 1212 | $2,450 | $2.02 | 3d | 1 | 0.92mi |
| 5012 Gunn Pl Labelle, FL | 3.0 | 2.5 | 1783 | $2,500 | $1.40 | 2d | 1 | 0.98mi |
| 6210 Forest Ct Labelle, FL | 3.0 | 2.5 | 1503 | $2,200 | $1.46 | 23d | 1 | 1.04mi |
| 7061 Tide Cir Labelle, FL | 4.0 | 2.0 | 1500 | $1,695 | $1.13 | 23d | 1 | 1.12mi |
| 3051 NW Beechwood Cir Labelle, FL | 4.0 | 2.0 | 1499 | $2,200 | $1.47 | 23d | 1 | 1.28mi |
| 9011 Penny Cir Labelle, FL | 3.0 | 2.0 | 1731 | $2,400 | $1.39 | 23d | 1 | 1.28mi |
| 9001 Penny Cir Labelle, FL | 3.0 | 2.0 | 1472 | $2,300 | $1.56 | 15d | 1 | 1.31mi |
| 9001 Penny Cir Labelle, FL | 3.0 | 2.0 | 1472 | $2,300 | $1.56 | 23d | 1 | 1.31mi |
| 9013 Ike Ct Labelle, FL | 3.0 | 2.0 | 1367 | $2,100 | $1.54 | 2d | 1 | 1.38mi |
Listing history 10 events
-
2026-05-15status Pending
-
2026-04-24$287,990 Active
-
2025-08-20historical
-
2025-08-12$19,000 Active
-
2014-10-03soldstatus $6,000
-
2012-12-11soldstatus $6,000
-
2012-09-25soldstatus $6,000
-
2007-12-07soldstatus $43,000
-
2005-04-27soldstatus $28,000
-
2005-04-21soldstatus $28,000 48-char remark
Show marketing remark (48 chars)
Beautiful Lot close to schools. Ready to Build!!
ⓘ Source: listings_history table (triggers on properties + properties_extension) + one-shot
backfill from property_details.listing_events for pre-trigger history.
Climate risk First Street
- Flood 1/10 Low FEMA zone X (unshaded) · 0% chance over 30 yrs
- Wildfire 2/10 Low
- Heat 9/10 Extreme 7 d/yr ≥108°F today · 25 d/yr by 30 yrs out
- Wind 10/10 Extreme 99% chance of damaging wind over 30 yrs
- Air quality 2/10 Low 0 unhealthy d/yr today · 1 by 30 yrs out
Nearby sold comps map
Loading sold comps map…
Walkable amenities ~0.75 mi
Loading nearby amenities…
Taxation est. · year 1
- Rental income
- $26,286
- − Mortgage interest
- −$16,132
- − Property taxes
- −$4,320
- − Insurance
- −$1,440
- − Repairs & maintenance
- −$2,103
- − Management
- −$2,103
- − Depreciation
- −$8,378
- Taxable loss
- −$8,189
- Est. tax savings @ 24.0%
- +$1,965
- After-tax cash flow
- $-1,151/yr
For passive investors: Depreciation is non-cash, so a rental often shows a tax loss while cash-flowing — sheltering income. Rental losses are passive: they offset passive income freely, and up to $25,000/yr can offset ordinary (W-2) income if you actively participate and your MAGI is under $100k (phasing out to $0 by $150k); unused losses carry forward. On sale, claimed depreciation is recaptured at up to 25%, and gains may owe capital-gains tax (a 1031 exchange can defer both). Figures are a year-1 estimate at your 24.0% rate — not tax advice; consult a CPA.
Schools (NCES district)
- District
- Hendry
- NCES district ID
- 1200780
- Math proficiency
- 35% ▼ -11.00%
- Reading proficiency
- 40% ▼ -4.00%
- Median HH income
- $37,043
- Composite
- 31.16/100
- National rank
- #6054
- State rank
- #65 of 73 in FL
Livability — Port LaBelle
- Score
- 62/100
- State rank
- #750
- US rank
- #16264
Category grades
Schools grade is shown separately in the Schools card above.
Census & demographics
- Census place
- Port LaBelle, FL
- County
- Hendry County · 23,186 people
- Metro
- Clewiston, FL
- Population (ZIP)
- 23,186
- Household income
- $57,009
- Rent vs Own
- Severe rent burden
- 498.0
Population outlook (Hendry County) Hauer SSP2
- Today (2025)
- 38,866 people
- By 2030
- 38,558 · -0.8%
- By 2040
- 37,743 · -2.9%
- By 2050
- 36,117 · -7.1%
- By 2075
- 30,070 · -22.6%
- By 2100
- 21,966 · -43.5%
Race, ethnicity, and origin ACS 2023
- Neighborhood character
- Majority Hispanic (56%)
- Race & ethnicity
- Hispanic / Latino 56% White 39% Two or more races 21% Black 2% Native American 2%
- Hispanic origin (detail)
- Mexican 40% Puerto Rican 3% Cuban 5%
- Common ancestry
- Lithuanian 2% Serbian 2% Slovak 1%
- Foreign-born
- 27% · Canada, Jamaica
- Languages at home
- 50% English-only · Spanish 50%
Political lean MEDSL · Hendry
- 2024 margin
- Solid R (+38.3) · D 30.4% · R 68.7%
- 2008→2024 swing
- -31.1pp toward R · 2008: -7.2pp · 2024: -38.3pp
- All cycles
- 2024: R+38.3 2020: R+23.0 2016: R+14.2 2012: R+5.9 2008: R+7.2
Not yet ingested
- Civics
- —
Market trends
- HPI YoY
- ▲ 75.20%
- Current HPI
- 537.4928
- Rent YoY
- —
- Metro
- Clewiston, FL
- State GDP YoY
- ▲ 3.28%
- F500 in state
- 36
Industry mix (Fortune 500 HQ in FL)
| Industry | F500 HQs | Revenue |
|---|---|---|
| Industrial Technology | 2 | $29B |
|
||
| Insurance | 2 | $17B |
|
||
| Retail | 1 | $60B |
|
||
| Technology Distribution | 1 | $58B |
|
||
| Homebuilding | 1 | $35B |
|
||
| Technology Manufacturing | 1 | $35B |
|
||
Price history
+928.5% since first listed10 events — show timeline
- 2026-05-15 Pending — FORTMLS
- 2026-04-24 Listed $287,990 FORTMLS
- 2025-08-20 Listing Removed — FORTMLS
- 2025-08-12 Listed $19,000 FORTMLS
- 2014-10-03 Sold (Public Records) $6,000 Public Records
- 2012-12-11 Sold (Public Records) $6,000 Public Records
- 2012-09-25 Sold (Public Records) $6,000 Public Records
- 2007-12-07 Sold (Public Records) $43,000 Public Records
- 2005-04-27 Sold (Public Records) $28,000 Public Records
- 2005-04-21 Sold (MLS) $28,000 FORTMLS
Property tax history
+4.6%/yrLatest (2025): $379 · +19.3% YoY. Source: county tax records.
Cash-flow waterfall
monthlySold comps — $/sqft
last 12 mo · ≤1 miLoading sold comps…