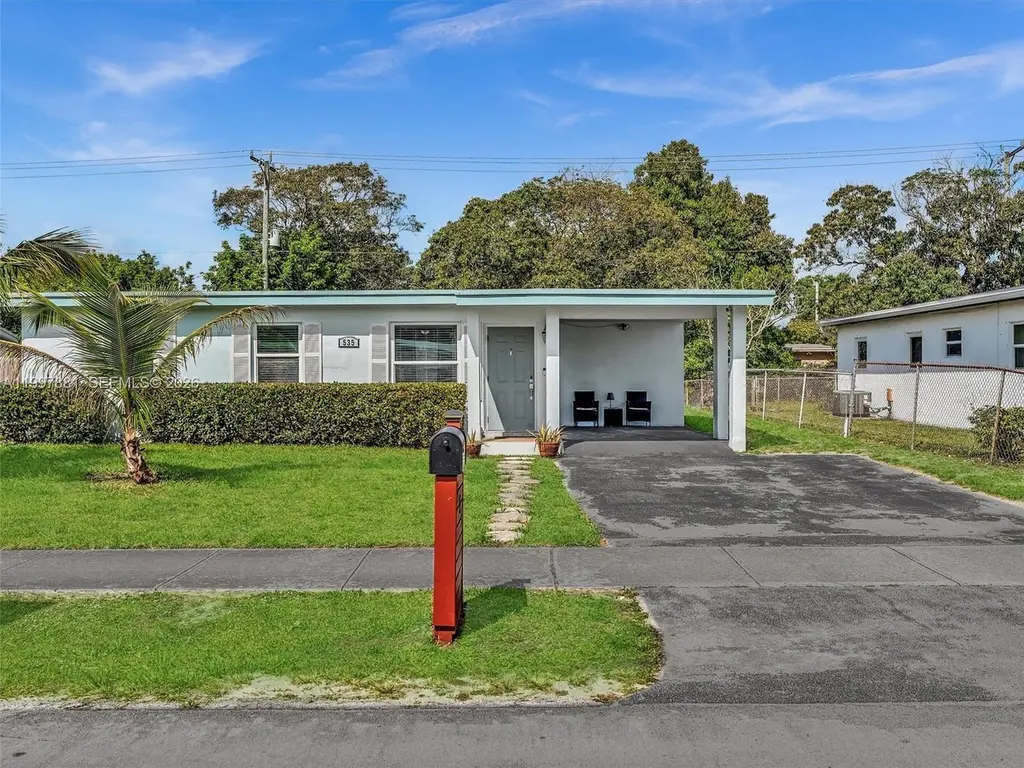
535 NW 29th Ter · Boulevard Gardens, FL
Flood risk 1/10 · Minimal
- FEMA flood zone
- X (shaded)
- Chance of flooding over 30 yrs
- 0.0%
- Est. flood insurance / yr
- $507 – $1,088
Fire risk 1/10 · Minimal
- Est. fire insurance / yr
- $947 – $1,759
Heat risk 10/10 · Severe
- Hot days now (above 105°F)
- 6 days/yr
- Hot days in 30 yrs
- 21 days/yr
Wind risk 10/10 · Severe
- Chance of severe wind over 30 yrs
- 99.0%
Air-quality risk 2/10 · Minimal
- Unhealthy air days now
- 2 days/yr
- Unhealthy air days in 30 yrs
- 2 days/yr
Risk factors via First Street. Map © Google.
Why this score? — see what drove the D+ grade
The composite is a weighted blend of 9 inputs, each scored 0–100. Each bar is that input's sub-score; the figure is the points it added to the 100-point composite (weight × sub-score).
- ARV discount +14.0/15.0
- Cash flow +11.4/30.0
- Livability +4.2/5.0
- Schools +4.1/10.0
- DSCR +3.3/10.0
- Rent growth +3.2/5.0
- 1% rule +2.9/10.0
- Condition / age +2.5/5.0
- Appreciation +0.0/10.0
$364,900
🖨 Deal sheet (PDF) 📄 Offer letter ✓ Due diligence
Listing remarks MLS
Completely remodeled 3 bedroom, 2 bathroom home sitting on a 7,200 sq ft lot in a quite neighborhood with rapid new development surrounded by new homes. Home offers nice sized living room, brand new kitchen with custom cabinetry, and stainless steel appliances to be delivered upon sale. Features a huge driveway with a carport, providing lots of room for parking, and an enormous backyard with room for a pool or for entertaining guests. Minutes away from i-95 and turnpike, close to public transportation, shopping centers, malls, and restaurants.
Key facts
- Spacious yard
- Tiled showers
- Patio seating area
Tags
Property features AI
Finance
- Financial info: Pets allowed with restrictions or possible restrictions (conditional)
Exterior
- Parking: Attached covered carport (2 spaces); Driveway
- Utilities: Public water; Public sewer; Cable available
- Home design: Single-story home; Faces east; Resale property; Builder model: Boulevard Gardens
- Construction: Shingle siding; Shingle roof
- Exterior features: Fruit trees; Less than quarter acre lot
Interior
- Kitchen: Microwave; Refrigerator
- Bedrooms: Bedroom located on the main level
- Flooring: Tile flooring
- Bathrooms: 2 full bathrooms
- Heating & cooling: Central heating; Central air conditioning; Ceiling fan(s)
- Interior features: First-floor entry; Bedroom on main level; Unfurnished
- Laundry & utility: Laundry room; Utility room; Storage room
Neighborhood map
What this means for you Summary
Snapshot
- This is a 3-bed/2.0-bath single-family listed at $365k.
Deal economics
- At list price, monthly cash flow is $-125 ($-2k/yr) — negative.
- To cash-flow at today's rent, offer at most $343k (6.1% below list).
- To meet the 1% rule (rent ≥ 1% of price), the offer needs to be $287k (21.3% below list).
- Recommended offer: $287k (21.3% below list) — sets the bar for 1% rule.
Location & tenants
- Location reads 85/100 on livability (#22 in FL, #511 nationally) — a professional / high-income tenant draw. Strengths: crime A+, commute A+, housing A+; Watch: amenities F.
- Broward (suburban): math 42% / reading 53% proficiency, ranked #46 of 73 in FL (top 63%) — families likely to look elsewhere, expect single-tenant / working-renter base with shorter leases.
- Market conditions: Rents rising (+2.8%/yr); 585 active listings in the ZIP; 40 comparable units currently listed for rent nearby; rentals at typical pace (median 25d on market — plan ~3-4 weeks tenant-placement turnaround); 2,111 units permitted in Broward County in 2024 (1,265 in 5+ unit buildings).
- At $2,873/mo this rent would consume 64% of the median local household income ($54k/yr) (locally 5068% of renters already pay >50% of income on rent) — very limited rent-growth headroom before tenants either downsize or default.
Forward outlook
- Local home prices are declining (-3.0%/yr); year-one equity from $3k of loan paydown is wiped out by about $11k of value loss. Plan a longer hold.
- Broward County population projected at +34% by 2050 — long-run rental-demand tailwind backs the buy-and-hold thesis.
Negotiation context
- It's been on market 34 days — a 3% lower offer ($354k) is reasonable based on typical stale-listing flexibility.
- 7 sale attempts since 11y ago with the ask held roughly flat each time — persistent listings suggest the price (not the market) is what's stuck; bring a comps-based counter.
- Current owner paid $210k; list at $365k implies a 74% gain — meaningful room to come down on a strong offer.
Risks & watch-outs
- Watch-outs: built in 1955 — expect roof / HVAC / electrical / plumbing capex.
- Climate carrying-cost: severe wind risk, 99% chance of damaging wind over 30y; extreme-heat days projected 6→21/yr by 2055 (HVAC capex compounding) — expect insurance premiums to compound above CPI over the hold.
Questions for the listing agent
- What do current leases actually rent for vs. the listed asking? Can we see a recent rent roll and the last 12 months of T-12 income?
- It's been on market 34 days. Have you received any prior offers? Is the seller open to a 21% concession, seller financing, or rate buy-down credit?
- Built in 1955 — when were the roof, HVAC, electrical panel, plumbing, and water heater last replaced?
- Is there a deadline driving the sale (1031 exchange, divorce, estate, relocation)? That informs how much negotiation room exists.
- The area grade is low — what's the realistic commute time and amenity access for the typical tenant pool here? Any planned neighborhood developments (good or bad) we should know about?
- What's the average days-on-market for RENTAL listings here right now (not sales)? A rising rental-DOM trend means longer vacancies and softer asking-rent achievability than the comps imply.
- What's the recent tenant-quality profile in this submarket — average credit score on applications, eviction rate, late-payment / NSF rate, and stable-employment percentage? A property-management company in the area should have these aggregated.
- How much new for-sale + rental construction is in the pipeline within 1–3 miles? Heavy new supply typically softens prices + rents 12–24 months out; constrained supply supports both.
Investment metrics
- 1% rule
- 0.79% ✗
- Cap rate
- 5.88%
- Cash-on-cash
- -1.47%
- DSCR
- 0.93
- GRM
- 10.6
CMA / ARV
- ARV (on-the-fly)
- $426,725
- Comps found
- 8
Show comp detail 8 sales within ~0.75 mi
| Address | Dist | Beds/Ba | Sqft | Sold | Price | $/sf | Match |
|---|---|---|---|---|---|---|---|
| 415 NW 29th Ave | 0.15mi | 3/2.0 | 1,232 (-6%) | 7mo | $400,000 | $325 | 77 |
| 3100 NW 4th Ct | 0.22mi | 2/1.0 (-1) | 1,393 (+6%) | 5mo | $235,000 | $169 | 67 |
| 2741 SW 2nd Ct | 0.62mi | 3/2.0 | 1,335 (+2%) | 9mo | $525,000 | $393 | 61 |
| 213 NW 28th Ave | 0.33mi | 3/2.0 | 1,466 (+12%) | 10mo | $389,900 | $266 | 57 |
| 3490 NW 3rd St | 0.66mi | 3/2.0 | 1,302 (-1%) | 24mo | $450,000 | $346 | 48 |
| 201 SW 28th Ter | 0.53mi | 2/1.0 (-1) | 1,299 (-1%) | 23mo | $395,000 | $304 | 45 |
| 2407 NW 8 St | 0.66mi | 3/2.0 | 1,500 (+14%) | 1mo | $490,000 | $327 | 45 |
| 551 NW 35th Ave | 0.70mi | 3/2.0 | 1,404 (+7%) | 15mo | $365,000 | $260 | 43 |
Match score weights: distance 35% · size 25% · config 20% · recency 20%. Top-matched comps best support the ARV.
Projected returns pro-forma
-3.0% appreciation · 2.78% rent growth · sell at horizon
- IRR
- -19.0%
- Equity multiple
- 0.34×
- Total profit
- $-67,788
- Equity at exit
- $54,408
- IRR
- -12.0%
- Equity multiple
- 0.29×
- Total profit
- $-72,050
- Equity at exit
- $31,550
Cash invested: $102,172 (down + closing). Projections, not guarantees.
Landlord ↔ Tenant lean methodology
- Overall (STATE)
- 87 Strongly Landlord-Friendly
- State Florida
- 87 Strongly Landlord-Friendly · R+3
- County
- — inherits STATE
- City
- — inherits STATE
ZIP-level market 33311
- Rents YoY
- 2.8%
- Active inventory
- 585
- Price-to-rent
- 10.6×
Monthly cashflow live
- Estimated rent
- $2,873 high interval (Pro) →
- Mortgage (P&I)
- −$1,914
- Tax from tax record
- −$329 /mo · $3,952/yr
- Insurance
- −$152
- HOA
- −$0
- Vacancy / Maint / Mgmt
- −$603
- Net cashflow
- $-125
Break-even live
Sensitivity live
| Price | -10% $81 | -5% $-22 | +0% $-125 | +5% $-229 | +10% $-332 |
|---|---|---|---|---|---|
| Rent | -10% $-352 | -5% $-239 | +0% $-125 | +5% $-12 | +10% $102 |
| Rate | -1.0pp $58 | -0.5pp $-33 | base $-125 | +0.5pp $-220 | +1.0pp $-316 |
UW: 25.0% down · 7.5% · 30yr · 1.5% tax · 5.0% vac · 8.0% maint · 8.0% mgmt
Financing live
Cash to close
- Down payment
- $91,225
- Closing costs
- $10,947
- Reserves months
- —
- Total cash needed
- —
Loan-product check · same deal, 3 products live
Conventional
25% down · 7.5% · 30yr
- Down + closing
- —
- Monthly P&I
- —
- Monthly cashflow
- —
- DSCR
- —
- Eligible?
- —
Personal DTI + credit; lowest rate.
DSCR
20% down · 8.5% · 30yr
- Down + closing
- —
- Monthly P&I
- —
- Monthly cashflow
- —
- DSCR
- —
- Eligible?
- —
No personal income docs; deal must DSCR.
Hard money
10% down · 12.0% · 12mo
- Down + closing
- —
- Monthly P&I
- —
- Monthly cashflow
- —
- DSCR
- —
- Eligible?
- —
Short-term bridge; refi at stabilization.
Rent comps 40 comps
| Address | Beds | Baths | Sqft | Rent | $/sqft | DOM | Units | Dist |
|---|---|---|---|---|---|---|---|---|
| 2900 NW 5th Ct Fort Lauderdale, FL | 4.0 | 2.0 | 1112 | $3,250 | $2.92 | 19d | 1 | 0.10mi |
| 540 NW 31st Ave Fort Lauderdale, FL | 4.0 | 2.0 | 1097 | $2,900 | $2.64 | 8d | 1 | 0.14mi |
| 280 NW 31st Ave Fort Lauderdale, FL | 3.0 | 2.0 | 884 | $2,700 | $3.05 | 18d | 1 | 0.24mi |
| 2850 NW 7th St Fort Lauderdale, FL | 3.0 | 2.0 | 1169 | $3,000 | $2.57 | 24d | 1 | 0.25mi |
| 2810 NW 7th St Fort Lauderdale, FL | 4.0 | 2.0 | 1501 | $2,999 | $2.00 | 24d | 1 | 0.28mi |
| 2804 NW 7th Ct Unit 2804 Fort Lauderdale, FL | 3.0 | 2.0 | 1381 | $3,500 | $2.53 | 21d | 1 | 0.33mi |
| 2804 NW 7th Ct Fort Lauderdale, FL | 3.0 | 2.0 | 1381 | $1,300 | $0.94 | 24d | 1 | 0.33mi |
| 204 NW 28th Ave Unit 1 Fort Lauderdale, FL | 2.0 | 1.0 | 1236 | $1,850 | $1.50 | 3d | 1 | 0.35mi |
| 10 NW 28th Way Fort Lauderdale, FL | 3.0 | 1.0 | 1232 | $1,950 | $1.58 | 4d | 1 | 0.37mi |
| 2810 NW 8th Ct Fort Lauderdale, FL | 3.0 | 2.0 | 1435 | $2,850 | $1.99 | 24d | 1 | 0.39mi |
| 3025 NW 8th Rd Fort Lauderdale, FL | 3.0 | 1.0 | 947 | $2,520 | $2.66 | 24d | 1 | 0.44mi |
| 720 NW 33rd Ter Lauderhill, FL | 3.0 | 1.0 | 1340 | $2,560 | $1.91 | 22d | 1 | 0.44mi |
| 3440 NW 4th St Lauderhill, FL | 3.0 | 2.0 | 1525 | $2,900 | $1.90 | 24d | 1 | 0.55mi |
| 3451 NW 6th St Lauderhill, FL | 4.0 | 2.0 | 1700 | $3,000 | $1.76 | 24d | 1 | 0.57mi |
| 2750 SW 2nd Ct Fort Lauderdale, FL | 3.0 | 1.0 | 1187 | $2,385 | $2.01 | 17d | 1 | 0.61mi |
| 2401 NW 7th St Fort Lauderdale, FL | 3.0 | 2.0 | 1300 | $3,600 | $2.77 | 24d | 1 | 0.67mi |
| 2451 NW 8th Pl Unit 1 Fort Lauderdale, FL | 2.0 | 1.0 | 1250 | $1,525 | $1.22 | 22d | 1 | 0.68mi |
| 2435 NW 8th Pl Unit 2 Fort Lauderdale, FL | 2.0 | 1.0 | 1250 | $1,500 | $1.20 | 2d | 1 | 0.68mi |
| 2435 NW 8th Pl Unit 2 Fort Lauderdale, FL | 2.0 | 1.0 | 1250 | $1,500 | $1.20 | 22d | 1 | 0.68mi |
| 2781 SW 4th St Unit 2781 Fort Lauderdale, FL | 3.0 | 2.0 | 1413 | $3,200 | $2.26 | 22d | 1 | 0.71mi |
| 2841 SW 4th Ct Unit 1258737P Fort Lauderdale, FL | 3.0 | 2.0 | 1689 | $4,617 | $2.73 | 5d | 1 | 0.73mi |
| 891 NW 34th Way Lauderhill, FL | 3.0 | 2.0 | 1283 | $2,950 | $2.30 | 24d | 1 | 0.75mi |
| 2836 SW 4th Ct Fort Lauderdale, FL | 3.0 | 2.0 | 1617 | $3,300 | $2.04 | 24d | 1 | 0.75mi |
| 2862 NW 11th St Fort Lauderdale, FL | 3.0 | 2.5 | 1800 | $3,300 | $1.83 | 24d | 1 | 0.76mi |
| 2911 NW 11th St Fort Lauderdale, FL | 4.0 | 2.0 | 1127 | $3,500 | $3.11 | 24d | 1 | 0.79mi |
| 2217 SW 1st Ct Unit 2217 Fort Lauderdale, FL | 3.0 | 2.0 | 1350 | $3,650 | $2.70 | 8d | 1 | 0.81mi |
| 2217 SW 1st Ct Unit 2217 Fort Lauderdale, FL | 3.0 | 2.0 | 1350 | $3,650 | $2.70 | 24d | 1 | 0.81mi |
| 2941 NW 11th Ct Fort Lauderdale, FL | 3.0 | 1.0 | 968 | $2,200 | $2.27 | 24d | 1 | 0.81mi |
| 918 NW 24th Ave Fort Lauderdale, FL | 3.0 | 1.0 | 1332 | $2,300 | $1.73 | 24d | 1 | 0.82mi |
| 3551 SW 1st St Fort Lauderdale, FL | 4.0 | 2.0 | 1720 | $3,150 | $1.83 | 24d | 1 | 0.82mi |
| 420 SW 27th Ave Fort Lauderdale, FL | 3.0 | 1.0–2.0 | 1024 | $3,759 | $3.67 | 24d | 1 | 0.82mi |
| 2825 SW 5th St Fort Lauderdale, FL | 3.0 | 1.0 | 1311 | $3,000 | $2.29 | 24d | 1 | 0.82mi |
| 101 SW 22nd Ave Fort Lauderdale, FL | 3.0 | 2.0 | 1010 | $7,500 | $7.43 | 17d | 1 | 0.86mi |
| 600 NW 38th Ave Lauderhill, FL | 4.0 | 2.0 | 1428 | $2,700 | $1.89 | 24d | 1 | 0.90mi |
| 1123 NW 27th Ave Unit 1 Fort Lauderdale, FL | 3.0 | 1.0 | 1617 | $2,400 | $1.48 | 24d | 1 | 0.90mi |
| 1123 NW 27th Ave Unit 1 Fort Lauderdale, FL | 3.0 | 1.0 | 1617 | $2,400 | $1.48 | 8d | 1 | 0.90mi |
| 401 SW 25th Ave Fort Lauderdale, FL | 3.0 | 1.5 | 1065 | $3,200 | $3.00 | 8d | 1 | 0.91mi |
| 1230 NW 29th Way Fort Lauderdale, FL | 3.0 | 1.0 | 1275 | $2,395 | $1.88 | 24d | 1 | 0.92mi |
| 180 Penn Way Fort Lauderdale, FL | 4.0 | 2.0 | 1378 | $3,550 | $2.58 | 8d | 1 | 0.95mi |
| 3651 NW 8th Ct Lauderhill, FL | 3.0 | 2.0 | 1369 | $3,500 | $2.56 | 18d | 1 | 0.96mi |
Listing history 28 events
-
2026-05-13status Pending
-
2026-04-28historical Active Under Contract
-
2026-04-09$364,900 Active
-
2021-09-07status Pending
-
2021-09-07historical
-
2021-08-27$310,000 Active
-
2018-06-29soldstatus $210,000
-
2018-06-27soldstatus $210,000 Sold 549-char remark
Show marketing remark (549 chars)
Completely remodeled 3 bedroom, 2 bathroom home sitting on a 7,200 sq ft lot in a quite neighborhood with rapid new development surrounded by new homes. Home offers nice sized living room, brand new kitchen with custom cabinetry, and stainless steel appliances to be delivered upon sale. Features a huge driveway with a carport, providing lots of room for parking, and an enormous backyard with room for a pool or for entertaining guests. Minutes away from i-95 and turnpike, close to public transportation, shopping centers, malls, and restaurants.
-
2018-05-17status Backup Contract 549-char remark
Show marketing remark (549 chars)
Completely remodeled 3 bedroom, 2 bathroom home sitting on a 7,200 sq ft lot in a quite neighborhood with rapid new development surrounded by new homes. Home offers nice sized living room, brand new kitchen with custom cabinetry, and stainless steel appliances to be delivered upon sale. Features a huge driveway with a carport, providing lots of room for parking, and an enormous backyard with room for a pool or for entertaining guests. Minutes away from i-95 and turnpike, close to public transportation, shopping centers, malls, and restaurants.
-
2018-05-12price $210,000 549-char remark
Show marketing remark (549 chars)
Completely remodeled 3 bedroom, 2 bathroom home sitting on a 7,200 sq ft lot in a quite neighborhood with rapid new development surrounded by new homes. Home offers nice sized living room, brand new kitchen with custom cabinetry, and stainless steel appliances to be delivered upon sale. Features a huge driveway with a carport, providing lots of room for parking, and an enormous backyard with room for a pool or for entertaining guests. Minutes away from i-95 and turnpike, close to public transportation, shopping centers, malls, and restaurants.
-
2018-05-12$210 Active 549-char remark
Show marketing remark (549 chars)
Completely remodeled 3 bedroom, 2 bathroom home sitting on a 7,200 sq ft lot in a quite neighborhood with rapid new development surrounded by new homes. Home offers nice sized living room, brand new kitchen with custom cabinetry, and stainless steel appliances to be delivered upon sale. Features a huge driveway with a carport, providing lots of room for parking, and an enormous backyard with room for a pool or for entertaining guests. Minutes away from i-95 and turnpike, close to public transportation, shopping centers, malls, and restaurants.
-
2016-08-06historical
-
2016-08-05status Pending
-
2016-08-04status Active
-
2016-07-27status Pending
-
2016-07-16$100,000 Active
-
2015-10-01soldstatus $61,655 Sold
-
2015-08-25status Pending
-
2015-07-22price $64,900
-
2015-05-06price $80,900
-
2015-04-07status Active
-
2015-03-25status Pending
-
2015-01-29$84,900 Active
-
2004-06-11soldstatus $135,000
-
2003-10-13soldstatus $120,000
-
2001-10-15soldstatus $72,000
-
1998-10-23soldstatus $75,000
-
1992-12-22soldstatus $19,000
ⓘ Source: listings_history table (triggers on properties + properties_extension) + one-shot
backfill from property_details.listing_events for pre-trigger history.
Tax reassessment forecast FL · Resets to sale price
- Current annual tax
- $3,952 · $329/mo
- Projected year-2 tax
- $3,952 · $329/mo
- Expected delta
- $0/yr ($0/mo · 0.0%)
ⓘ Screening estimate from a state-policy table — verify with the county assessor before closing.
Climate risk First Street
- Flood 1/10 Low FEMA zone X (shaded) · 0% chance over 30 yrs
- Wildfire 1/10 Low
- Heat 10/10 Extreme 6 d/yr ≥105°F today · 21 d/yr by 30 yrs out
- Wind 10/10 Extreme 99% chance of damaging wind over 30 yrs
- Air quality 2/10 Low 2 unhealthy d/yr today · 2 by 30 yrs out
Nearby sold comps map
Loading sold comps map…
Walkable amenities ~0.75 mi
Loading nearby amenities…
Taxation est. · year 1
- Rental income
- $34,474
- − Mortgage interest
- −$20,440
- − Property taxes
- −$3,952
- − Insurance
- −$1,824
- − Repairs & maintenance
- −$2,758
- − Management
- −$2,758
- − Depreciation
- −$10,615
- Taxable loss
- −$7,874
- Est. tax savings @ 24.0%
- +$1,890
- After-tax cash flow
- $384/yr
For passive investors: Depreciation is non-cash, so a rental often shows a tax loss while cash-flowing — sheltering income. Rental losses are passive: they offset passive income freely, and up to $25,000/yr can offset ordinary (W-2) income if you actively participate and your MAGI is under $100k (phasing out to $0 by $150k); unused losses carry forward. On sale, claimed depreciation is recaptured at up to 25%, and gains may owe capital-gains tax (a 1031 exchange can defer both). Figures are a year-1 estimate at your 24.0% rate — not tax advice; consult a CPA.
Schools (NCES district)
- District
- Broward
- NCES district ID
- 1200180
- Math proficiency
- 42% ▼ -18.00%
- Reading proficiency
- 53% ▼ -5.00%
- Median HH income
- $52,139
- Composite
- 40.88/100
- National rank
- #3621
- State rank
- #46 of 73 in FL
Livability — Boulevard Gardens
- Score
- 85/100
- State rank
- #22
- US rank
- #511
Category grades
Schools grade is shown separately in the Schools card above.
Census & demographics
- Census place
- Boulevard Gardens, FL
- County
- Broward County · 1,963,430 people
- Metro
- Miami-Fort Lauderdale-Pompano Beach, FL
- Population (ZIP)
- 74,898
- Household income
- $53,973
- Rent vs Own
- Severe rent burden
- 5068.0
Population outlook (Broward County) Hauer SSP2
- Today (2025)
- 2,207,033 people
- By 2030
- 2,360,704 · +7.0%
- By 2040
- 2,661,208 · +20.6%
- By 2050
- 2,946,698 · +33.5%
- By 2075
- 3,602,273 · +63.2%
- By 2100
- 3,970,984 · +79.9%
Race, ethnicity, and origin ACS 2023
- Neighborhood character
- Predominantly Black (77%)
- Race & ethnicity
- Black 77% Two or more races 9% White 9% Hispanic / Latino 9%
- Hispanic origin (detail)
- Mexican 1% Puerto Rican 2% Cuban 1%
- Common ancestry
- Hispanic 15% Lithuanian 1% Romanian 0%
- Foreign-born
- 24% · Canada, Jamaica
- Languages at home
- 78% English-only · French/Haitian/Cajun 14% Spanish 6% Other Indo-European 1%
Political lean MEDSL · Broward
- 2024 margin
- D (+17.0) · D 58.0% · R 41.0%
- 2008→2024 swing
- -17.8pp toward R · 2008: 34.7pp · 2024: 17.0pp
- All cycles
- 2024: D+17.0 2020: D+29.8 2016: D+35.0 2012: D+34.9 2008: D+34.7
Not yet ingested
- Civics
- —
Market trends
- HPI YoY
- ▼ -300.68%
- Current HPI
- 535.2504
- Rent YoY
- ▲ 2.78%
- Metro
- Miami-Fort Lauderdale-Pompano Beach, FL
- State GDP YoY
- ▲ 3.28%
- F500 in state
- 36
Industry mix (Fortune 500 HQ in FL)
| Industry | F500 HQs | Revenue |
|---|---|---|
| Industrial Technology | 2 | $29B |
|
||
| Insurance | 2 | $17B |
|
||
| Retail | 1 | $60B |
|
||
| Technology Distribution | 1 | $58B |
|
||
| Homebuilding | 1 | $35B |
|
||
| Technology Manufacturing | 1 | $35B |
|
||
Price history
+1820.5% since first listed28 events — show timeline
- 2026-05-13 Pending — MARMLS
- 2026-04-28 Contingent — MARMLS
- 2026-04-09 Listed $364,900 MARMLS
- 2021-09-07 Pending — MARMLS
- 2021-09-07 Listing Removed — MARMLS
- 2021-08-27 Listed $310,000 MARMLS
- 2018-06-29 Sold (Public Records) $210,000 Public Records
- 2018-06-27 Sold (MLS) $210,000 MARMLS
- 2018-05-17 Pending — MARMLS
- 2018-05-12 Price Changed $210,000 MARMLS
- 2018-05-12 Listed $210 MARMLS
- 2016-08-06 Listing Removed — MARMLS
- 2016-08-05 Pending — MARMLS
- 2016-08-04 Relisted — MARMLS
- 2016-07-27 Pending — MARMLS
- 2016-07-16 Listed $100,000 MARMLS
- 2015-10-01 Sold (MLS) $61,655 MARMLS
- 2015-08-25 Pending — MARMLS
- 2015-07-22 Price Changed $64,900 MARMLS
- 2015-05-06 Price Changed $80,900 MARMLS
- 2015-04-07 Relisted — MARMLS
- 2015-03-25 Pending — MARMLS
- 2015-01-29 Listed $84,900 MARMLS
- 2004-06-11 Sold (Public Records) $135,000 Public Records
- 2003-10-13 Sold (Public Records) $120,000 Public Records
- 2001-10-15 Sold (Public Records) $72,000 Public Records
- 1998-10-23 Sold (Public Records) $75,000 Public Records
- 1992-12-22 Sold (Public Records) $19,000 Public Records
Property tax history
+5.3%/yrLatest (2025): $3,952 · +3.1% YoY. Source: county tax records.
Cash-flow waterfall
monthlySold comps — $/sqft
last 12 mo · ≤1 miLoading sold comps…