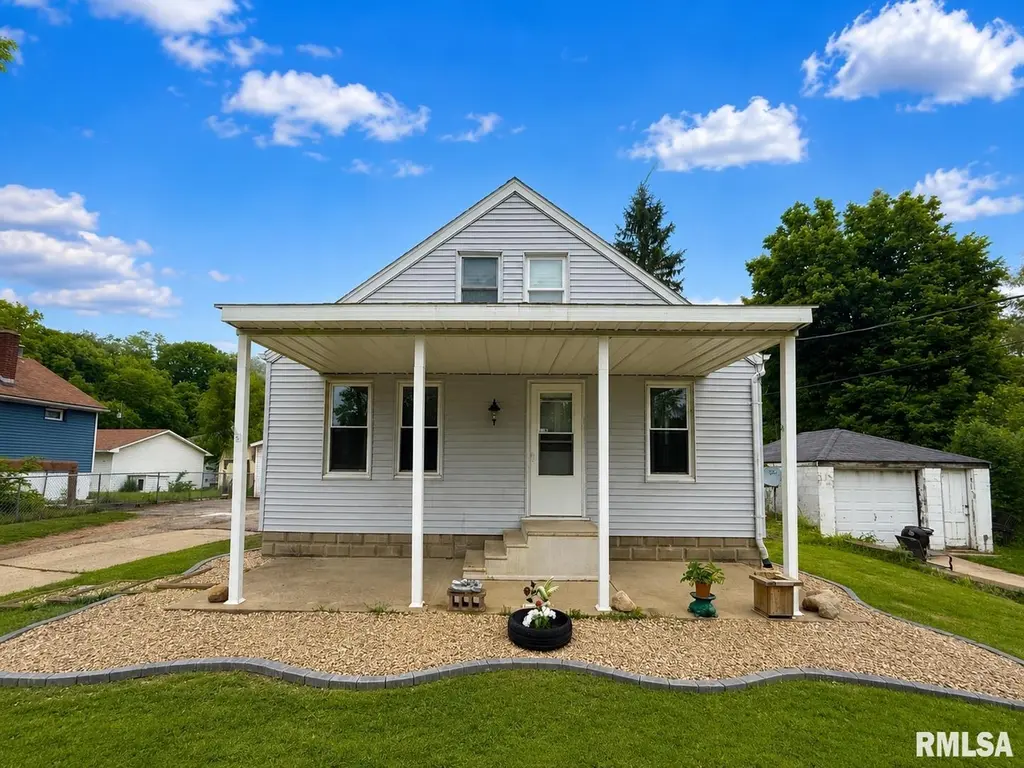
2517 W Magnolia Ave · West Peoria, IL
Flood risk 1/10 · Minimal
- FEMA flood zone
- X
- Chance of flooding over 30 yrs
- 0.0%
- Est. flood insurance / yr
- $473 – $860
Fire risk 1/10 · Minimal
- Est. fire insurance / yr
- $804 – $1,492
Heat risk 3/10 · Minor
- Hot days now (above 105°F)
- 7 days/yr
- Hot days in 30 yrs
- 18 days/yr
Wind risk 2/10 · Minimal
- Chance of severe wind over 30 yrs
- 1.0%
Air-quality risk 3/10 · Minor
- Unhealthy air days now
- 1 days/yr
- Unhealthy air days in 30 yrs
- 3 days/yr
Risk factors via First Street. Map © Google.
Why this score? — see what drove the F grade
The composite is a weighted blend of 9 inputs, each scored 0–100. Each bar is that input's sub-score; the figure is the points it added to the 100-point composite (weight × sub-score).
- Cash flow +7.0/30.0
- Livability +3.8/5.0
- Rent growth +3.1/5.0
- Condition / age +2.5/5.0
- 1% rule +2.3/10.0
- DSCR +1.2/10.0
- Schools +1.1/10.0
- ARV discount +0.0/15.0
- Appreciation +0.0/10.0
$120,000
🖨 Deal sheet 📄 Offer letter ✓ Due diligence
Listing remarks MLS
NICELY UPDATED AND WELL MAINTAINED HOME ON LARGE LOT. THIS HOME FEATURES HARD WOOD FLOORING. FULLY APPLIANCED KITCHEN WITH UPDATED CABINETS AND COUNTERS. TILED MAIN FLOOR BATH. MASTER BEDROOM ON UPPER LEVEL WITH SITTING AREA AND PLENTY OF STORAGE. THE FINISHED BASEMENT AREA WILL SURPRISE YOU WITH WOOD BURNING FIREPLACE AND THEATER EQUIPMENT IN THE FAMILY ROOM. BONUS EXERCISE AREA. LAUNDRY AREA WITH 1/2 BATH AND STORAGE ROOM. EXTERIOR PROVIDES FRONT PORCH, PATIO AREA IN BACK YARD AND OVERSIZED 2 CAR GARAGE. FURNACE 2017, NEWER ROOF, SIDING AND WINDOWS. READY FOR YOU TO MOVE IN AND ENJOY.
Key facts
- 0.24 acre lot
- 2 garage spots
- Built 1920
Property features AI
Finance
- Other: Property located in Pleasant Valley subdivision
- HOA & community: No association fee
Exterior
- Parking: Detached 2-car garage; On-street parking available
- Utilities: Shared well water source; Public sewer
- Home design: Single family residence; Built in 1920
- Construction: Not new construction
- Exterior features: Shingle roof; Lot has other features
Interior
- Kitchen: Kitchen includes refrigerator and microwave
- Bedrooms: 3 bedrooms; Bedroom 1 on the upper level with hardwood floors and an egress window (approx. 18.03 x 12 ft); Bedroom 2 on the main level with hardwood floors and an egress window (approx. 12.09 x 9.1 ft); Bedroom 3 on the main level with hardwood floors and an egress window (approx. 9.05 x 9.05 ft)
- Flooring: Hardwood flooring in main bedrooms and living areas; Tile flooring in basement family room and kitchen; Other flooring in basement office and additional basement areas
- Bathrooms: 1 full bathroom
- Heating & cooling: Forced air heating; Gas water heater; Central air conditioning
- Interior features: Full, partially finished basement; One fireplace; Dishwasher, Dryer, Microwave, Refrigerator, Washer
- Laundry & utility: Laundry room in basement with washer and dryer
Neighborhood map
What this means for you Summary
Snapshot
- This is a 1-bed/1.5-bath single-family listed at $120k.
Deal economics
- At list price, monthly cash flow is $-175 ($-2k/yr) — negative.
- To cash-flow at today's rent, offer at most $89k (25.8% below list).
- To meet the 1% rule (rent ≥ 1% of price), the offer needs to be $88k (26.5% below list).
- Recommended offer: $88k (26.5% below list) — sets the bar for 1% rule.
- Cap rate 4.5% vs local median 6.2% in West Peoria — below-typical yield; the buyer is paying a premium for something (appreciation thesis, condition, location) that the cap rate doesn't capture.
Location & tenants
- Location reads 76/100 on livability (#181 in IL, #3,474 nationally) — a middle-class / working-renter tenant base. Strengths: cost of living A+, housing A+, commute A-; Watch: amenities F.
- Peoria SD 150 (urban): math 11% / reading 14% proficiency, ranked #554 of 620 in IL (top 89%) — low school quality limits family demand, transient renter base, plan for 1-2y turnover; 70% free/reduced lunch — lower-income household profile, screen leases tightly.
- Zoned schools: Peoria High School (math 4% / reading 7%, grade F, #609 of 693 statewide, top 88%, 1,447 students, 0% FRL) — zoned schools average 0% FRL vs 70% district-wide (70 pts lower); this property's tenant base skews higher-income than the district average.
- Market conditions: Rents rising (+2.3%/yr); 180 active listings in the ZIP; 12 comparable units currently listed for rent nearby; rentals lingering (median 44d on market — plan ~5-8 weeks vacancy on turnover, expect pricing pressure); 50% of comp listings sitting > 30 days — soft ceiling on asking rent; 73 units permitted in Peoria County in 2024 (0 in 5+ unit buildings).
Forward outlook
- Local home prices are declining (-3.0%/yr); year-one equity from $830 of loan paydown is wiped out by about $4k of value loss. Plan a longer hold.
- Peoria County population projected at -11% by 2050 — secular population decline; favor cash flow + early exit over multi-decade hold.
Negotiation context
- Only 14 days on market — expect competitive offers; lowballing is unlikely to land.
- 2 sale attempts since 22y ago; this cycle's ask is 67% above the opening price — seller raised mid-cycle; expect resistance to lowballs.
- Current owner paid $75k; list at $120k implies a 60% gain — meaningful room to come down on a strong offer.
Risks & watch-outs
- Watch-outs: built in 1920 — expect roof / HVAC / electrical / plumbing capex.
Questions for the listing agent
- What do current leases actually rent for vs. the listed asking? Can we see a recent rent roll and the last 12 months of T-12 income?
- Built in 1920 — when were the roof, HVAC, electrical panel, plumbing, and water heater last replaced?
- Is there a deadline driving the sale (1031 exchange, divorce, estate, relocation)? That informs how much negotiation room exists.
- Schools are F-rated, which usually means shorter tenancies and higher turnover. Who's the typical renter profile here, and what's been the actual vacancy rate?
- The area grade is low — what's the realistic commute time and amenity access for the typical tenant pool here? Any planned neighborhood developments (good or bad) we should know about?
- What's the average days-on-market for RENTAL listings here right now (not sales)? A rising rental-DOM trend means longer vacancies and softer asking-rent achievability than the comps imply.
- What's the recent tenant-quality profile in this submarket — average credit score on applications, eviction rate, late-payment / NSF rate, and stable-employment percentage? A property-management company in the area should have these aggregated.
- How much new for-sale + rental construction is in the pipeline within 1–3 miles? Heavy new supply typically softens prices + rents 12–24 months out; constrained supply supports both.
Investment metrics
- 1% rule
- 0.73% ✗
- Cap rate
- 4.54%
- Cash-on-cash
- -6.26%
- DSCR
- 0.72
- GRM
- 11.3
CMA / ARV
- ARV (on-the-fly)
- $93,100
- Comps found
- 12
Show comp detail 12 sales within ~0.75 mi
| Address | Dist | Beds/Ba | Sqft | Sold | Price | $/sf | Match |
|---|---|---|---|---|---|---|---|
| 2310 W Heading Ave | 0.44mi | 2/1.0 (+1) | 970 (+2%) | 2mo | $99,000 | $102 | 68 |
| 2530 W Magnolia Ave | 0.04mi | 2/1.0 (+1) | 828 (-13%) | 8mo | $76,000 | $92 | 63 |
| 1409 N Stever Ave | 0.07mi | 2/1.0 (+1) | 848 (-11%) | 11mo | $130,000 | $153 | 62 |
| 2920 W Alice Ave | 0.63mi | 2/1.0 (+1) | 934 (-2%) | 3mo | $50,000 | $54 | 58 |
| 1726 N Pierson Dr | 0.30mi | 2/1.0 (+1) | 1,020 (+7%) | 10mo | $91,410 | $90 | 58 |
| 2017 W Laura Ave | 0.61mi | 2/1.0 (+1) | 942 (-1%) | 10mo | $92,000 | $98 | 55 |
| 727 N Clifton Ct | 0.60mi | 2/1.0 (+1) | 998 (+5%) | 7mo | $50,000 | $50 | 51 |
| 2617 W Kenwood Ave | 0.59mi | 2/1.0 (+1) | 1,016 (+7%) | 4mo | $110,990 | $109 | 51 |
| 2511 W Downs Cir | 0.54mi | 2/1.0 (+1) | 1,063 (+12%) | 2mo | $101,000 | $95 | 47 |
| 730 N Swords Ave | 0.71mi | 2/1.5 (+1) | 860 (-10%) | 2mo | $137,500 | $160 | 44 |
| 2121 W Rohmann Ave | 0.71mi | 2/1.0 (+1) | 1,008 (+6%) | 8mo | $95,000 | $94 | 43 |
| 2905 W Kenwood Ave | 0.64mi | 2/1.0 (+1) | 832 (-12%) | 1mo | $110,000 | $132 | 42 |
Match score weights: distance 35% · size 25% · config 20% · recency 20%. Top-matched comps best support the ARV.
Projected returns pro-forma
-3.0% appreciation · 2.3% rent growth · sell at horizon
- IRR
- -27.9%
- Equity multiple
- 0.07×
- Total profit
- $-31,185
- Equity at exit
- $17,892
- IRR
- -29.3%
- Equity multiple
- -0.31×
- Total profit
- $-43,863
- Equity at exit
- $10,375
Cash invested: $33,600 (down + closing). Projections, not guarantees.
Landlord ↔ Tenant lean methodology
- Overall (STATE)
- 43 Moderately Tenant-Leaning
- State Illinois
- 43 Moderately Tenant-Leaning · D+7
- County
- — inherits STATE
- City
- — inherits STATE
ZIP-level market 61604
- Home prices YoY
- -24.6%
- Rents YoY
- 2.3%
- Active inventory
- 180
- Price-to-rent
- 11.3×
Monthly cashflow live
- Estimated rent
- $882 high interval (Pro) →
- Mortgage (P&I)
- −$629
- Tax from tax record
- −$192 /mo · $2,310/yr
- Insurance
- −$50
- HOA
- −$0
- Vacancy / Maint / Mgmt
- −$185
- Net cashflow
- $-175
Break-even live
UW: 25.0% down · 7.5% · 30yr · 1.5% tax · 5.0% vac · 8.0% maint · 8.0% mgmt
Financing live
Cash to close
- Down payment
- $30,000
- Closing costs
- $3,600
- Reserves months
- —
- Total cash needed
- —
Loan-product check · same deal, 3 products live
Conventional
25% down · 7.5% · 30yr
- Down + closing
- —
- Monthly P&I
- —
- Monthly cashflow
- —
- DSCR
- —
- Eligible?
- —
Personal DTI + credit; lowest rate.
DSCR
20% down · 8.5% · 30yr
- Down + closing
- —
- Monthly P&I
- —
- Monthly cashflow
- —
- DSCR
- —
- Eligible?
- —
No personal income docs; deal must DSCR.
Hard money
10% down · 12.0% · 12mo
- Down + closing
- —
- Monthly P&I
- —
- Monthly cashflow
- —
- DSCR
- —
- Eligible?
- —
Short-term bridge; refi at stabilization.
Rent comps 12 comps
| Address | Beds | Baths | Sqft | Rent | $/sqft | DOM | Units | Dist |
|---|---|---|---|---|---|---|---|---|
| 2610 N Renwood Ave Peoria, IL | 2.0 | 1.0 | 904 | $1,300 | $1.44 | 13d | 1 | 1.01mi |
| 1703 N Valley Ave Peoria, IL | 2.0 | 1.0 | 676 | $1,200 | $1.78 | 13d | 1 | 1.17mi |
| 2920 N Rockwood Dr Apt B Peoria, IL | 2.0 | 1.0 | 800 | $895 | $1.12 | 13d | 1 | 1.29mi |
| 2511 W Wardcliffe Dr Unit H Peoria, IL | 2.0 | 1.0 | 800 | $875 | $1.09 | 43d | 1 | 1.29mi |
| 2600 N Lavalle Ct Peoria, IL | 1.0–3.0 | 1.0–2.0 | 803 | $850 | $1.06 | 13d | 26 | 1.31mi |
| 2317 W Martin Luther King Junior Dr Peoria, IL | 1.0–2.0 | 1.0 | 697 | $775 | $1.11 | 13d | 3 | 1.36mi |
| 2317 W Martin Luther King Junior Dr Unit 1-106 Peoria, IL | 1.0 | 1.0 | 588 | $775 | $1.32 | 43d | 1 | 1.36mi |
| 2317 W Martin Luther King Junior Dr Unit 2-214 Peoria, IL | 2.0 | 1.0 | 807 | $800 | $0.99 | 43d | 1 | 1.36mi |
| 2700 W Forrest Hill Ave Peoria, IL | 2.0 | 1.0 | 850 | $850 | $1.00 | 43d | 1 | 1.39mi |
| 2214 N Linsley St Peoria, IL | 2.0 | 1.0 | 575 | $550 | $0.96 | 43d | 1 | 1.40mi |
| 1401 W Adrian G Hinton Ave Peoria, IL | 2.0 | 1.0 | 1100 | $775 | $0.70 | 43d | 1 | 1.44mi |
| 1220 W John H Gwynn Jr Ave Peoria, IL | 2.0 | 1.0 | 853 | $745 | $0.87 | 21d | 1 | 1.45mi |
Listing history 22 events
-
2026-06-19days on market $120,000 Active 14 DOM
-
2026-06-18days on market $120,000 Active 13 DOM
-
2026-06-17days on market $120,000 Active 12 DOM
-
2026-06-16days on market $120,000 Active 11 DOM
-
2026-06-15days on market $120,000 Active 10 DOM
-
2026-06-14days on market $120,000 Active 8 DOM
-
2026-06-13days on market $120,000 Active 7 DOM
-
2026-06-10statusdays on market $120,000 Active 5 DOM
-
2026-06-03status $120,000 Pending 4 DOM
-
2026-06-02days on market $120,000 Active 4 DOM
-
2026-06-01days on market $120,000 Active 3 DOM
-
2026-05-31days on market $120,000 Active 2 DOM
-
2026-05-22historical $120,000
-
2026-02-26soldstatus $75,000
-
2021-10-14soldstatus $75,000
-
2018-03-26soldstatus $67,600
-
2018-03-23soldstatus $67,500 599-char remark
Show marketing remark (599 chars)
NICELY UPDATED AND WELL MAINTAINED HOME ON LARGE LOT. THIS HOME FEATURES HARD WOOD FLOORING. FULLY APPLIANCED KITCHEN WITH UPDATED CABINETS AND COUNTERS. TILED MAIN FLOOR BATH. MASTER BEDROOM ON UPPER LEVEL WITH SITTING AREA AND PLENTY OF STORAGE. THE FINISHED BASEMENT AREA WILL SURPRISE YOU WITH WOOD BURNING FIREPLACE AND THEATER EQUIPMENT IN THE FAMILY ROOM. BONUS EXERCISE AREA. LAUNDRY AREA WITH 1/2 BATH AND STORAGE ROOM. EXTERIOR PROVIDES FRONT PORCH, PATIO AREA IN BACK YARD AND OVERSIZED 2 CAR GARAGE. FURNACE 2017, NEWER ROOF, SIDING AND WINDOWS. READY FOR YOU TO MOVE IN AND ENJOY.
-
2017-10-02$72,000 599-char remark
Show marketing remark (599 chars)
NICELY UPDATED AND WELL MAINTAINED HOME ON LARGE LOT. THIS HOME FEATURES HARD WOOD FLOORING. FULLY APPLIANCED KITCHEN WITH UPDATED CABINETS AND COUNTERS. TILED MAIN FLOOR BATH. MASTER BEDROOM ON UPPER LEVEL WITH SITTING AREA AND PLENTY OF STORAGE. THE FINISHED BASEMENT AREA WILL SURPRISE YOU WITH WOOD BURNING FIREPLACE AND THEATER EQUIPMENT IN THE FAMILY ROOM. BONUS EXERCISE AREA. LAUNDRY AREA WITH 1/2 BATH AND STORAGE ROOM. EXTERIOR PROVIDES FRONT PORCH, PATIO AREA IN BACK YARD AND OVERSIZED 2 CAR GARAGE. FURNACE 2017, NEWER ROOF, SIDING AND WINDOWS. READY FOR YOU TO MOVE IN AND ENJOY.
-
2008-06-13soldstatus $53,000
-
2004-02-23soldstatus $55,000
-
2004-02-20soldstatus $54,900 295-char remark
Show marketing remark (295 chars)
WHAT A CUTE 2-3 BR, 1.75 BATH BUNGALOW W/UPDATES GALORE!!! UPDATES SINCE 2000: ROOF, FURNACE, WTR HTR, WINDOWS, UPSTAIRS BATH CERAMIC & TOILET, STOVE, REFRIGERATOR & 1 LARGE WINDOW AIR COND. FRESHLY PAINTED. 24X24 2 STALL GARAGE IN EXCELLENT COND. 18X12 UPSTAIRS BONUS RM. FIN BSMT W/FP.
-
2004-01-06$54,900 295-char remark
Show marketing remark (295 chars)
WHAT A CUTE 2-3 BR, 1.75 BATH BUNGALOW W/UPDATES GALORE!!! UPDATES SINCE 2000: ROOF, FURNACE, WTR HTR, WINDOWS, UPSTAIRS BATH CERAMIC & TOILET, STOVE, REFRIGERATOR & 1 LARGE WINDOW AIR COND. FRESHLY PAINTED. 24X24 2 STALL GARAGE IN EXCELLENT COND. 18X12 UPSTAIRS BONUS RM. FIN BSMT W/FP.
ⓘ Source: listings_history table (triggers on properties + properties_extension) + one-shot
backfill from property_details.listing_events for pre-trigger history.
Tax reassessment forecast IL · Partial reset (capped growth)
- Current annual tax
- $2,310 · $192/mo
- Projected year-2 tax
- $2,517 · $210/mo
- Expected delta
- +$207/yr (+$17/mo · 9.0%)
ⓘ Screening estimate from a state-policy table — verify with the county assessor before closing.
Climate risk First Street
- Flood 1/10 Low FEMA zone X · 0% chance over 30 yrs
- Wildfire 1/10 Low
- Heat 3/10 Moderate 7 d/yr ≥105°F today · 18 d/yr by 30 yrs out
- Wind 2/10 Low 100% chance of damaging wind over 30 yrs
- Air quality 3/10 Moderate 1 unhealthy d/yr today · 3 by 30 yrs out
Nearby sold comps map
Loading sold comps map…
Walkable amenities ~0.75 mi
Loading nearby amenities…
Taxation est. · year 1
- Rental income
- $10,580
- − Mortgage interest
- −$6,722
- − Property taxes
- −$2,310
- − Insurance
- −$600
- − Repairs & maintenance
- −$846
- − Management
- −$846
- − Depreciation
- −$3,491
- Taxable loss
- −$4,235
- Est. tax savings @ 24.0%
- +$1,016
- After-tax cash flow
- $-1,087/yr
For passive investors: Depreciation is non-cash, so a rental often shows a tax loss while cash-flowing — sheltering income. Rental losses are passive: they offset passive income freely, and up to $25,000/yr can offset ordinary (W-2) income if you actively participate and your MAGI is under $100k (phasing out to $0 by $150k); unused losses carry forward. On sale, claimed depreciation is recaptured at up to 25%, and gains may owe capital-gains tax (a 1031 exchange can defer both). Figures are a year-1 estimate at your 24.0% rate — not tax advice; consult a CPA.
Schools (NCES district)
- District
- Peoria SD 150
- NCES district ID
- 1731230
- Math proficiency
- 11% ▼ -5.00%
- Reading proficiency
- 14% ▼ -4.00%
- Median HH income
- $41,951
- Composite
- 10.92/100
- National rank
- #9751
- State rank
- #554 of 620 in IL
Livability — West Peoria
- Score
- 76/100
- State rank
- #181
- US rank
- #3474
Category grades
Schools grade is shown separately in the Schools card above.
Census & demographics
- Census place
- West Peoria, IL
- County
- Peoria County · 120,495 people
- Metro
- Peoria, IL
- Population (ZIP)
- 28,313
- Household income
- $52,414
- Rent vs Own
- Severe rent burden
- 815.0
Population outlook (Peoria County) Hauer SSP2
- Today (2025)
- 183,007 people
- By 2030
- 179,643 · -1.8%
- By 2040
- 171,782 · -6.1%
- By 2050
- 163,508 · -10.7%
- By 2075
- 140,178 · -23.4%
- By 2100
- 114,493 · -37.4%
Race, ethnicity, and origin ACS 2023
- Neighborhood character
- Diverse neighborhood (Simpson 0.61)
- Race & ethnicity
- White 55% Black 29% Two or more races 10% Hispanic / Latino 7% Asian 2%
- Hispanic origin (detail)
- Mexican 5%
- Common ancestry
- Italian 2% Slovak 1% Iranian 1%
- Foreign-born
- 6% · Canada, China
- Languages at home
- 92% English-only · Spanish 4% Chinese 1% French/Haitian/Cajun 1%
Political lean MEDSL · Peoria
- 2024 margin
- Toss-up / Even · D 51.5% · R 46.9% · Other 1.6%
- 2008→2024 swing
- -9.2pp toward R · 2008: 13.9pp · 2024: 4.7pp
- All cycles
- 2024: D+4.7 2020: D+6.3 2016: D+2.8 2012: D+4.4 2008: D+13.9
Not yet ingested
- Civics
- —
Market trends
- HPI YoY
- ▼ -54.15%
- Current HPI
- 165.8838
- Rent YoY
- ▲ 2.30%
- Metro
- Peoria, IL
- State GDP YoY
- ▲ 1.59%
- F500 in state
- 60
Industry mix (Fortune 500 HQ in IL)
| Industry | F500 HQs | Revenue |
|---|---|---|
| Insurance | 4 | $201B |
|
||
| Consumer Goods | 4 | $87B |
|
||
| Industrial Machinery | 3 | $64B |
|
||
| Healthcare | 2 | $55B |
|
||
| Retail / Pharmacy | 1 | $148B |
|
||
| Agriculture / Food | 1 | $86B |
|
||
Price history
+118.6% since first listed10 events — show timeline
- 2026-05-22 Coming Soon $120,000 RMLSA as Distributed by MLS Grid
- 2026-02-26 Sold (Public Records) $75,000 Public Records
- 2021-10-14 Sold (Public Records) $75,000 Public Records
- 2018-03-26 Sold (Public Records) $67,600 Public Records
- 2018-03-23 Sold (MLS) $67,500 RMLSA as Distributed by MLS Grid
- 2017-10-02 Listed $72,000 RMLSA as Distributed by MLS Grid
- 2008-06-13 Sold (Public Records) $53,000 Public Records
- 2004-02-23 Sold (Public Records) $55,000 Public Records
- 2004-02-20 Sold (MLS) $54,900 RMLSA as Distributed by MLS Grid
- 2004-01-06 Listed $54,900 RMLSA as Distributed by MLS Grid
Property tax history
+9.6%/yrLatest (2024): $2,310 · +39.1% YoY. Source: county tax records.
Cash-flow waterfall
monthlySold comps — $/sqft
last 12 mo · ≤1 miLoading sold comps…