 🏗️ New Construction
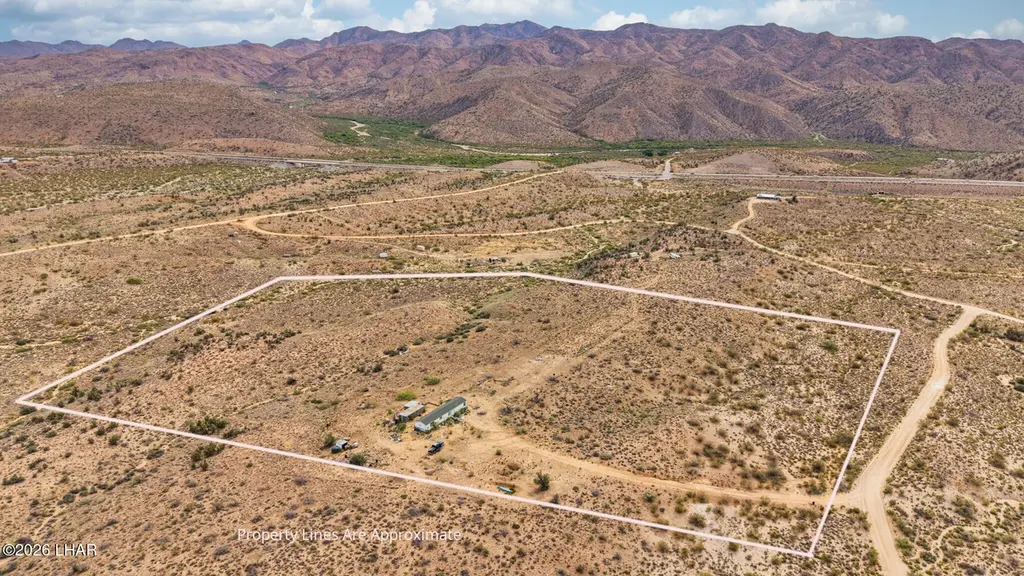
11937 E Cats Claw Trl · Kingman, AZ
Flood risk 1/10 · Minimal
- FEMA flood zone
- X (unshaded)
- Chance of flooding over 30 yrs
- 0.0%
- Est. flood insurance / yr
- $507 – $1,088
Fire risk 5/10 · Moderate
- Est. fire insurance / yr
- $610 – $1,132
Heat risk 7/10 · Major
- Hot days now (above 102°F)
- 7 days/yr
- Hot days in 30 yrs
- 18 days/yr
Wind risk 1/10 · Minimal
- Chance of severe wind over 30 yrs
- —
Air-quality risk 1/10 · Minimal
- Unhealthy air days now
- 0 days/yr
- Unhealthy air days in 30 yrs
- 0 days/yr
Risk factors via First Street. Map © Google.
Why this score? — see what drove the C+ grade
The composite is a weighted blend of 9 inputs, each scored 0–100. Each bar is that input's sub-score; the figure is the points it added to the 100-point composite (weight × sub-score).
- Cash flow +27.0/30.0
- DSCR +9.4/10.0
- ARV discount +7.5/15.0
- 1% rule +6.1/10.0
- Livability +4.0/5.0
- Condition / age +2.5/5.0
- Rent growth +2.4/5.0
- Schools +2.2/10.0
- Appreciation +0.0/10.0
$145,000
🖨 Deal sheet 📄 Offer letter ✓ Due diligence
Listing remarks
Don't miss out on the opportunity to own this amazing property located in a valley with beautiful views of the Hualapai Mountains to the west and the Aquarius Mountains to the east. Almost 20 acres of usable land. This property offers so many options. Update the current manufactured home or place a new home on this property. Property has septic, and a well.
Key facts
- Manufactured home
- Septic
- Well
Tags
Property features AI
Finance
- Other: Zoned M-A-R (Agricultural Residential)
- HOA & community: Has homeowners association; Annual HOA fee of $80 (about $6.67/month)
Exterior
- Parking: No defined parking
- Utilities: Well water; Septic tank; Other utilities
- Home design: Manufactured home (single wide); Single-story
- Construction: Other construction materials; Built as new construction
- Exterior features: Private maintained road; Other roof
Interior
- Bathrooms: 2 full bathrooms
- Heating & cooling: No heating specified; No cooling specified
- Interior features: New construction; Wire fencing
Neighborhood map
What this means for you Summary
Snapshot
- This is a 3-bed/2.0-bath land listed at $145k.
Deal economics
- At list price, monthly cash flow is $407 ($5k/yr) — positive.
- The deal already cash-flows at list — no discount required.
- Meets the 1% rule at list price ($2k rent vs $145k).
- Recommended offer: $136k (6.0% below list) — sets the bar for market timing.
- Cap rate 9.7% vs local median 3.6% in Kingman — top-decile yield for the area; either an underpriced asset or a hidden risk that comps aren't pricing in. Stress-test before assuming the spread holds.
Location & tenants
- Location reads 79/100 on livability (#5 in AZ, #2,014 nationally) — a middle-class / working-renter tenant base. Strengths: commute A+, cost of living A+, housing A+; Watch: crime C-, employment C-, schools D+.
- Owens School District No.6 (4373) (rural): math 25% / reading 25% proficiency, ranked #142 of 249 in AZ (top 57%) — low school quality limits family demand, transient renter base, plan for 1-2y turnover.
- Market conditions: Rents soft (-0.3%/yr); 960 active listings in the ZIP; 2,543 units permitted in Mohave County in 2024 (33 in 5+ unit buildings).
Forward outlook
- Local home prices are declining (-3.0%/yr); year-one equity from $1k of loan paydown is wiped out by about $4k of value loss. Plan a longer hold.
- Mohave County population projected to shrink 6% by 2050 — rents likely to lag national; underwrite the cash flow, not the appreciation.
Negotiation context
- It's been on market 62 days — a 6% lower offer ($136k) is reasonable based on typical stale-listing flexibility.
Risks & watch-outs
- Climate carrying-cost: moderate wildfire risk; extreme-heat days projected 7→18/yr by 2055 (HVAC capex compounding) — expect insurance premiums to compound above CPI over the hold.
Questions for the listing agent
- It's been on market 62 days. Have you received any prior offers? Is the seller open to a 6% concession, seller financing, or rate buy-down credit?
- What does the HOA fee cover, when was the last increase, and are there any pending special assessments or reserve-fund shortfalls?
- Why hasn't it sold? Are there any deal-killer items the seller is aware of (foundation, flood, title, zoning, code violations)?
- Is there a deadline driving the sale (1031 exchange, divorce, estate, relocation)? That informs how much negotiation room exists.
- Schools are D-rated, which usually means shorter tenancies and higher turnover. Who's the typical renter profile here, and what's been the actual vacancy rate?
- What's the average days-on-market for RENTAL listings here right now (not sales)? A rising rental-DOM trend means longer vacancies and softer asking-rent achievability than the comps imply.
- What's the recent tenant-quality profile in this submarket — average credit score on applications, eviction rate, late-payment / NSF rate, and stable-employment percentage? A property-management company in the area should have these aggregated.
- How much new for-sale + rental construction is in the pipeline within 1–3 miles? Heavy new supply typically softens prices + rents 12–24 months out; constrained supply supports both.
Investment metrics
- 1% rule
- 1.11% ✓
- Cap rate
- 9.66%
- Cash-on-cash
- 12.03%
- DSCR
- 1.54
- GRM
- 7.5
CMA / ARV
No comps found within radius.
Projected returns pro-forma
-3.0% appreciation · 0.0% rent growth · sell at horizon
- IRR
- -1.6%
- Equity multiple
- 0.94×
- Total profit
- $-2,354
- Equity at exit
- $21,620
- IRR
- 4.9%
- Equity multiple
- 1.32×
- Total profit
- $12,833
- Equity at exit
- $12,537
Cash invested: $40,600 (down + closing). Projections, not guarantees.
Landlord ↔ Tenant lean methodology
- Overall (STATE)
- 87 Strongly Landlord-Friendly
- State Arizona
- 87 Strongly Landlord-Friendly · R+3
- County
- — inherits STATE
- City
- — inherits STATE
ZIP-level market 86401
- Home prices YoY
- -33.8%
- Rents YoY
- -0.3%
- Active inventory
- 960
- Price-to-rent
- 7.5×
Monthly cashflow live
- Estimated rent
- $1,613 medium interval (Pro) →
- Mortgage (P&I)
- −$760
- Tax from tax record
- −$39 /mo · $468/yr
- Insurance
- −$60
- HOA
- −$7
- Vacancy / Maint / Mgmt
- −$339
- Net cashflow
- $407
Break-even live
UW: 25.0% down · 7.5% · 30yr · 1.5% tax · 5.0% vac · 8.0% maint · 8.0% mgmt
Financing live
Cash to close
- Down payment
- $36,250
- Closing costs
- $4,350
- Reserves months
- —
- Total cash needed
- —
Loan-product check · same deal, 3 products live
Conventional
25% down · 7.5% · 30yr
- Down + closing
- —
- Monthly P&I
- —
- Monthly cashflow
- —
- DSCR
- —
- Eligible?
- —
Personal DTI + credit; lowest rate.
DSCR
20% down · 8.5% · 30yr
- Down + closing
- —
- Monthly P&I
- —
- Monthly cashflow
- —
- DSCR
- —
- Eligible?
- —
No personal income docs; deal must DSCR.
Hard money
10% down · 12.0% · 12mo
- Down + closing
- —
- Monthly P&I
- —
- Monthly cashflow
- —
- DSCR
- —
- Eligible?
- —
Short-term bridge; refi at stabilization.
HOA detail
- Monthly dues
- $7 · $84/yr
Listing history 15 events
-
2026-06-18days on market $145,000 Active 62 DOM
-
2026-06-17days on market $145,000 Active 61 DOM
-
2026-06-16days on market $145,000 Active 60 DOM
-
2026-06-15days on market $145,000 Active 59 DOM
-
2026-06-14days on market $145,000 Active 57 DOM
-
2026-06-13days on market $145,000 Active 56 DOM
-
2026-06-10days on market $145,000 Active 54 DOM
-
2026-06-09days on market $145,000 Active 53 DOM
-
2026-06-08days on market $145,000 Active 52 DOM
-
2026-06-07days on market $145,000 Active 51 DOM
-
2026-06-02days on market $145,000 Active 46 DOM
-
2026-06-01days on market $145,000 Active 45 DOM
-
2026-05-31days on market $145,000 Active 44 DOM
-
2026-05-30days on market $145,000 Active 43 DOM
-
2026-04-17$145,000 Active
ⓘ Source: listings_history table (triggers on properties + properties_extension) + one-shot
backfill from property_details.listing_events for pre-trigger history.
Tax reassessment forecast AZ · Resets to sale price
- Current annual tax
- $468 · $39/mo
- Projected year-2 tax
- $957 · $80/mo
- Expected delta
- +$488/yr (+$41/mo · 104.3%)
ⓘ Screening estimate from a state-policy table — verify with the county assessor before closing.
Climate risk First Street
- Flood 1/10 Low FEMA zone X (unshaded) · 0% chance over 30 yrs
- Wildfire 5/10 Major
- Heat 7/10 Severe 7 d/yr ≥102°F today · 18 d/yr by 30 yrs out
- Wind 1/10 Low
- Air quality 1/10 Low 0 unhealthy d/yr today · 0 by 30 yrs out
Nearby sold comps map
Loading sold comps map…
Walkable amenities ~0.75 mi
Loading nearby amenities…
Taxation est. · year 1
- Rental income
- $19,351
- − Mortgage interest
- −$8,122
- − Property taxes
- −$468
- − Insurance
- −$725
- − Repairs & maintenance
- −$1,548
- − Management
- −$1,548
- − HOA
- −$84
- − Depreciation
- −$4,218
- Taxable income
- $2,637
- Est. tax owed @ 24.0%
- −$633
- After-tax cash flow
- $4,252/yr
For passive investors: Depreciation is non-cash, so a rental often shows a tax loss while cash-flowing — sheltering income. Rental losses are passive: they offset passive income freely, and up to $25,000/yr can offset ordinary (W-2) income if you actively participate and your MAGI is under $100k (phasing out to $0 by $150k); unused losses carry forward. On sale, claimed depreciation is recaptured at up to 25%, and gains may owe capital-gains tax (a 1031 exchange can defer both). Figures are a year-1 estimate at your 24.0% rate — not tax advice; consult a CPA.
Schools (NCES district)
- District
- Owens School District No.6 (4373)
- NCES district ID
- 0405730
- Math proficiency
- 25% ▲ 25.00%
- Reading proficiency
- 25% ▲ 25.00%
- Median HH income
- $46,415
- Composite
- 21.72/100
- National rank
- #8267
- State rank
- #142 of 249 in AZ
Livability — Kingman
- Score
- 79/100
- State rank
- #5
- US rank
- #2014
Category grades
Schools grade is shown separately in the Schools card above.
Census & demographics
- County
- Mohave County · 181,906 people
- City population
- 60,489
- Metro
- Lake Havasu City-Kingman, AZ
- Population (ZIP)
- 30,124
- Household income
- $66,129
- Rent vs Own
- Severe rent burden
- 985.0
Population outlook (Mohave County) Hauer SSP2
- Today (2025)
- 209,184 people
- By 2030
- 209,674 · +0.2%
- By 2040
- 205,897 · -1.6%
- By 2050
- 196,810 · -5.9%
- By 2075
- 169,454 · -19.0%
- By 2100
- 136,630 · -34.7%
Race, ethnicity, and origin ACS 2023
- Neighborhood character
- Predominantly White (76%)
- Race & ethnicity
- White 76% Hispanic / Latino 16% Two or more races 10% Asian 2% Black 1%
- Hispanic origin (detail)
- Mexican 13%
- Common ancestry
- Lithuanian 4% Slovak 2% Portuguese 2%
- Foreign-born
- 5% · Canada
- Languages at home
- 92% English-only · Spanish 6% Other Asian/Pacific 1% Other Indo-European 1%
Political lean MEDSL · Mohave
- 2024 margin
- Solid R (+55.8) · D 21.8% · R 77.6%
- 2008→2024 swing
- -22.9pp toward R · 2008: -32.9pp · 2024: -55.8pp
- All cycles
- 2024: R+55.8 2020: R+51.3 2016: R+51.5 2012: R+42.6 2008: R+32.9
Not yet ingested
- Civics
- —
Market trends
- HPI YoY
- ▼ -128.30%
- Current HPI
- 251.8208
- Rent YoY
- ▼ -0.28%
- Metro
- Lake Havasu City-Kingman, AZ
- State GDP YoY
- ▲ 4.54%
- F500 in state
- 20
Industry mix (Fortune 500 HQ in AZ)
| Industry | F500 HQs | Revenue |
|---|---|---|
| Technology | 2 | $13B |
|
||
| Mining / Metals | 1 | $23B |
|
||
| Environmental Services | 1 | $16B |
|
||
| Metals / Steel | 1 | $14B |
|
||
| Technology Distribution | 1 | $9B |
|
||
| Homebuilding | 1 | $8B |
|
||
Price history
1 event — show timeline
- 2026-04-17 Listed $145,000 LHAR
Property tax history
+2.8%/yrLatest (2025): $468 · +4.5% YoY. Source: county tax records.
Cash-flow waterfall
monthlySold comps — $/sqft
last 12 mo · ≤1 miLoading sold comps…