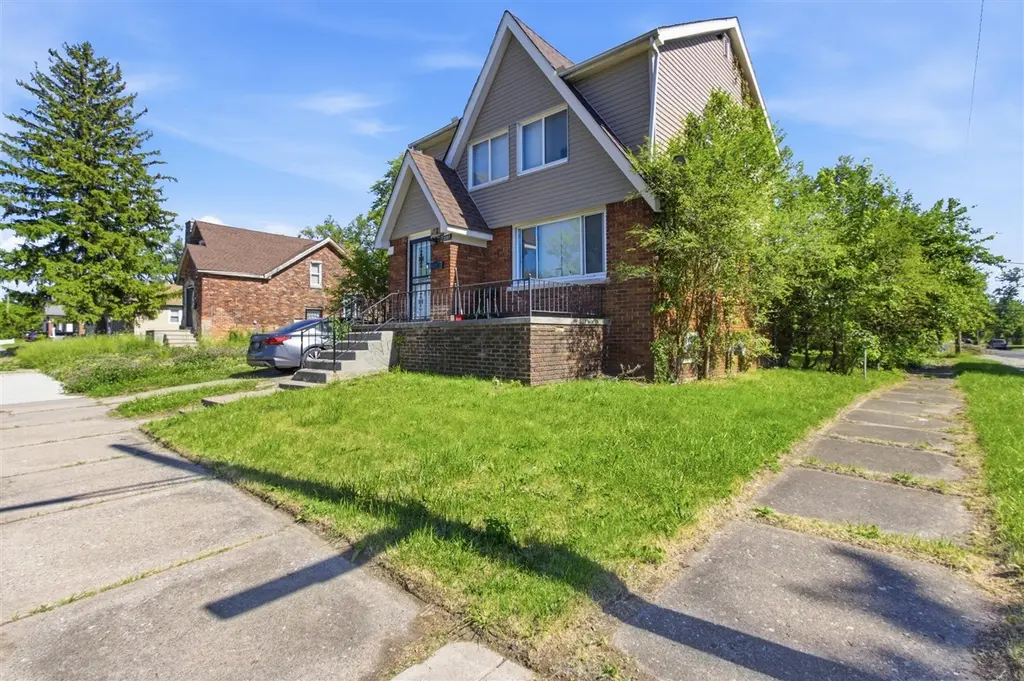
13207 Compass St · Detroit, MI
Flood risk 1/10 · Minimal
- FEMA flood zone
- X (unshaded)
- Chance of flooding over 30 yrs
- 0.0%
- Est. flood insurance / yr
- $473 – $860
Fire risk 1/10 · Minimal
- Est. fire insurance / yr
- $784 – $1,456
Heat risk 2/10 · Minimal
- Hot days now (above 97°F)
- 7 days/yr
- Hot days in 30 yrs
- 14 days/yr
Wind risk 2/10 · Minimal
- Chance of severe wind over 30 yrs
- —
Air-quality risk 3/10 · Minor
- Unhealthy air days now
- 2 days/yr
- Unhealthy air days in 30 yrs
- 5 days/yr
Risk factors via First Street. Map © Google.
Why this score? — see what drove the B- grade
The composite is a weighted blend of 9 inputs, each scored 0–100. Each bar is that input's sub-score; the figure is the points it added to the 100-point composite (weight × sub-score).
- Cash flow +30.0/30.0
- 1% rule +10.0/10.0
- DSCR +10.0/10.0
- ARV discount +7.5/15.0
- Rent growth +3.9/5.0
- Livability +3.7/5.0
- Condition / age +2.5/5.0
- Schools +1.3/10.0
- Appreciation +0.0/10.0
$76,950
🖨 Deal sheet 📄 Offer letter ✓ Due diligence
Listing remarks MLS
Corner Lot, 3 Bedrooms, Modernly Updated, and Original Hardwood Floors Throughout?? Welcome to Happy Homes Subs' Newest Offering. This home offers space to sprawl and a backyard to entertain. Perfect for investors looking to add a cash flowing asset to their portfolio, new investors looking to buy as their first property or an owner occupant looking for the space that their budget does not have to compromise for. Currently rented out at $1,150, MSHDA Housing Choice Vouchers Allow for up to $1,584/Month to be collected on this 3 bedroom. HUD states $1,490 as FMR. Reach out to the Listing Agent to See if you Qualify for ''New Investor Funding'', or another program designed to help you into this exact property.
Key facts
- 5,227 sq ft lot
- Garage
- Built 1928
Property features AI
Exterior
- Parking: Attached garage; Attached parking
- Utilities: Natural gas water heater; Public water
- Home design: Colonial-style single-family residence; Built in 1928; Public water
- Construction: Brick and vinyl siding construction; Asphalt shingle roof; Full basement foundation
- Exterior features: Corner lot; Paved road access
Interior
- Kitchen: Kitchen (includes disposal)
- Bedrooms: Primary bedroom; Two additional bedrooms
- Bathrooms: 1 full bathroom; Primary bathroom
- Heating & cooling: Forced air heating
- Interior features: Disposal; Fireplace; Screens and insulated windows; 7 total rooms; Full basement
- Laundry & utility: Laundry with washer and dryer hookup; Utility room housing furnace and hot water tank
Neighborhood map
What this means for you Summary
Snapshot
- This is a 3-bed/1.0-bath single-family listed at $77k.
Deal economics
- At list price, monthly cash flow is $499 ($6k/yr) — positive.
- The deal already cash-flows at list — no discount required.
- Meets the 1% rule at list price ($1k rent vs $77k).
- Cap rate 14.1% vs local median 10.2% in Detroit — top-decile yield for the area; either an underpriced asset or a hidden risk that comps aren't pricing in. Stress-test before assuming the spread holds.
Location & tenants
- Location reads 73/100 on livability (#218 in MI) — a middle-class / working-renter tenant base. Strengths: amenities A+, commute A+, cost of living A+; Watch: schools F, crime F, employment F.
- Detroit Public Schools Community District (urban): math 10% / reading 24% proficiency, ranked #499 of 540 in MI (top 92%) — low school quality limits family demand, transient renter base, plan for 1-2y turnover; 90% free/reduced lunch — lower-income household profile, screen leases tightly.
- Market conditions: Rents rising fast (+5.6%/yr); 385 active listings in the ZIP; 40 comparable units currently listed for rent nearby; rentals at typical pace (median 20d on market — plan ~3-4 weeks tenant-placement turnaround); lower-income renter base — watch delinquency; 2,639 units permitted in Wayne County in 2024 (1,216 in 5+ unit buildings).
- This rent runs 43% of the median local income ($37k/yr) — at the standard rent-burdened threshold; future hikes will face affordability resistance.
Forward outlook
- Local home prices are declining (-3.0%/yr); year-one equity from $532 of loan paydown is wiped out by about $2k of value loss. Plan a longer hold.
- Wayne County population projected at -17% by 2050 — secular population decline; favor cash flow + early exit over multi-decade hold.
- At projected returns (-3.0% appreciation + 5.6% rent growth), your $22k cash investment doubles in ~4 years — after that, you're playing with house money.
Negotiation context
- Only 7 days on market — expect competitive offers; lowballing is unlikely to land.
- 15 sale attempts since 23y ago; this cycle's ask is 6591% above the opening price — seller raised mid-cycle; expect resistance to lowballs.
- Current owner paid $52k; 48% above their basis — modest negotiation headroom, anchor on the comps not their cost.
Risks & watch-outs
- Watch-outs: built in 1928 — expect roof / HVAC / electrical / plumbing capex.
Questions for the listing agent
- Built in 1928 — when were the roof, HVAC, electrical panel, plumbing, and water heater last replaced?
- Is there a deadline driving the sale (1031 exchange, divorce, estate, relocation)? That informs how much negotiation room exists.
- Schools are F-rated, which usually means shorter tenancies and higher turnover. Who's the typical renter profile here, and what's been the actual vacancy rate?
- Crime grade is F in this area — have there been break-ins, vandalism, or insurance claims at this property in the last 3 years? What carrier currently insures it and at what premium?
- What's the average days-on-market for RENTAL listings here right now (not sales)? A rising rental-DOM trend means longer vacancies and softer asking-rent achievability than the comps imply.
- What's the recent tenant-quality profile in this submarket — average credit score on applications, eviction rate, late-payment / NSF rate, and stable-employment percentage? A property-management company in the area should have these aggregated.
- How much new for-sale + rental construction is in the pipeline within 1–3 miles? Heavy new supply typically softens prices + rents 12–24 months out; constrained supply supports both.
Investment metrics
- 1% rule
- 1.68% ✓
- Cap rate
- 14.08%
- Cash-on-cash
- 27.80%
- DSCR
- 2.24
- GRM
- 5.0
CMA / ARV
- ARV (on-the-fly)
- $31,671
- Comps found
- 12
Show comp detail 12 sales within ~0.75 mi
| Address | Dist | Beds/Ba | Sqft | Sold | Price | $/sf | Match |
|---|---|---|---|---|---|---|---|
| 13192 Schoolcraft | 0.04mi | 4/1.0 (+1) | 1,219 (+4%) | 1mo | $32,000 | $26 | 86 |
| 14284 Cruse St | 0.46mi | 3/1.0 | 1,121 (-4%) | 7mo | $25,000 | $22 | 65 |
| 13991 Ardmore St | 0.47mi | 3/1.0 | 1,080 (-8%) | 2mo | $10,000 | $9 | 63 |
| 14063 Freeland St | 0.52mi | 2/1.0 (-1) | 1,219 (+4%) | 2mo | $23,000 | $19 | 62 |
| 14321 Ardmore St | 0.55mi | 2/2.0 (-1) | 1,188 (+1%) | 2mo | $11,000 | $9 | 62 |
| 13558 Pinehurst St | 0.53mi | 4/1.0 (+1) | 1,099 (-6%) | 2mo | $135,000 | $123 | 58 |
| 12667 Sorrento St | 0.53mi | 3/1.0 | 1,309 (+12%) | 0mo | $65,000 | $50 | 56 |
| 12754 Mendota St | 0.71mi | 3/1.0 | 1,224 (+4%) | 8mo | $28,500 | $23 | 53 |
| 14885 Ward Ave | 0.70mi | 4/1.0 (+1) | 1,222 (+4%) | 4mo | $45,000 | $37 | 52 |
| 14295 Strathmoor St | 0.69mi | 3/1.0 | 1,080 (-8%) | 6mo | $50,000 | $46 | 50 |
| 14598 Ardmore St | 0.68mi | 3/1.0 | 1,296 (+10%) | 8mo | $35,000 | $27 | 45 |
| 14301 Freeland St | 0.58mi | 3/2.0 | 1,020 (-13%) | 7mo | $65,000 | $64 | 41 |
Match score weights: distance 35% · size 25% · config 20% · recency 20%. Top-matched comps best support the ARV.
Projected returns pro-forma
-3.0% appreciation · 5.59% rent growth · sell at horizon
- IRR
- 24.8%
- Equity multiple
- 2.06×
- Total profit
- $22,796
- Equity at exit
- $11,473
- IRR
- 34.2%
- Equity multiple
- 4.52×
- Total profit
- $75,812
- Equity at exit
- $6,653
Cash invested: $21,546 (down + closing). Projections, not guarantees.
Landlord ↔ Tenant lean methodology
- Overall (STATE)
- 62 Landlord-Friendly
- State Michigan
- 62 Landlord-Friendly · EVEN
- County
- — inherits STATE
- City
- — inherits STATE
ZIP-level market 48227
- Rents YoY
- 5.6%
- Active inventory
- 385
- Price-to-rent
- 5.0×
Monthly cashflow live
- Estimated rent
- $1,294 high interval (Pro) →
- Mortgage (P&I)
- −$404
- Tax from tax record
- −$87 /mo · $1,047/yr
- Insurance
- −$32
- HOA
- −$0
- Vacancy / Maint / Mgmt
- −$272
- Net cashflow
- $499
Break-even live
UW: 25.0% down · 7.5% · 30yr · 1.5% tax · 5.0% vac · 8.0% maint · 8.0% mgmt
Financing live
Cash to close
- Down payment
- $19,238
- Closing costs
- $2,308
- Reserves months
- —
- Total cash needed
- —
Loan-product check · same deal, 3 products live
Conventional
25% down · 7.5% · 30yr
- Down + closing
- —
- Monthly P&I
- —
- Monthly cashflow
- —
- DSCR
- —
- Eligible?
- —
Personal DTI + credit; lowest rate.
DSCR
20% down · 8.5% · 30yr
- Down + closing
- —
- Monthly P&I
- —
- Monthly cashflow
- —
- DSCR
- —
- Eligible?
- —
No personal income docs; deal must DSCR.
Hard money
10% down · 12.0% · 12mo
- Down + closing
- —
- Monthly P&I
- —
- Monthly cashflow
- —
- DSCR
- —
- Eligible?
- —
Short-term bridge; refi at stabilization.
Rent comps 40 comps
| Address | Beds | Baths | Sqft | Rent | $/sqft | DOM | Units | Dist |
|---|---|---|---|---|---|---|---|---|
| 14284 Cruse St Detroit, MI | 3.0 | 1.0 | 1121 | $1,150 | $1.03 | 16d | 1 | 0.46mi |
| 13965 Mendota St Detroit, MI | 3.0 | 1.0 | 1222 | $1,294 | $1.06 | 17d | 1 | 0.52mi |
| 14847 Cheyenne St Detroit, MI | 3.0 | 2.0 | 849 | $1,150 | $1.35 | 17d | 1 | 0.62mi |
| 14590 Ardmore St Detroit, MI | 3.0 | 1.0 | 1200 | $1,195 | $1.00 | 2d | 1 | 0.67mi |
| 13331 Strathmoor St Detroit, MI | 3.0 | 1.0 | 1084 | $1,100 | $1.01 | 16d | 1 | 0.68mi |
| 14891 Hartwell St Detroit, MI | 3.0 | 1.0 | 1000 | $1,150 | $1.15 | 43d | 1 | 0.68mi |
| 14903 Tracey St Detroit, MI | 3.0 | 1.0 | 1004 | $1,100 | $1.10 | 16d | 1 | 0.73mi |
| 14559 Strathmoor St Detroit, MI | 2.0 | 1.0 | 1033 | $1,150 | $1.11 | 20d | 1 | 0.79mi |
| 14600 Strathmoor St Detroit, MI | 4.0 | 1.0 | 1300 | $1,450 | $1.12 | 43d | 1 | 0.79mi |
| 12468 Mendota St Detroit, MI | 2.0 | 1.0 | 1100 | $1,100 | $1.00 | 43d | 1 | 0.84mi |
| 12468 Mendota St Detroit, MI | 2.0 | 1.0 | 1100 | $1,000 | $0.91 | 24d | 1 | 0.84mi |
| 15088 Littlefield St Detroit, MI | 2.0 | 1.0 | 1294 | $1,275 | $0.99 | 21d | 1 | 0.85mi |
| 14881 Mendota St Detroit, MI | 3.0 | 1.0 | 1026 | $1,100 | $1.07 | 24d | 1 | 0.85mi |
| 12754 Marlowe St Detroit, MI | 3.0 | 2.0 | 1008 | $1,400 | $1.39 | 16d | 1 | 0.85mi |
| 13620 Kentucky St Detroit, MI | 3.0 | 1.0 | 1248 | $1,200 | $0.96 | 4d | 1 | 0.88mi |
| 14375 Terry St Detroit, MI | 3.0 | 2.0 | 1300 | $1,425 | $1.10 | 43d | 1 | 0.91mi |
| 14264 Coyle St Detroit, MI | 2.0 | 1.0 | 1000 | $1,150 | $1.15 | 43d | 1 | 0.94mi |
| 14104 Coyle St Detroit, MI | 3.0 | 1.0 | 1327 | $1,350 | $1.02 | 4d | 1 | 0.95mi |
| 15340 Hartwell St Detroit, MI | 2.0 | 1.0 | 900 | $1,300 | $1.44 | 16d | 1 | 0.96mi |
| 13279 Coyle St Detroit, MI | 3.0 | 1.0 | 1444 | $1,373 | $0.95 | 43d | 1 | 1.01mi |
| 15073 Strathmoor St Detroit, MI | 2.0 | 1.0 | 860 | $1,350 | $1.57 | 16d | 1 | 1.05mi |
| 14242 Ohio St Detroit, MI | 4.0 | 1.0 | 1400 | $1,000 | $0.71 | 43d | 1 | 1.05mi |
| 15387 Lesure St Detroit, MI | 3.0 | 1.0 | 1064 | $1,350 | $1.27 | 12d | 1 | 1.05mi |
| 15388 Appoline St #203 Detroit, MI | 2.0 | 1.0 | 900 | $850 | $0.94 | 43d | 1 | 1.06mi |
| 13979 Cherrylawn St Detroit, MI | 3.0 | 1.0 | 1296 | $1,334 | $1.03 | 20d | 1 | 1.06mi |
| 12144 Washburn St Detroit, MI | 3.0 | 1.0 | 1200 | $1,200 | $1.00 | 14d | 1 | 1.10mi |
| Ohio St Unit 4 Detroit, MI | 4.0 | 1.5 | 1400 | $750 | $0.54 | 43d | 1 | 1.10mi |
| 14814 Sussex St Unit 2 Detroit, MI | 3.0 | 1.0 | 1100 | $1,000 | $0.91 | 43d | 1 | 1.14mi |
| 12775 Plymouth Rd Unit 16 Detroit, MI | 2.0 | 1.0 | 1009 | $825 | $0.82 | 43d | 1 | 1.15mi |
| 14570 Cherrylawn St Detroit, MI | 3.0 | 1.0 | 840 | $1,250 | $1.49 | 12d | 1 | 1.19mi |
| 15517 Lesure St Unit BDRM1A Detroit, MI | 2.0 | 1.0 | 1000 | $850 | $0.85 | 24d | 1 | 1.19mi |
| 12703 Northlawn St Detroit, MI | 2.0 | 1.0 | 1365 | $1,053 | $0.77 | 20d | 1 | 1.21mi |
| 15738 Sorrento Ave Detroit, MI | 3.0 | 1.0 | 762 | $1,175 | $1.54 | 43d | 1 | 1.21mi |
| 12039 Lauder St Detroit, MI | 3.0 | 1.5 | 1000 | $1,500 | $1.50 | 24d | 1 | 1.21mi |
| 14011 Roselawn St Detroit, MI | 4.0 | 1.5 | 1300 | $1,450 | $1.12 | 1d | 1 | 1.23mi |
| 14011 Roselawn St Detroit, MI | 4.0 | 1.5 | 1300 | $1,450 | $1.12 | 17d | 1 | 1.23mi |
| 14550 Northlawn St Detroit, MI | 3.0 | 2.0 | 950 | $1,200 | $1.26 | 16d | 1 | 1.23mi |
| 12014 Terry St Detroit, MI | 2.0 | 1.0 | 1361 | $1,200 | $0.88 | 43d | 1 | 1.25mi |
| 15341 Lauder St Detroit, MI | 4.0 | 1.5 | 1080 | $1,475 | $1.37 | 16d | 1 | 1.27mi |
| 15512 Mendota St Apt 2 Detroit, MI | 2.0 | 1.0 | 1000 | $1,200 | $1.20 | 43d | 1 | 1.27mi |
Listing history 10 events
-
2026-06-18days on market $76,950 Active 7 DOM
-
2026-06-17days on market $76,950 Active 6 DOM
-
2026-06-16days on market $76,950 Active 5 DOM
-
2026-06-15days on market $76,950 Active 4 DOM
-
2026-06-13days on market $76,950 Active 2 DOM
-
2026-06-13statusdays on market $76,950 Active 1 DOM
-
2026-06-09days on market $76,950 Coming Soon 5 DOM
-
2026-06-08days on market $76,950 Coming Soon 4 DOM
-
2026-06-07remarks 699-char remark
-
2026-06-07$76,950 Coming Soon 3 DOM
ⓘ Source: listings_history table (triggers on properties + properties_extension) + one-shot
backfill from property_details.listing_events for pre-trigger history.
Tax reassessment forecast MI · Partial reset (capped growth)
- Current annual tax
- $1,047 · $87/mo
- Projected year-2 tax
- $1,116 · $93/mo
- Expected delta
- +$69/yr (+$6/mo · 6.6%)
ⓘ Screening estimate from a state-policy table — verify with the county assessor before closing.
Climate risk First Street
- Flood 1/10 Low FEMA zone X (unshaded) · 0% chance over 30 yrs
- Wildfire 1/10 Low
- Heat 2/10 Low 7 d/yr ≥97°F today · 14 d/yr by 30 yrs out
- Wind 2/10 Low
- Air quality 3/10 Moderate 2 unhealthy d/yr today · 5 by 30 yrs out
Nearby sold comps map
Loading sold comps map…
Walkable amenities ~0.75 mi
Loading nearby amenities…
Taxation est. · year 1
- Rental income
- $15,525
- − Mortgage interest
- −$4,310
- − Property taxes
- −$1,047
- − Insurance
- −$385
- − Repairs & maintenance
- −$1,242
- − Management
- −$1,242
- − Depreciation
- −$2,239
- Taxable income
- $5,060
- Est. tax owed @ 24.0%
- −$1,214
- After-tax cash flow
- $4,776/yr
For passive investors: Depreciation is non-cash, so a rental often shows a tax loss while cash-flowing — sheltering income. Rental losses are passive: they offset passive income freely, and up to $25,000/yr can offset ordinary (W-2) income if you actively participate and your MAGI is under $100k (phasing out to $0 by $150k); unused losses carry forward. On sale, claimed depreciation is recaptured at up to 25%, and gains may owe capital-gains tax (a 1031 exchange can defer both). Figures are a year-1 estimate at your 24.0% rate — not tax advice; consult a CPA.
Schools (NCES district)
- District
- Detroit Public Schools Community District
- NCES district ID
- 2601103
- Math proficiency
- 10% ▼ -2.00%
- Reading proficiency
- 24% ▲ 6.00%
- Median HH income
- $25,815
- Composite
- 13.06/100
- National rank
- #9564
- State rank
- #499 of 540 in MI
Livability — Detroit
- Score
- 73/100
- State rank
- #218
- US rank
- #5427
Category grades
Schools grade is shown separately in the Schools card above.
Census & demographics
- Census place
- Detroit, MI
- County
- Wayne County · 1,562,939 people
- City population
- 572,865
- Metro
- Detroit-Warren-Dearborn, MI
- Population (ZIP)
- 40,302
- Household income
- $36,527
- Rent vs Own
- Severe rent burden
- 2371.0
Population outlook (Wayne County) Hauer SSP2
- Today (2025)
- 1,675,273 people
- By 2030
- 1,620,300 · -3.3%
- By 2040
- 1,502,341 · -10.3%
- By 2050
- 1,384,039 · -17.4%
- By 2075
- 1,124,592 · -32.9%
- By 2100
- 881,193 · -47.4%
Race, ethnicity, and origin ACS 2023
- Neighborhood character
- Predominantly Black (95%)
- Race & ethnicity
- Black 95% Two or more races 3% White 1%
- Foreign-born
- 1%
- Languages at home
- 98% English-only · Spanish 1% French/Haitian/Cajun 1%
Political lean MEDSL · Wayne
- 2024 margin
- Strong D (+29.0) · D 62.7% · R 33.7% · Other 3.6%
- 2008→2024 swing
- -20.5pp toward R · 2008: 49.5pp · 2024: 29.0pp
- All cycles
- 2024: D+29.0 2020: D+38.1 2016: D+37.3 2012: D+46.9 2008: D+49.5
Not yet ingested
- Civics
- —
Market trends
- HPI YoY
- ▼ -125.00%
- Current HPI
- 186.4158
- Rent YoY
- ▲ 5.59%
- Metro
- Detroit-Warren-Dearborn, MI
- State GDP YoY
- ▲ 1.37%
- F500 in state
- 28
Industry mix (Fortune 500 HQ in MI)
| Industry | F500 HQs | Revenue |
|---|---|---|
| Automotive Parts | 3 | $48B |
|
||
| Automotive | 2 | $372B |
|
||
| Chemicals | 1 | $45B |
|
||
| Automotive Retail | 1 | $29B |
|
||
| Healthcare / Medical Devices | 1 | $23B |
|
||
| Automotive Technology | 1 | $20B |
|
||
Price history
+339.7% since first listed44 events — show timeline
- 2026-06-04 Coming Soon $76,950 MiRealSource-MiMLS
- 2026-06-04 Coming Soon $76,950 SW Michigan MLS
- 2023-10-06 Rental Removed $1,150 APPFOLIO
- 2023-08-29 Listed for Rent $1,150 APPFOLIO
- 2023-05-11 Sold (Public Records) $52,000 Public Records
- 2023-04-28 Sold (MLS) $52,000 MiRealSource-MiMLS
- 2023-04-28 Sold (MLS) $52,000 REALCOMP
- 2023-04-17 Pending — MiRealSource-MiMLS
- 2023-04-17 Pending — REALCOMP
- 2023-04-07 Contingent — MiRealSource-MiMLS
- 2023-04-07 Contingent — REALCOMP
- 2023-03-31 Listed $59,900 MiRealSource-MiMLS
- 2023-03-31 Listed $59,900 REALCOMP
- 2023-03-29 Coming Soon $59,900 REALCOMP
- 2023-03-29 Coming Soon $59,900 MiRealSource-MiMLS
- 2022-11-12 Listing Removed — MiRealSource-MiMLS
- 2022-11-11 Listing Removed — REALCOMP
- 2022-08-03 Listed $60,000 MiRealSource-MiMLS
- 2022-08-03 Listed $60,000 REALCOMP
- 2009-07-20 Sold (MLS) $2,067 REALCOMP
- 2009-05-08 Listed $2,400 REALCOMP
- 2009-05-07 Listing Removed — REALCOMP
- 2009-02-06 Listed $2,400 REALCOMP
- 2008-04-04 Listing Removed — MiRealSource-MiMLS
- 2008-04-03 Listing Removed — REALCOMP
- 2007-07-08 Listed $26,182 REALCOMP
- 2007-07-08 Listed $22,254 MiRealSource-MiMLS
- 2007-06-18 Listing Removed — REALCOMP
- 2007-02-16 Listed $28,800 REALCOMP
- 2004-03-24 Sold (Public Records) $86,000 Public Records
- 2004-01-28 Listing Removed — REALCOMP
- 2003-11-21 Listed $86,000 REALCOMP
- 2003-10-29 Listing Removed — REALCOMP
- 2003-10-03 Listed $86,000 REALCOMP
- 2003-10-01 Listing Removed — REALCOMP
- 2003-06-18 Listed $82,500 REALCOMP
- 2003-06-11 Listing Removed — REALCOMP
- 2003-05-14 Listed $82,500 REALCOMP
- 2003-05-13 Listing Removed — REALCOMP
- 2003-05-08 Listed $82,500 REALCOMP
- 2002-02-22 Sold (Public Records) $78,843 Public Records
- 2001-02-21 Sold (Public Records) $12,500 Public Records
- 2001-02-21 Sold (Public Records) $72,000 Public Records
- 2001-02-21 Sold (Public Records) $17,500 Public Records
Property tax history
-3.2%/yrLatest (2025): $1,047 · +0.5% YoY. Source: county tax records.
Cash-flow waterfall
monthlySold comps — $/sqft
last 12 mo · ≤1 miLoading sold comps…